

Global lipid remodelling by hypoxia aggravates migratory potential in pancreatic cancer while maintaining plasma membrane homeostasis
- PMID: 37748704
- PMCID: PMC7616916
- DOI: 10.1016/j.bbalip.2023.159398
Global lipid remodelling by hypoxia aggravates migratory potential in pancreatic cancer while maintaining plasma membrane homeostasis
Abstract
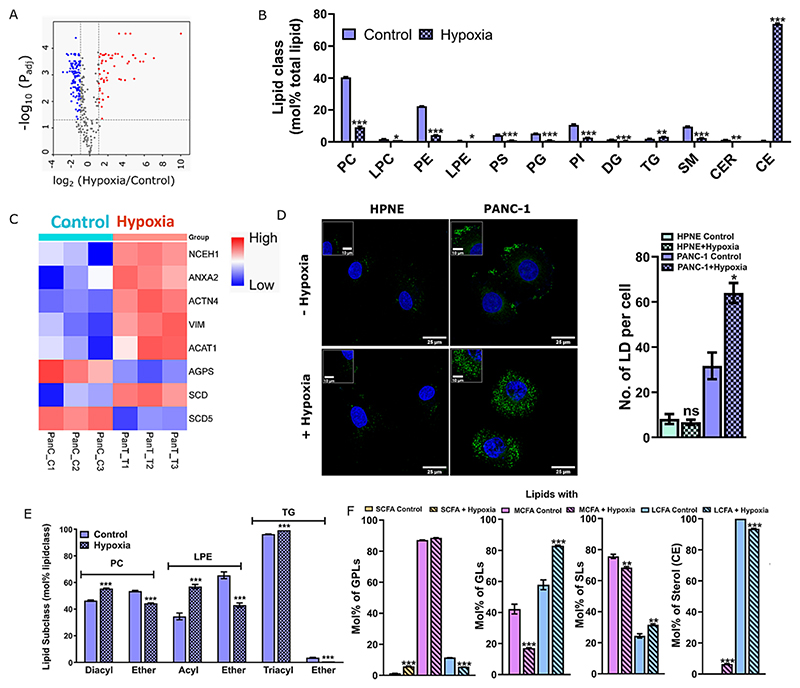
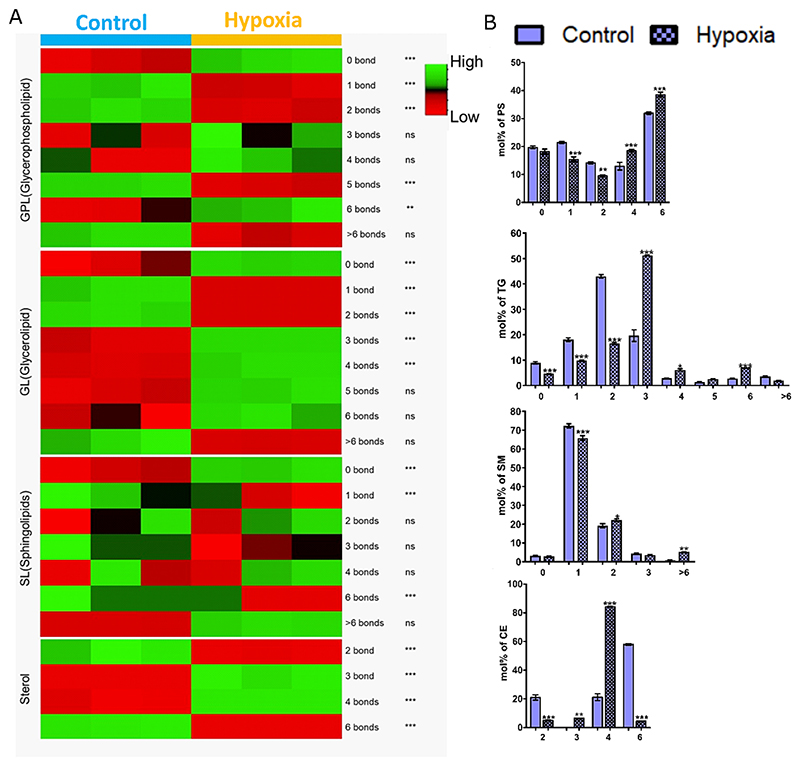
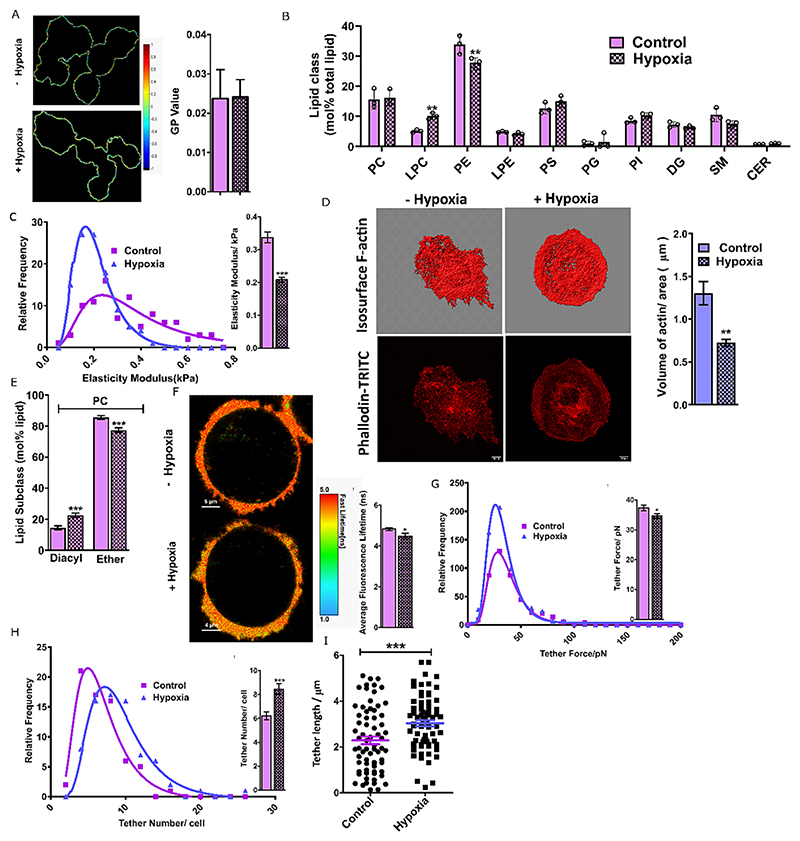
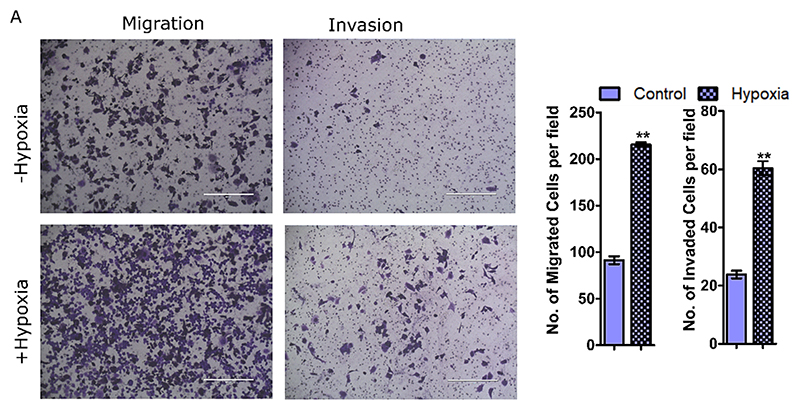
Hypoxia plays an important role in pancreatic cancer progression. It drives various metabolic reprogramming in cells including that of lipids, which in turn, can modify the structure and function of cell membranes. Homeostatic adaptation of membranes is well-recognized, but how and if it is regulated in hypoxic pancreatic cancer and its relation to aggressive phenotype and metastasis remains elusive. Here we show hypoxia-induced extensive global lipid remodelling spanning changes in lipid classes, unsaturation levels, glyceryl backbone and acyl chain lengths. No major modulation of plasma membrane biophysical properties revealed a decoupling of lipidome modulation from membrane properties under hypoxia. This was supported by observing minor changes in the lipidome of plasma membranes under hypoxia. Further, hypoxia increased migration and invasion underpinned by reduced actin volume, cell cortical stiffness and facile tether dynamics. In conclusion, we demonstrate buffering of the lipidome alterations leading to a homeostatic membrane response. These findings will help to understand the hypoxic regulation of pancreatic membrane homeostasis and identify tangible theranostic avenues.
Keywords: Cell membranes; Hypoxia; Lipidomics; Membrane biophysics; Pancreatic cancer.
Copyright © 2023 Elsevier B.V. All rights reserved.
Conflict of interest statement
Declaration of competing interest The authors have no conflict of interest to declare.
Figures
Similar articles
-
Targeting hypoxic tumor microenvironment in pancreatic cancer.J Hematol Oncol. 2021 Jan 13;14(1):14. doi: 10.1186/s13045-020-01030-w. J Hematol Oncol. 2021. PMID: 33436044 Free PMC article. Review.
-
Lipidomic and biophysical homeostasis of mammalian membranes counteracts dietary lipid perturbations to maintain cellular fitness.Nat Commun. 2020 Mar 12;11(1):1339. doi: 10.1038/s41467-020-15203-1. Nat Commun. 2020. PMID: 32165635 Free PMC article.
-
Curcumin inhibits pancreatic cancer cell invasion and EMT by interfering with tumor‑stromal crosstalk under hypoxic conditions via the IL‑6/ERK/NF‑κB axis.Oncol Rep. 2020 Jul;44(1):382-392. doi: 10.3892/or.2020.7600. Epub 2020 Apr 28. Oncol Rep. 2020. PMID: 32377752
-
Hypoxia-independent gene expression mediated by SOX9 promotes aggressive pancreatic tumor biology.Mol Cancer Res. 2014 Mar;12(3):421-32. doi: 10.1158/1541-7786.MCR-13-0351. Epub 2013 Dec 3. Mol Cancer Res. 2014. PMID: 24302456
-
Metabolic reprogramming due to hypoxia in pancreatic cancer: Implications for tumor formation, immunity, and more.Biomed Pharmacother. 2021 Sep;141:111798. doi: 10.1016/j.biopha.2021.111798. Epub 2021 Jun 10. Biomed Pharmacother. 2021. PMID: 34120068 Review.
Cited by
-
Metabolic ripple effects - deciphering how lipid metabolism in cancer interfaces with the tumor microenvironment.Dis Model Mech. 2024 Sep 1;17(9):dmm050814. doi: 10.1242/dmm.050814. Epub 2024 Sep 16. Dis Model Mech. 2024. PMID: 39284708 Free PMC article. Review.
-
Single-Cell Untargeted Lipidomics Using Liquid Chromatography and Data-Dependent Acquisition after Live Cell Selection.Anal Chem. 2024 May 7;96(18):6922-6929. doi: 10.1021/acs.analchem.3c05677. Epub 2024 Apr 23. Anal Chem. 2024. PMID: 38653330 Free PMC article.
-
Hypoxia and lipid metabolism related genes drive proliferation migration and immune infiltration mechanisms in colorectal cancer subtyping.Sci Rep. 2025 Jan 18;15(1):2394. doi: 10.1038/s41598-025-85809-2. Sci Rep. 2025. PMID: 39827204 Free PMC article.
-
Transcriptomic Alterations of Canine Histiocytic Sarcoma Cells in Response to Different Stressors.Int J Mol Sci. 2025 Jul 10;26(14):6629. doi: 10.3390/ijms26146629. Int J Mol Sci. 2025. PMID: 40724877 Free PMC article.
References
Publication types
MeSH terms
Substances
Grants and funding
LinkOut - more resources
Full Text Sources
Medical
