

Naked-Eye Thiol Analyte Detection via Self-Propagating, Amplified Reaction Cycle
- PMID: 37748772
- PMCID: PMC10557148
- DOI: 10.1021/jacs.3c02937
Naked-Eye Thiol Analyte Detection via Self-Propagating, Amplified Reaction Cycle
Abstract
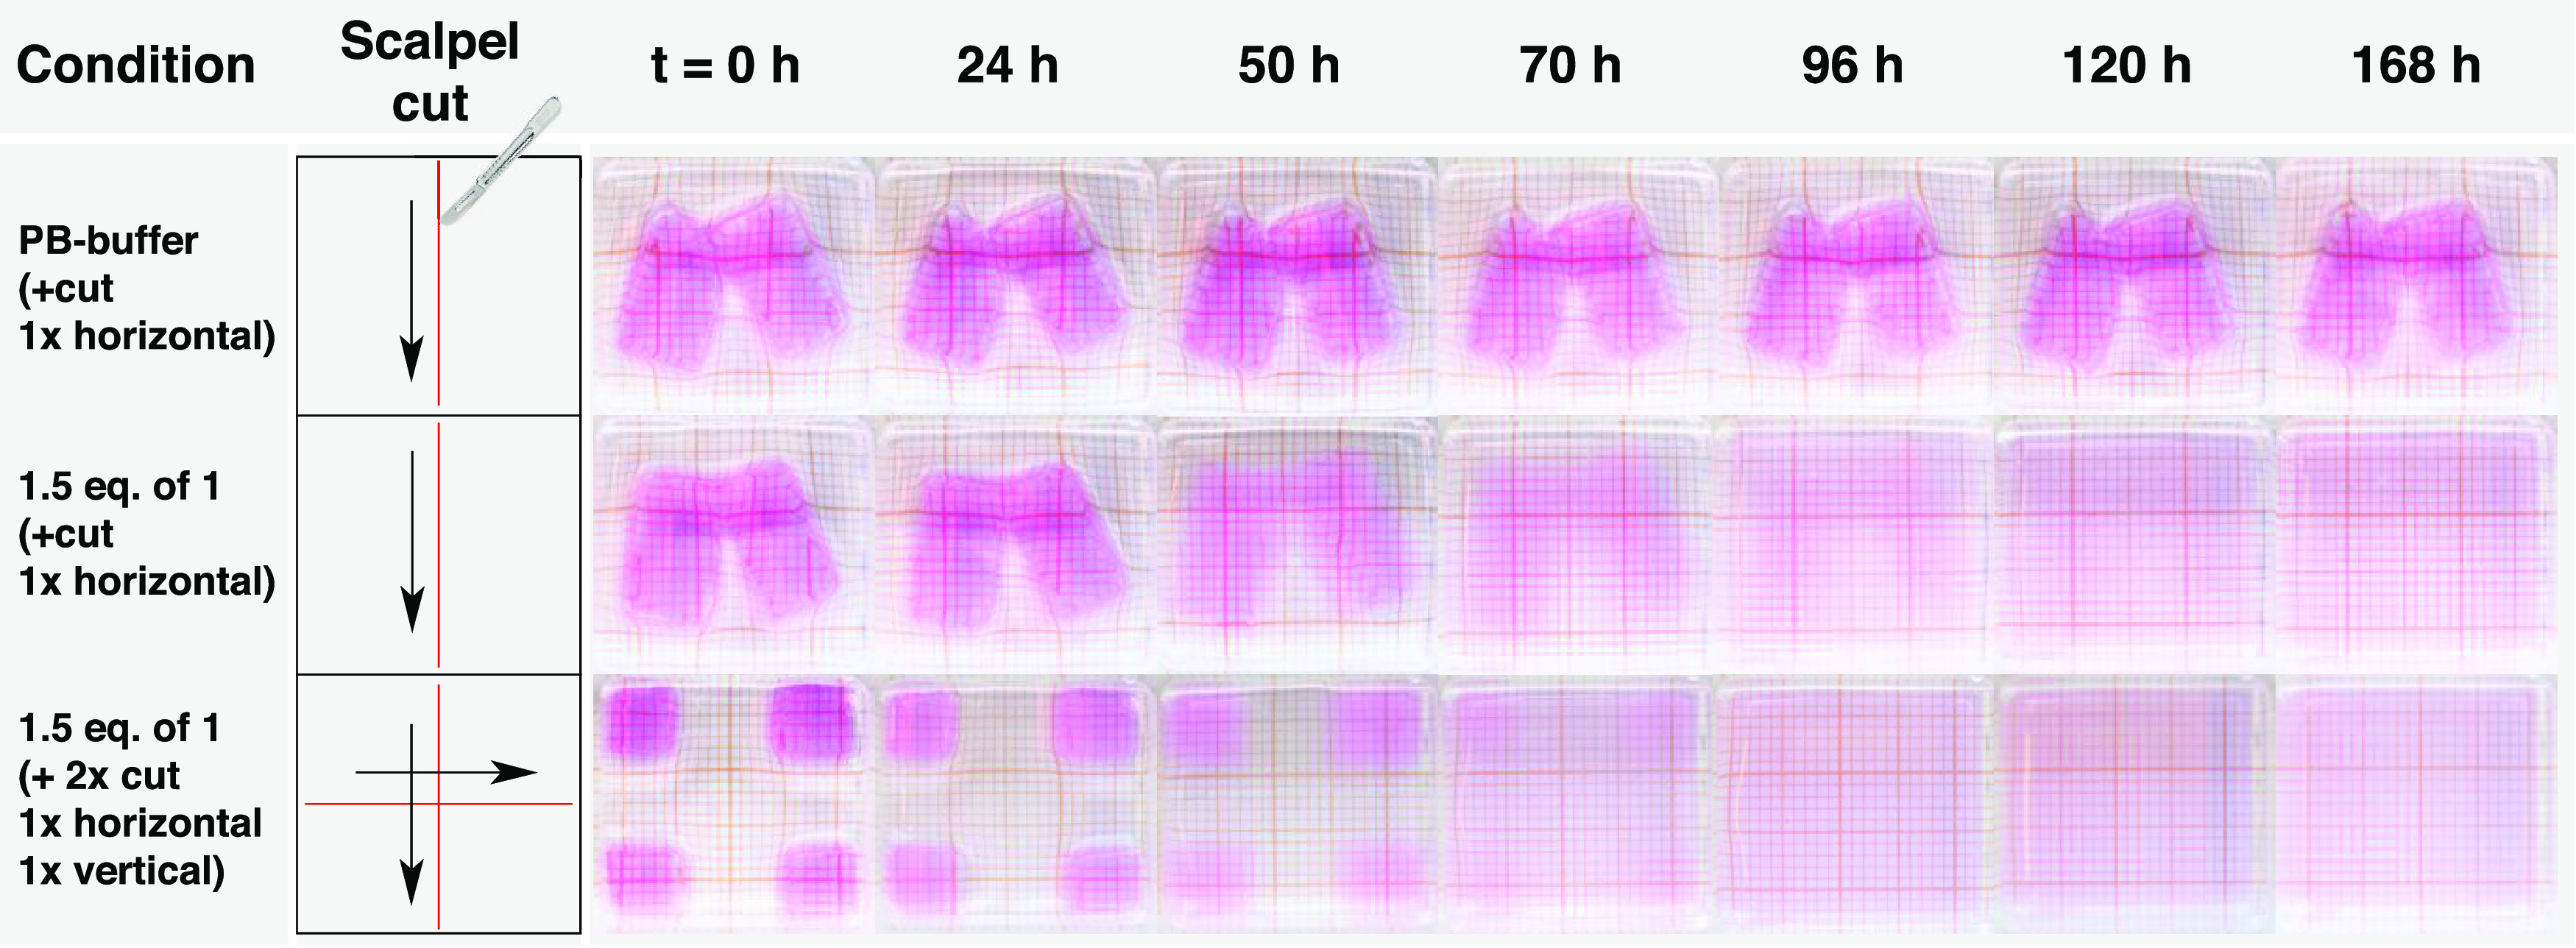
We present an approach for detecting thiol analytes through a self-propagating amplification cycle that triggers the macroscopic degradation of a hydrogel scaffold. The amplification system consists of an allylic phosphonium salt that upon reaction with the thiol analyte releases a phosphine, which reduces a disulfide to form two thiols, closing the cycle and ultimately resulting in exponential amplification of the thiol input. When integrated in a disulfide cross-linked hydrogel, the amplification process leads to physical degradation of the hydrogel in response to thiol analytes. We developed a numerical model to predict the behavior of the amplification cycle in response to varying concentrations of thiol triggers and validated it with experimental data. Using this system, we were able to detect multiple thiol analytes, including a small molecule probe, glutathione, DNA, and a protein, at concentrations ranging from 132 to 0.132 μM. In addition, we discovered that the self-propagating amplification cycle could be initiated by force-generated molecular scission, enabling damage-triggered hydrogel destruction.
Conflict of interest statement
The authors declare no competing financial interest.
Figures


Similar articles
-
An Auto-Inductive Cascade for the Optical Sensing of Thiols in Aqueous Media: Application in the Detection of a VX Nerve Agent Mimic.Angew Chem Int Ed Engl. 2017 Aug 1;56(32):9522-9526. doi: 10.1002/anie.201704472. Epub 2017 Jul 3. Angew Chem Int Ed Engl. 2017. PMID: 28586521
-
Stimuli-Responsive Polymer Film that Autonomously Translates a Molecular Detection Event into a Macroscopic Change in Its Optical Properties via a Continuous, Thiol-Mediated Self-Propagating Reaction.J Am Chem Soc. 2015 Oct 7;137(39):12498-501. doi: 10.1021/jacs.5b08582. Epub 2015 Sep 23. J Am Chem Soc. 2015. PMID: 26388422 Free PMC article.
-
A self-degradable hydrogel sensor for a nerve agent tabun surrogate through a self-propagating cascade.Cell Rep Phys Sci. 2021 Sep 22;2(9):100552. doi: 10.1016/j.xcrp.2021.100552. Epub 2021 Aug 25. Cell Rep Phys Sci. 2021. PMID: 34632430 Free PMC article.
-
Facile Fabrication of a Modular "Catch and Release" Hydrogel Interface: Harnessing Thiol-Disulfide Exchange for Reversible Protein Capture and Cell Attachment.ACS Appl Mater Interfaces. 2018 May 2;10(17):14399-14409. doi: 10.1021/acsami.8b00802. Epub 2018 Apr 23. ACS Appl Mater Interfaces. 2018. PMID: 29637775
-
Molecular Mechanisms of Glutaredoxin Enzymes: Versatile Hubs for Thiol-Disulfide Exchange between Protein Thiols and Glutathione.J Mol Biol. 2019 Jan 18;431(2):158-177. doi: 10.1016/j.jmb.2018.12.006. Epub 2018 Dec 12. J Mol Biol. 2019. PMID: 30552876 Review.
Cited by
-
Trends and Perspectives in Biosensing and Diagnosis.Biosensors (Basel). 2024 Oct 12;14(10):499. doi: 10.3390/bios14100499. Biosensors (Basel). 2024. PMID: 39451711 Free PMC article.
-
Raspberry-shaped ZIF-8/Au nanozymes with excellent peroxidase-like activity for simple and visual detection of glutathione.Anal Bioanal Chem. 2024 Aug;416(19):4417-4426. doi: 10.1007/s00216-024-05378-7. Epub 2024 Jun 12. Anal Bioanal Chem. 2024. PMID: 38864916
-
Selenium catalysis enables negative feedback organic oscillators.Nat Commun. 2024 Apr 17;15(1):3316. doi: 10.1038/s41467-024-47714-6. Nat Commun. 2024. PMID: 38632338 Free PMC article.
-
Chemical reaction networks based on conjugate additions on β'-substituted Michael acceptors.Chem Commun (Camb). 2023 Sep 19;59(75):11174-11187. doi: 10.1039/d3cc02126b. Chem Commun (Camb). 2023. PMID: 37529876 Free PMC article. Review.
References
LinkOut - more resources
Full Text Sources
