. 2023:688:307-348.
doi: 10.1016/bs.mie.2023.07.009. Epub 2023 Aug 16.

Room temperature crystallography and X-ray spectroscopy of metalloenzymes

Affiliations

Room temperature crystallography and X-ray spectroscopy of metalloenzymes

Hiroki Makita et al. Methods Enzymol. 2023.

Abstract

The ultrashort (10s of femtoseconds) X-ray pulses generated by X-ray free electron lasers enable the measurement of X-ray diffraction and spectroscopic data from radiation-sensitive metalloenzymes at room temperature while mostly avoiding the effects of radiation damage usually encountered when performing such experiments at synchrotron sources. Here we discuss an approach to measure both X-ray emission and X-ray crystallographic data at the same time from the same sample volume. The droplet-on-tape setup described allows for efficient sample use and the integration of different reaction triggering options in order to conduct time-resolved studies with limited sample amounts. The approach is illustrated by two examples, photosystem II that catalyzes the light-driven oxidation of water to oxygen, and isopenicillin N synthase, an enzyme that catalyzes the double ring cyclization of a tripeptide precursor into the β-lactam isopenicillin and can be activated by oxygen exposure. We describe the necessary steps to obtain microcrystals of both proteins as well as the operation procedure for the drop-on-tape setup and details of the data acquisition and processing involved in this experiment. At the end, we present how the combination of time-resolved X-ray emission spectra and diffraction data can be used to improve the knowledge about the enzyme reaction mechanism.

Keywords: Isopenicillin N synthase; Metalloenzymes; Photosystem II; Protein crystallography; X-ray emission spectroscopy; X-ray free electron laser.


Figures

Figure 1:
Figure 1:
Overview of the shot-by-shot data collection of X-ray crystallography and X-ray spectroscopy of biological systems at XFELs. Incoming self-amplified spontaneous emission (SASE) pulses at XFELs have a bandwidth of ~0.2% of the central energy.
Fig 2.
Fig 2.
Schematic representation of the activation energy barrier Ea and the driving force for crystallization ΔG during the crystallization process. The peak position represents a kinetic energy barrier that needs to be overcome to form a critical nucleus. Exceeding the critical nucleus size allows formation of a single crystal, inducing the desired phase separation. Small black circles represent protein molecules, and the square indicates a single crystal.
Fig. 3.
Fig. 3.
Crystallization phase diagram, which is divided by a solubility line into two regions: an undersaturated and supersaturated zone. In the soluble state, neither crystal formation nor crystal growth occurs. Protein molecules represented as black circles stay stable. When reaching supersaturation, three events can happen: precipitation, nucleation and crystal growth. Under high supersaturated conditions, only amorphous solids precipitate (precipitation zone). With decreasing saturation, spontaneous crystal formation takes place (nucleation zone). Further moving towards even lower supersaturation conditions, crystal growth or metastable zone is reached. Black circles are demonstrated as protein molecules. Single crystal is represented as a square.
Fig. 4.
Fig. 4.
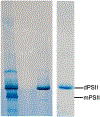
Blue native PAGE analysis of crude PSII particles (lane 1), purified PSII dimers (lane 2) and PSII dimers after recrystallization (lane 3).
Fig 5.
Fig 5.
Microbatch crystals were obtained from the purified PSII dimers. The scale bar represents 100 μm.
Fig 6.
Fig 6.
Microseeding crystals of PSII dimers. The scale bar represents 20 μm.
Fig. 7.
Fig. 7.
Optical microscope image of IPNS • Fe • ACV microcrystals.
Fig. 8:
Fig. 8:
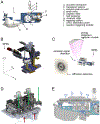
Overview of the DOT sample delivery system and deployment configurations. A. Core components of the DOT system. Different reaction triggering modules are inserted at position j. B. A typical mounting scheme of the DOT system with a directional reference nomenclature used in this chapter. The XFEL beam is parallel to the z-axis. The core components shown in A are mounted onto a translational stage for movement in the x-direction using vertical brackets. The ADE setup is mounted on multi-axis stages to enable positional adjustments in y and z. A beam enclosure to provide a camera view to the interaction point in-line with the XFEL beam is also shown. C. Relative positioning of the DOT setup with respect to the X-ray emission spectrometer and X-ray diffraction detector. Distance between the interaction point on the DOT system and the XRD detector is not drawn to scale. D. Photoactivation reaction module. A droplet travels from right to left in this diagram. A total of three photoactivation is possible using a fiber-guided laser aligned to the 1st, 3rd, and 5th apertures. A droplet position on the reaction module is tracked using a near infrared light probe aligned at the 2nd and 4th apertures. E. A schematic of the O2-activation module. A droplet travels from right to left in this diagram. The central chamber is saturated with O2, while other chambers are used to create a differential pump.
Fig. 9.
Fig. 9.
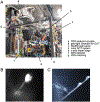
A. The DOT system deployed at the XFEL experimental hutch. In this configuration, the DOT system is enclosed in a gas-tight chamber which has a cutout for the XES spectrometer (a) and XRD detector (not shown). The cutouts are sealed by a thin inflatable plastic sheet for the XES spectrometer side, and by a window fitted by an X-ray transparent material for the XRD detector side. B. A train of droplets ejected at a set frequency on a Kapton conveyor belt. The image is taken by a GigE camera triggered at the same frequency as the droplet ejection and XFEL beam, and shows a view onto the X-ray interaction point on the DOT. In this view, the tape is transporting droplets from top to bottom. C. A droplet shot by a pulse of XFEL. The image is taken by a GigE camera with zoom lens attachment aligned to provide a collinear view as the incoming XFEL beam. In this view, the droplet is delivered from the top right corner of the image to the X-ray interaction point near the center of the image.
Fig 10:
Fig 10:
Alignment of XES spectrometer, reproducibility over shifts. The Mn Kβ1,3 spectra collected from a Mn foil for four consecutive days (1-4) of an experiment are plotted. While small changes in the position of the signal on the detector are visible (left panel, “Spatial direction”) they perfectly align in the energy dispersive direction (middle and right panel). Thereby it was confirmed that the sample spectra from different days of the experiment can be directly compared with each other.
Fig. 11.
Fig. 11.
Outline of the XES data processing, from the signals on the position sensitive detector to quantitative analysis of the spectra. A. Signals collected on the position sensitive detector. The pixels containing the signals are cut out as ROI (defined by two solid lines). To correct for any drift in the background signal, two additional ROIs are defined outside the signal ROI (defined by four dashed lines). The intensities within the two background ROIs are extrapolated across the signal ROI to estimate the drift. B. A raw spectrum calculated from the signal ROI (dotted line), extrapolated background signal (dashed line), and a processed spectrum where the background signal is subtracted from the raw spectrum. C. Mn Kβ1,3 signal of PSII, in the dark state ("0F") and after applying two actinic flashes ("2F"). A scaled DS shows a shift in the spectrum. D. First moment of the Mn Kβ1,3 spectrum calculated for dark and different flash states of PSII. A shift in the first moment as the reaction cycle is advanced indicates a change in the Mn oxidation state through the reaction. E. Fe Kα spectrum of IPNS, in the anaerobic state and after incubation with O2 for 1600 ms. A scaled difference spectrum is also included. F. A closer view of the shift in Fe Kα1 peak. G. Full-width half-maximum of Fe Kα1 peak of IPNS across different O2 incubation time.
Figure 12:
Figure 12:
Examples for direct feedback for diffraction experiments using the cctbx.xfel GUI. (A) Runs of a sample that exhibits several problems in the injection behavior and (B) sample that exhibits stable injection condition. The middle row shows the droplet hit rate (green line) and the indexing rate (blue line) as well as the percentage of double hits (purple). The top row shows the number of diffraction spots identified on each indexed image (blue dots) and on each non-indexed image (gray dots). The bottom row shows the maximum resolution quality detected (yellow dots) and the percentage of diffraction patterns that are better than 2.5 Å (yellow line). Below the graphs details about indexed images and hit rates are given for each experimental run.
Fig. 13:
Fig. 13:
Additional feedback during the XES/SFX experiment. (A) Unit cell distribution plot for two different batches of PSII crystals (orange and blue) generated by the cctbx.xfel GUI. A difference especially for the c axis length is visible between the two batches. (B) Mn Kβ XES signal recorded from PSII single crystals in the dark (0F, blue trace) and doubly illuminated (2F, orange trace) state and (C) difference spectrum between the 0F and 2F XES data both showing the expected difference due to light induced oxidation of the Mn cluster in PSII.
Fig. 14:
Fig. 14:
Data statistics generated by cctbx.xfel. Acceptance statistics per resolution bin for data collected from IPNS (A) and PSII (B,C). Based on a rule of thumb of ~3000 indexed images needed in the highest resolution bin one would estimate a useable resolution of 1.53 Å for the IPNS data set, no useable dataset after 10 minutes of PSII data collection and about 2.1 Å after 75 minutes of data collection for PSII. It can be seen that the acceptance statistics obtained even after a short collection time (10 minutes, B) can be used as a good estimate for the data quality and the time needed to obtain a complete data set to the desired resolution (~2.1 Å, 75 minutes, C).
Fig. 15:
Fig. 15:
Merging statistics for IPNS (A) and PSII data (B), showing the multiplicity (“asu multi”), CC1/2 (“CC int”) and I/σ(I) (“Merged <I/sig((I)>”) values for each resolution bin. Indicators used to estimate the resolution cut-off for each data set are highlighted in green.
Fig. 16:
Fig. 16:
Changes in XES and XRD for different time points along the reaction process in IPNS (A) and PSII (B). (A) The full width half max (FWHM) of the Fe Kα signal from IPNS microcrystals is plotted as a function of O2 incubation time (left) showing a clear change in Fe oxidation state between 800 and 1600 msec (left). Accordingly, a density feature is observed in the 1600 ms O2 incubation XRD data (right), that is modeled as an O2 species bound to the Fe3+ at the active site of IPNS (adapted from (Rabe et al., 2021)). (B) The change in the first moment for the Mn Kβ XES is plotted as a function of time after the 2nd light flash given to PSII microcrystals (left). The change in the first moment is indicative of an oxidation of the Mn cluster from the Mn(III)Mn(IV)3 state to the Mn(IV)4 state. Concomitantly, an additional density is observed in the region of the Mn cluster starting at around 200 μs and the buildup of that density correlates well with the extent of Mn oxidation (right). This density was modeled as an additional bridging oxygen (OX) in the Mn cluster (adapted from (Ibrahim et al., 2020)).

Similar articles

Cited by

  • X-ray Absorption Spectroscopy of Dilute Metalloenzymes at X-ray Free-Electron Lasers in a Shot-by-Shot Mode.
    Bogacz I, Szilagyi E, Makita H, Simon PS, Zhang M, Doyle MD, Chatterjee K, Kretzschmar M, Chernev P, Croy N, Cheah MH, Dasgupta M, Nangca I, Fransson T, Bhowmick A, Brewster AS, Sauter NK, Owada S, Tono K, Zerdane S, Oggenfuss A, Babich D, Sander M, Mankowsky R, Lemke HT, Gee LB, Sato T, Kroll T, Messinger J, Alonso-Mori R, Bergmann U, Sokaras D, Yachandra VK, Kern J, Yano J. Bogacz I, et al. J Phys Chem Lett. 2025 Apr 17;16(15):3778-3787. doi: 10.1021/acs.jpclett.5c00399. Epub 2025 Apr 7. J Phys Chem Lett. 2025. PMID: 40193717 Free PMC article.

References

    1. Agirre J, Atanasova M, Bagdonas H, Ballard CB, Baslé A, Beilsten-Edmands J, Borges RJ, Brown DG, Burgos-Mármol JJ, Berrisford JM, Bond PS, Caballero I, Catapano L, Chojnowski G, Cook AG, Cowtan KD, Croll TI, Debreczeni JÉ, Devenish NE, … Yamashita K (2023). The CCP4 suite: Integrative software for macromolecular crystallography. Acta Crystallographica Section D: Structural Biology, 79(6), Article 6. 10.1107/S2059798323003595 - DOI - PMC - PubMed
    1. Alonso-Mori R, Kern J, Sokaras D, Weng TC, Nordlund D, Tran R, Montanez P, Delor J, Yachandra VK, Yano J, & Bergmann U (2012). A multi-crystal wavelength dispersive x-ray spectrometer. Rev Sci Instrum, 83(7), 073114. 10.1063/1.4737630 - DOI - PMC - PubMed
    1. Barends TRM, Stauch B, Cherezov V, & Schlichting I (2022). Serial femtosecond crystallography. Nature Reviews Methods Primers, 2(1), Article 1. 10.1038/s43586-022-00141-7 - DOI - PMC - PubMed
    1. Beale JH et al. Successful sample preparation for serial crystallography experiments. J Appl Crystallogr 52, 1385–1396 (2019). 10.1107/S1600576719013517 - DOI - PMC - PubMed
    1. Bergmann U, Kern J, Schoenlein RW, Wernet P, Yachandra VK, & Yano J (2021). Using X-ray free-electron lasers for spectroscopy of molecular catalysts and metalloenzymes. Nature Reviews Physics. 10.1038/s42254-021-00289-3 - DOI - PMC - PubMed

Publication types