. 2023 Nov 22;43(47):7929-7945.
doi: 10.1523/JNEUROSCI.0811-22.2023.

Anatomical Diversity of the Adult Corticospinal Tract Revealed by Single-Cell Transcriptional Profiling

Affiliations

Anatomical Diversity of the Adult Corticospinal Tract Revealed by Single-Cell Transcriptional Profiling

Noa Golan et al. J Neurosci. .

Abstract

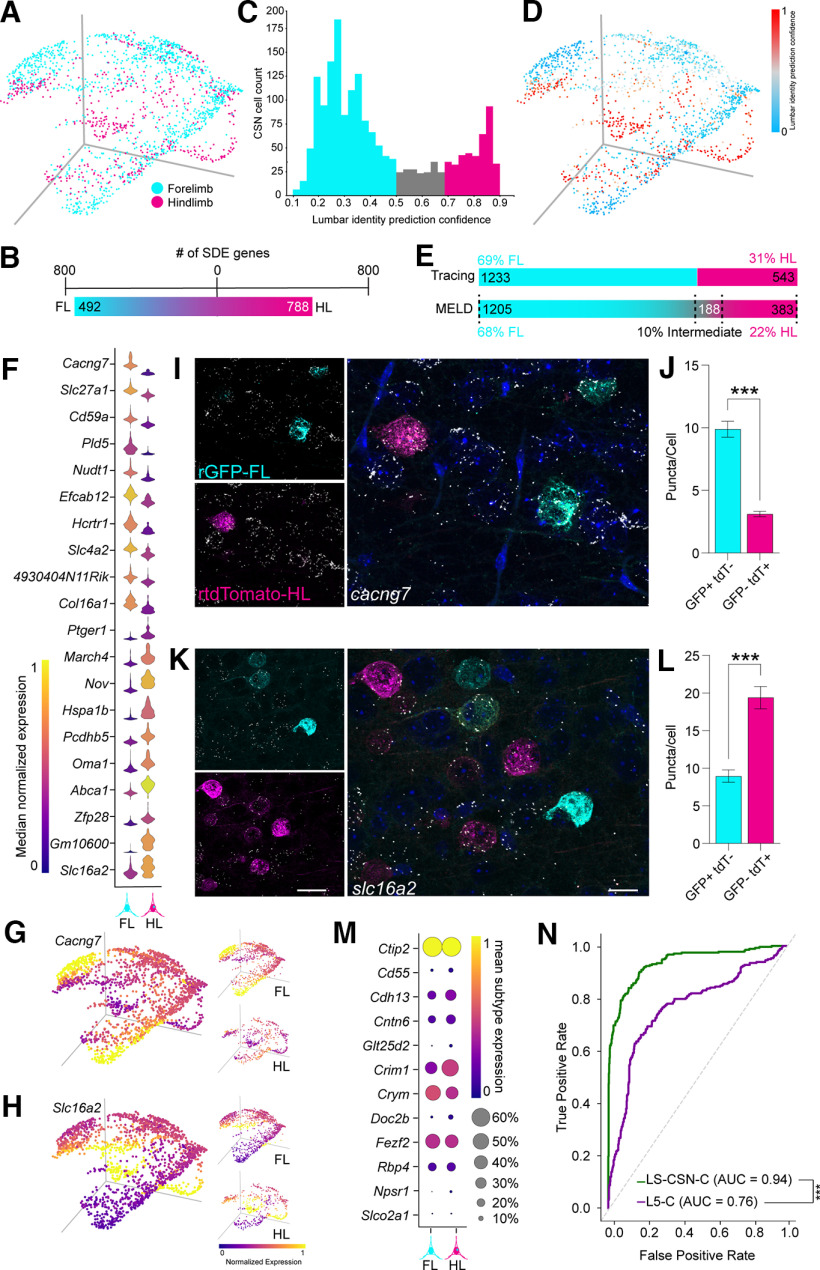
The corticospinal tract (CST) forms a central part of the voluntary motor apparatus in all mammals. Thus, injury, disease, and subsequent degeneration within this pathway result in chronic irreversible functional deficits. Current strategies to repair the damaged CST are suboptimal in part because of underexplored molecular heterogeneity within the adult tract. Here, we combine spinal retrograde CST tracing with single-cell RNA sequencing (scRNAseq) in adult male and female mice to index corticospinal neuron (CSN) subtypes that differentially innervate the forelimb and hindlimb. We exploit publicly available datasets to confer anatomic specialization among CSNs and show that CSNs segregate not only along the forelimb and hindlimb axis but also by supraspinal axon collateralization. These anatomically defined transcriptional data allow us to use machine learning tools to build classifiers that discriminate between CSNs and cortical layer 2/3 and nonspinally terminating layer 5 neurons in M1 and separately identify limb-specific CSNs. Using these tools, CSN subtypes can be differentially identified to study postnatal patterning of the CST in vivo, leveraged to screen for novel limb-specific axon growth survival and growth activators in vitro, and ultimately exploited to repair the damaged CST after injury and disease.SIGNIFICANCE STATEMENT Therapeutic interventions designed to repair the damaged CST after spinal cord injury have remained functionally suboptimal in part because of an incomplete understanding of the molecular heterogeneity among subclasses of CSNs. Here, we combine spinal retrograde labeling with scRNAseq and annotate a CSN index by the termination pattern of their primary axon in the cervical or lumbar spinal cord and supraspinal collateral terminal fields. Using machine learning we have confirmed the veracity of our CSN gene lists to train classifiers to identify CSNs among all classes of neurons in primary motor cortex to study the development, patterning, homeostasis, and response to injury and disease, and ultimately target streamlined repair strategies to this critical motor pathway.

Keywords: Corticospinal tract; plasticity; regeneration; repair; single-cell RNA sequencing; spinal cord injury.


Figures

Figure 1.
Figure 1.
Single-cell RNAseq pipeline for adult CSNs. A, Schematic of spinal tracing via injecting retro-AAV-CAG-GFP at spinal level C6/7 and retro-AAV-CAG-tdTomato at spinal level L4/5. B–D', Photomicrographs from M1 (∼0.0 mm AP bregma, medial cortex) showing FL-CSNs (B), HL-CSNs (C), and an overlay with both single and dual-projecting CSNs (D, D') 14 d after spinal infusion. Schematic overview of the dissection-sequencing procedure. Ei–iv, Mice received injections of retro-AAV-CAG-GFP into either C6/7 or L4/5 (E). After a 2 week incubation, three 500 µm sections through M1 were collected (Ei), layers 2/5 and 5 were macrodissected (Eii) and dissociated, and traced CSNs (green), L2/3 cells (yellow), and L5 nonfluorescent cells (blue) were then sorted using FACS (Eiii) and sequenced using 10x Chromium (Eiv). To exclude putative CSNs from the unlabeled layer 5 population of sequenced neurons, we used KDE analysis to quantify the transcriptional overlap between populations in low-dimensional space. F, Right, untraced layer 5 neurons (blue) with >50% probability (blue, white outline) of originating from the CSN distribution (green) were excluded. To exclude putative layer 5 neurons from the layer 2/3 population of sequenced neurons, we used KDE to quantify the transcriptional overlap between these populations in low-dimensional space. G, Right, Layer 2/3 neurons (orange) with >50% probability (orange, white outline) of originating from the layer 5 distribution (blue) were excluded. Scale bars: B–D, 500 µm; D', 100 µm.
Figure 2.
Figure 2.
Gene expression confirms sequenced cell identity. A, Sequenced CSNs, L2/3 neurons, and nontraced L5 cells have overlapping distributions of library size; mean library size of 19,432 UMIs; median, 18,474 UMIs. B, Differential gene expression analysis revealed 32 genes were enriched in neurons from male mice and 213 genes enriched in neurons from female mice (Wilcoxon rank sum test with a Benjamini–Hochberg correction, p adjusted < 0.05). C, IPA was used to gain biological insight between the sexes; only three pathways were significantly enriched—the synaptogenesis, protein ubiquitination, and eNOS signaling (right-tailed Fisher's exact test with a Benjamini–Hochberg correction, p < 0.05). D–H, Heat maps representing normalized imputed expression of sex-specific genes (D), intact cell (IC) genes (E), cell-type genes (F), neurotransmitter (NT) genes (G), and cortical layer genes (H), confirming that sequenced cells were sex balanced, intact, neurons, glutamatergic, and from expected layers, respectively.
Figure 3.
Figure 3.
CSNs are unique among neurons in M1 and are enriched in Wnt7b expression. A, Differential gene expression analysis between traced CSNs and a combination of layer 2/3 and L5 nonfluorescent cells shows that 197 genes were upregulated and 639 downregulated in CSNs, 217 genes were upregulated and 634 downregulated in CSNs compared with layer 5 nontraced neurons, and 467 genes were upregulated and 1533 downregulated in CSNs compared with layer 2/3 neurons (Wilcoxon rank sum test with a Benjamini–Hochberg correction, p adjusted < 0.05). B, QIAGEN IPA was used to identify enriched pathways in each of these analyses, (right-tailed Fisher's exact test with a Benjamini–Hochberg correction, p adjusted < 0.05). C, D, PHATE projection (C, Movie 1) and kernel density estimate plots with hierarchical clustering and a similarity index (D) colored by cell identity illustrate differences between CSNs, L5 nontraced, and L2/3 neurons. E, Wnt7b is significantly enriched in CSNs compared with layer 5 nontraced and L2/3 neurons (Wilcoxon rank sum test with a Benjamini–Hochberg correction; ****p adjusted < 0.001). F, Schematic showing labeling of cervical CSNs with retro-AAV-CAG-GFP (rAAV-GFP, cyan) and lumbar CSNs with retro-AAV-CAG-tdTomato (rAAV-tdT, magenta). G, H, smFISH of retrogradely labeled CSNs shows an enrichment of Wnt7b in FL-CSNs and HL-CSNs compared with nonfluorescent DAPI+ cells in layer 5b (data shown are average number of puncta per cell ± SEM, one-way ANOVA with a Bonferroni correction, ****p < 0.0001). Scale bars: 10 µm. Data tables from the scRNAseq containing the results of the DE analysis comparing CSNs to nontraced L5 and L2/3 neurons are provided in Extended Data Figure 3-1.
Figure 4.
Figure 4.
Using linear SVM classifiers to identify CSNs among cells in M1. A, Dot plot of previously characterized L5-enriched genes illustrates enrichment and expression of each gene in CSNs, nontraced L5, and L2/3 neurons. The size of the dot denotes the proportion of each population that expresses a given gene, and the color denotes the normalized mean expression within that subtype. B, PHATE projections colored by normalized gene expression of previously characterized L5 genes including Ctip2 and Rbp4, along with newly identified wnt7b, illustrate expression in CSNs, nontraced L5 neurons, and L2/3 neurons. Top right, Boxed PHATE projection illustrates neuronal cell types in their transcriptional space (CSNs, green; nontraced L5 neurons, blue; L2/3 neurons, orange). C, An ROC curve showing the performance of an SVM) trained to classify CSNs based on L5-C genes; the top 100, top 10, or random 10 novel genes enriched in CSN-C, or 10 random genes. AUC is calculated for each classifier, showing that CSN-C outperforms L5-C, and top 10 and random 10 CSN genes outperform the L5-C (randomized permutation test, p < 0.001). D, PHATE projections showing CSN classification performance with either the CSN-C (top left, forest green) or L5-C (bottom left, purple), Top right, CSNs missed by L5-C (black), and a quantification of the proportion of CSNs that were classified correctly. CSN-C correctly classified 92% of CSNs. L5-C correctly classified 76% of CSNs. E, Rbp4 cre:Ai14 mice received infusions of retro-AAV-CAG-GFP into either the cervical, C6/7, or the lumbar, L4/5, spinal cord. F, F', Low-power (F) and high-power (F') photomicrographs show GFP (cyan) expression in a section through M1 from an Rbp4 cre:Ai14 (magenta) mouse. Cyan cells represent traced CSNs. Magenta cells are Rbp4+ neurons that do not project to the spinal cord, white cells are GFP+/Rbp4+ neurons (F'). G, Quantification of the proportion of Rbp4+ neurons that express GFP in coronal sections through M1 (1.7 to −1.2, relative to Bregma; mean, 7.7%). CSN-C prediction of CSN identity of sequenced Rbp4+ neurons. H, CSN-C predicts 7% of Rbp4 neurons are CSNs with a 75% probability cutoff. Scale bars, F, 500 µm; F', 100 µm.
Figure 5.
Figure 5.
A, Forelimb and hindlimb CSN specialization. PHATE projection colored by cell identity of retrogradely labeled GFP+ cervical CSNs (cyan) and tdTomato+ lumbar CSNs (magenta). B, Histogram of MELD prediction confidence of lumbar identity in all CSNs, showing predicted intermediate cells in gray. C, PHATE projection showing MELD prediction confidence of lumbar identity. D, Comparison of counts for tracing-identified lumbar and cervical CSN populations (top) with MELD-predicted counts for lumbar, cervical, and intermediate CSN populations (bottom). E, DE analysis identified 492 upregulated FL genes and 788 upregulated HL genes (Wilcoxon rank sum test, Benjamini–Hochberg correction, p adjusted < 0.05). F, Violin plots of the top 10 most differentially expressed genes in FL CSNs (cyan) and HL CSNs (magenta; Wilcoxon rank sum test, Benjamini–Hochberg correction, p adjusted < 0.05). G, PHATE projection colored by Cacng7 expression illustrates FL enrichment. H, PHATE projection colored by Slc16a2 expression illustrates HL enrichment. I, J, smFISH of retrogradely labeled GFP+ FL-CSNs and tdTomato+ HL-CSNs shows an enrichment of Cacng7 in FL-CSNs (data shown are average number of puncta per traced CSN ± SEM; unpaired t test, ***p < 0.0001). K, L, smFISH of retrogradely labeled GFP+ FL-CSNs and tdTomato+ HL-CSNs shows an enrichment of Slc16a2 in HL-CSNs (data shown are average number of puncta per traced CSN ± SEM; unpaired t test, ***p < 0.001). M, Dot plot of previously characterized L5-enriched genes illustrates enrichment and expression of each gene in FL and HL CSNs. The size of the dot denotes the proportion of each population that expresses a given gene, and the color denotes the normalized mean expression within that subtype. These L5 genes are not uniquely nor differentially enriched in FL or HL CSNs. N, An ROC curve showing the performance of a linear SVM trained to classify limb-specific CSNs based on previously characterized L5 genes (L5-C) or our novel limb-specific gene list (LS-CSN-C). AUC is calculated for each classifier, showing that LS-CSN-C outperforms C-L5. Scale bars; K, bottom left 30 µm; K, bottom right, 15 µm. Data tables from the scRNAseq containing the results of the DE analysis comparing FL versus HL CSNs are provided in Extended Data Figure 5-1.
Figure 6.
Figure 6.
Transcriptionally distinct CSN subtypes can be defined by supraspinal terminal fields. A, Schematic based on the BICCN M1 taxonomy showing that projection neurons can be classified into four categories based on their primary terminal field, including ET (areas shaded in orange in the schematic), IT (areas shaded green), CT (areas shaded purple), and NP (areas shaded red). B, PHATE projection showing 10x V3-sequenced M1 neurons from Yao et al. (2021) colored by ET (orange), IT (green), CT (purple), and NP (red) projection subtype. C, PHATE projection of CSNs collected in this study projected onto the same PHATE space as in B from Yao et al. (2021) colored by projection subtype show that CSNs are represented in all four projection classes. D, PHATE projections of CSNs and M1 projection neurons from Yao et al. (2021; Movie 2). E, Violin plot showing gene expression in each projection subtype. F, PHATE projections showing enrichment of established ET projection gene Fam84b and novel ET enriched gene Gprc5, enrichment of established IT gene Slc30a3 and novel IT enriched gene Frzb, enrichment of established CT gene Foxp2 and novel CT enriched gene Syt6, and enrichment in established NP gene Sla2 and novel NP enriched gene Lypd1. G, DE analysis identified 791 upregulated and 181 downregulated genes in CSN-ET cells versus CSN-IT, CSN-CT, and CSN-NP cells, listed with the top six enriched pathways from QIAGEN IPA (Wilcoxon rank sum test, Benjamini–Hochberg correction, p adjusted < 0.05). H, DE analysis identified 275 upregulated and 263 downregulated genes in CSN-IT cells versus CSN-ET, CSN-CT, and CSN-NP cells, listed with the top six enriched pathways from QIAGEN IPA (Wilcoxon rank sum test, Benjamini–Hochberg correction, p adjusted < 0.05). I, DE analysis identified 215 upregulated and 441 downregulated genes in CSN-CT cells versus CSN-ET, CSN-IT, and CSN-NP cells, listed with the top six enriched pathways from QIAGEN IPA (Wilcoxon rank sum test, Benjamini–Hochberg correction, p adjusted < 0.05). J, DE analysis identified 675 upregulated and 1060 downregulated genes in CSN-NT cells versus CSN-ET, CSN-IT, and CSN-CT cells, listed with the top six enriched pathways from QIAGEN IPA (Wilcoxon rank sum test, Benjamini–Hochberg correction, p adjusted < 0.05). To validate CSN innervation of ET, IT, CT, and NP structures, retro-AAV-CAG-tdTomato was injected in the cervical and lumbar cord. K–N', Terminals in supraspinal brain regions were examined including the brainstem (ET, orange, K), the striatum (IT, green, L), motor thalamus (CT, purple, M), and primary motor cortex (NP, red, N). Photomicrographs of CSN terminals in the brainstem (ET, K'), striatum (IT, L'), motor thalamus (CT, M'), and primary motor cortex (NP, N') stained with antibodies against synaptophysin (green) and NeuN (white) show presumptive synaptic connections within these supraspinal terminal fields. Scale bars; K'-N', 100 µm; insets in each, 30 µm. Data tables from the scRNAseq containing the results of the DE analysis comparing each CSN supraspinal subtype versus all the other subtypes are provided in Extended Data Figure 6-1.
Figure 7.
Figure 7.
Forelimb- and hindlimb-specific supraspinal CSN innervation and specialization. A, B, CSNs in native PHATE space colored by supraspinal categories (A; Movie 3), and FL and HL identity (B). C, D, Divergent numbers of FL and HL CSNs transcriptionally defined by BICCN supraspinal structures. E, Photomicrographs show representative images of FL (top, cyan outline) and HL (bottom, magenta outline) td-tomato+ve CST projections after intersectional tracing in the brainstem (ET population). F, Projection density of FL-CSN-ET was significantly higher than in HL-CSN-ET (n = 4 FL traced mice, n = 3 HL traced mice, mixed-design ANOVA, **p = 0.003). G, Schematic illustrates FL axons (thick cyan lines) more densely innervating ET structures compared with HL axons (thin magenta lines). H, Number of DE genes comparing FL-CSN-ET with FL-CSN-IT, FL-CSN-CT, and NP combined (orange to black), and FL-CSN-ET versus IT (orange, upregulated, to green, downregulated), FL-CSN-ET versus CT (orange to purple) FL-CSN-NP combined (orange to black). H', These comparisons are repeated for the HL-CSN-ET population. I, Photomicrographs show FL and HL td-tomato+ve CST projections after intersectional tracing in the striatum (IT population). J, There was no significant difference in the projection density between ipsilateral and contralateral FL-CSN-IT and HL-CSN-IT projections (mixed-design ANOVA, p = 0.38). K, Schematic illustrates FL axons and HL axons innervating IT structures (green). L, Number of DE genes comparing FL-CSN-IT with FL-CSN-ET, FL-CSN-CT, and FL-CSN-NP combined (green to black), and FL-CSN-IT versus ET (orange to green), FL-CSN-IT versus CT (purple to green), and FL-CSN-IT vs NP (green to red). L', These comparisons are repeated for the HL-CSN-IT population. M, Photomicrographs show images of FL and HL td-tomato+ve CST projections after intersectional tracing in the thalamus (CT population). VPL, Ventral posterolateral nucleus of thalamus. N, There was no significant difference in the projection density between FL-CSN-CT and HL-CSN-CT projections (mixed-design ANOVA, p = 0.085). O, Schematic illustrates FL axons and HL axons innervating the thalamus. P, Number of DE genes comparing FL-CSN-CT to FL-CSN-ET, FL-CSN-IT, and NP combined (purple to black), and FL-CSN-CT versus ET (purple to orange), FL-CSN-CT vs FL-CSN-IT (purple to green), and FL-CSN-CT versus FL-CSN-NP (purple to red). P', These comparisons are repeated for the HL-CSN-ET population. Q, Photomicrographs show images of FL and HL td-tomato+ve CST projections after intersectional tracing in M2 (NP population). R, Projection density of FL-CSN-NP was significantly higher than in HL-CSN-ET (n = 4 FL traced mice, n = 3 HL traced mice, mixed-design ANOVA, ***p < 0.001). S, Schematic illustrates FL axons more densely innervating NP structures compared with HL axons. T, Number of DE genes comparing FL-CSN-NP to FL-CSN-ET, FL-CSN-IT, and FL-CSN-CT combined (red to black), and FL-CSN-NP versus TT (red to orange), FL-CSN-IT versus NP (green to red), and FL-CSN-NP vs CT (purple to red). T', These comparisons are repeated for the HL-CSN-ET population. Scale bars: E, 500 µm; I, M, Q, 100 µm. Data tables from the scRNAseq containing the results of the DE analysis comparing FL CSN supraspinal subtypes and HL within each CSN supraspinal subtypes are provided in Extended Data Figure 7-1.

Similar articles

Cited by

References

    1. Alcamo EA, Chirivella L, Dautzenberg M, Dobreva G, Fariñas I, Grosschedl R, McConnell SK (2008) Satb2 regulates callosal projection neuron identity in the developing cerebral cortex. Neuron 57:364–377. 10.1016/j.neuron.2007.12.012 - DOI - PubMed
    1. Arlotta P, Molyneaux BJ, Chen J, Inoue J, Kominami R, Macklis JD (2005) Neuronal subtype-specific genes that control corticospinal motor neuron development in vivo. Neuron 45:207–221. 10.1016/j.neuron.2004.12.036 - DOI - PubMed
    1. Bakken TE, et al. . (2018) Single-nucleus and single-cell transcriptomes compared in matched cortical cell types. PLoS One 13:e0209648. 10.1371/journal.pone.0209648 - DOI - PMC - PubMed
    1. Blackmore MG, Moore DL, Smith RP, Goldberg JL, Bixby JL, Lemmon VP (2010) High content screening of cortical neurons identifies novel regulators of axon growth. Mol Cell Neurosci 44:43–54. 10.1016/j.mcn.2010.02.002 - DOI - PMC - PubMed
    1. Botta P, Fushiki A, Vicente AM, Hammond LA, Mosberger AC, Gerfen CR, Peterka D, Costa RM (2020) An amygdala circuit mediates experience-dependent momentary arrests during exploration. Cell 183:605–619.e22. 10.1016/j.cell.2020.09.023 - DOI - PMC - PubMed

Publication types

LinkOut - more resources