. 2023 Sep 25;14(1):5466.
doi: 10.1038/s41467-023-40992-6.

SMCHD1 has separable roles in chromatin architecture and gene silencing that could be targeted in disease

Affiliations

SMCHD1 has separable roles in chromatin architecture and gene silencing that could be targeted in disease

Andres Tapia Del Fierro et al. Nat Commun. .

Abstract

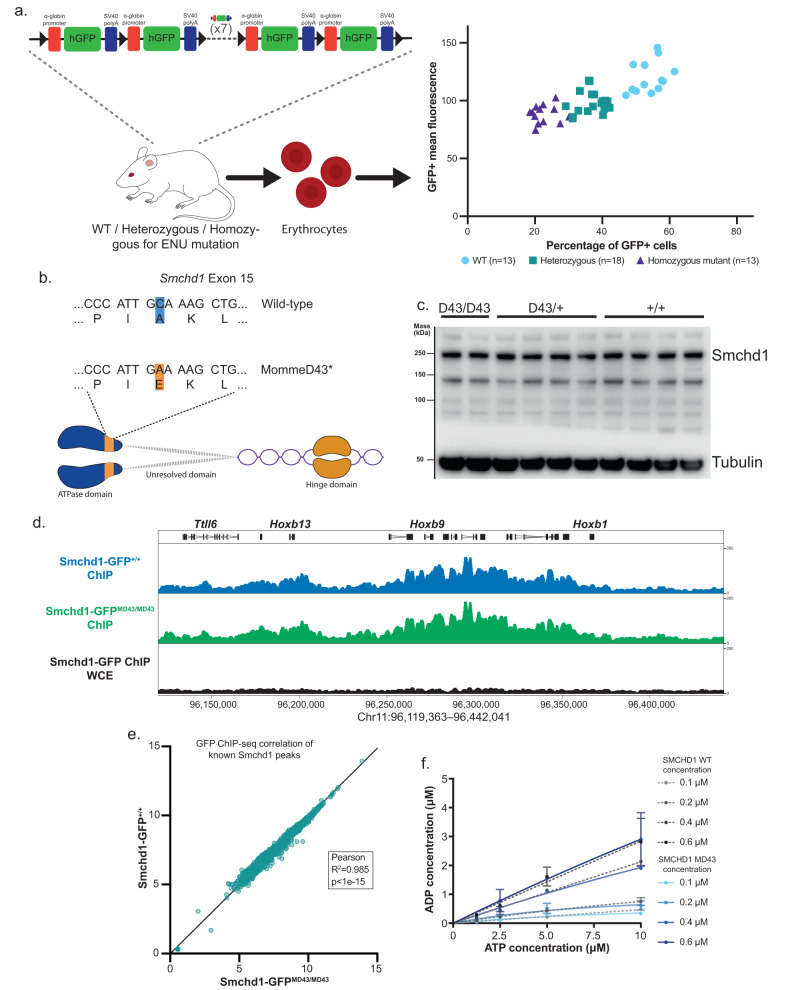
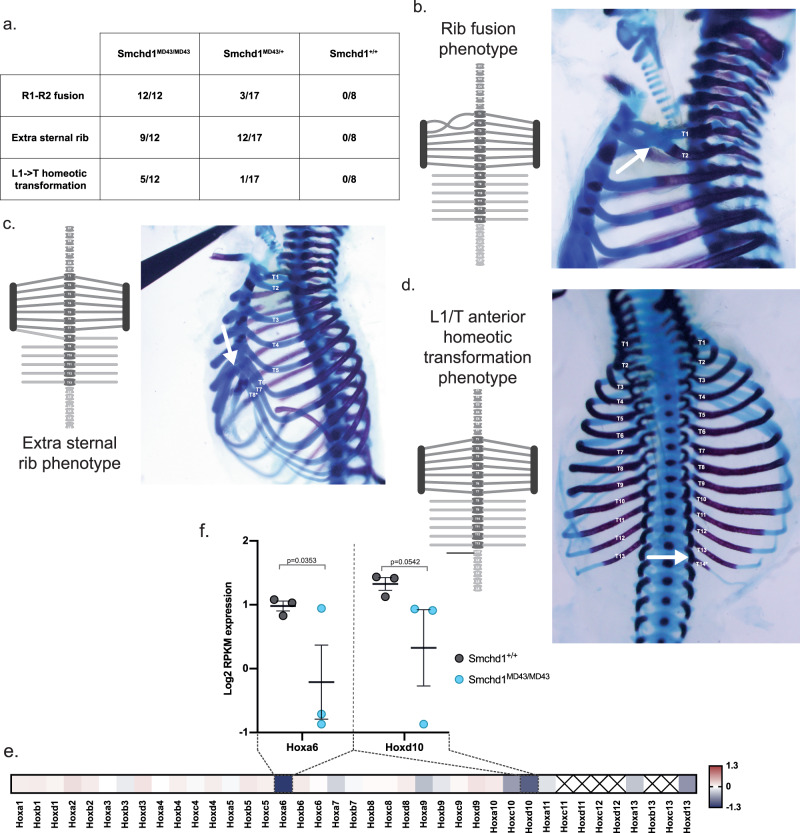
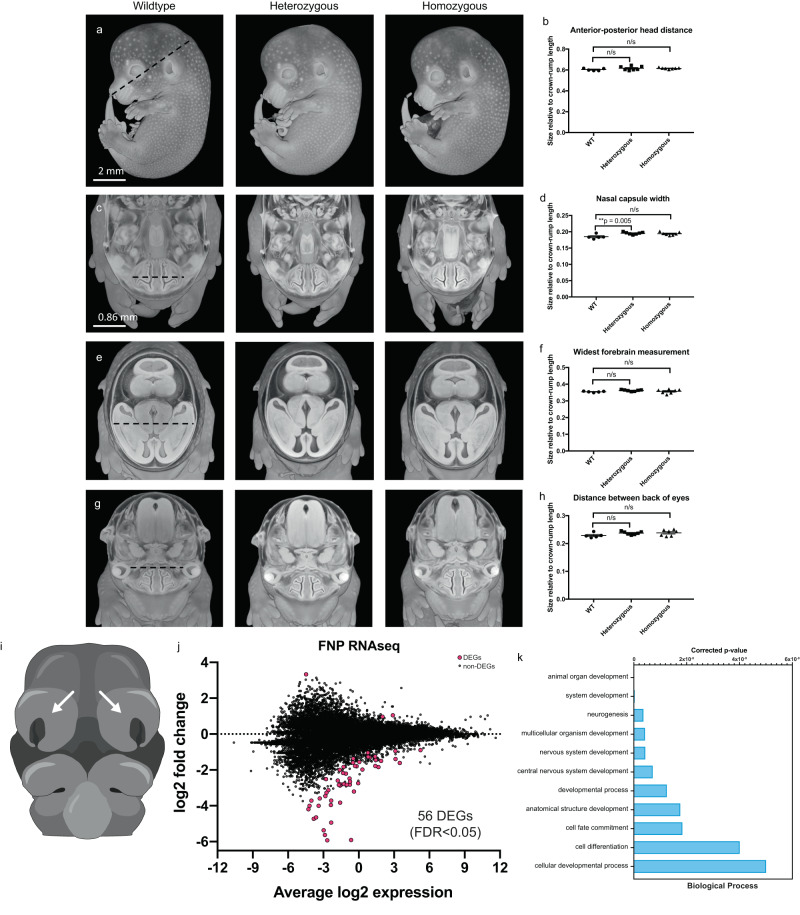
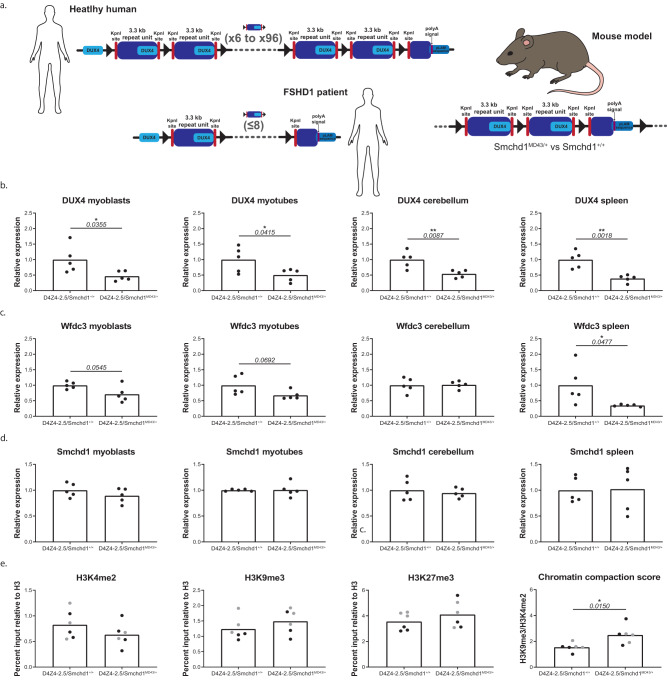
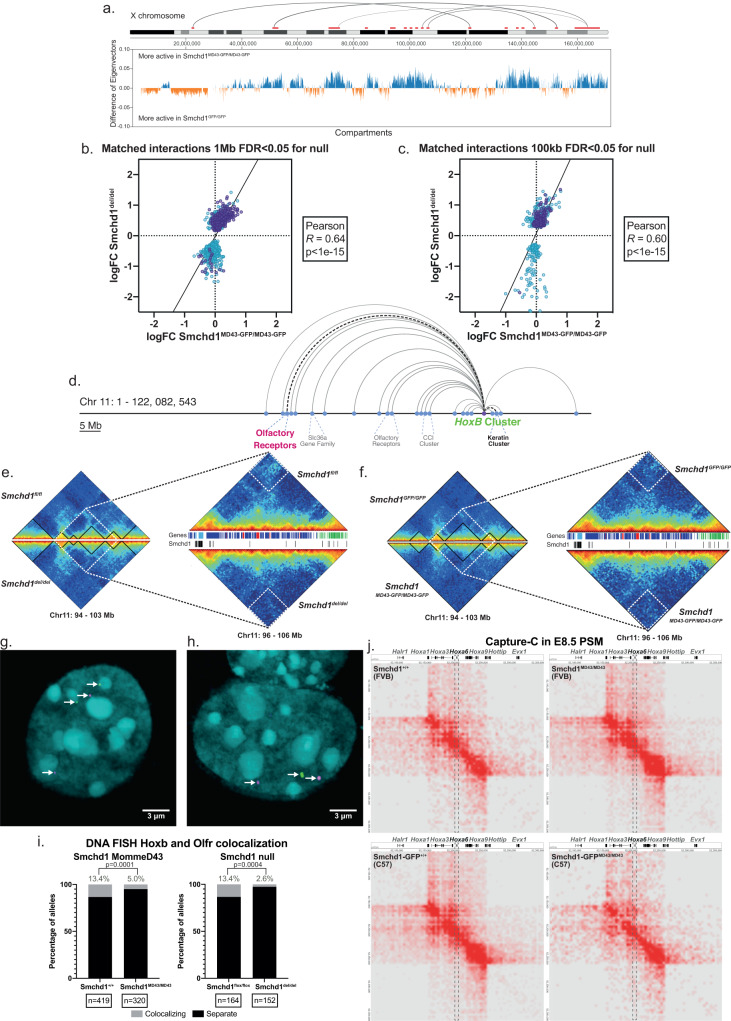
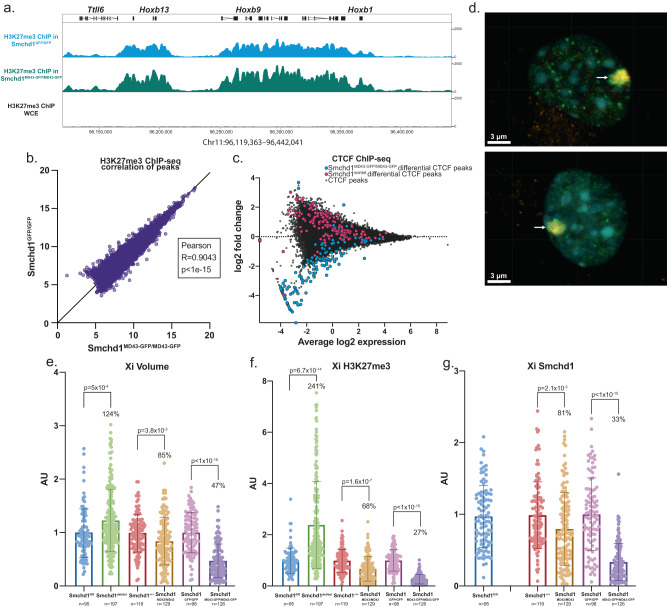
The interplay between 3D chromatin architecture and gene silencing is incompletely understood. Here, we report a novel point mutation in the non-canonical SMC protein SMCHD1 that enhances its silencing capacity at endogenous developmental targets. Moreover, it also results in enhanced silencing at the facioscapulohumeral muscular dystrophy associated macrosatellite-array, D4Z4, resulting in enhanced repression of DUX4 encoded by this repeat. Heightened SMCHD1 silencing perturbs developmental Hox gene activation, causing a homeotic transformation in mice. Paradoxically, the mutant SMCHD1 appears to enhance insulation against other epigenetic regulators, including PRC2 and CTCF, while depleting long range chromatin interactions akin to what is observed in the absence of SMCHD1. These data suggest that SMCHD1's role in long range chromatin interactions is not directly linked to gene silencing or insulating the chromatin, refining the model for how the different levels of SMCHD1-mediated chromatin regulation interact to bring about gene silencing in normal development and disease.


Conflict of interest statement

The authors declare no competing interests.

Figures

Fig. 1
Fig. 1. MommeD43 is a Smchd1 mutant with increased transgene array silencing activity.
a Diagram of ENU screen experiment (left) and results (right). Erythrocytes from mice with an 11-unit GFP transgene repeat array carrying heterozygous or homozygous MommeD43 mutations and wild-type littermate controls were analyzed by FACS to measure GFP transgene expression levels. b Schematic representation of murine SMCHD1 (resolved ATPase and hinge domains linked by flexible still unresolved domain) and the location of the MommeD43 mutation in its structure (orange). c Western blot of SMCHD1 in Smchd1MommeD43/MommeD43, Smchd1MommeD43/+, and Smchd1+/+ cells showing no noticeable change in SMCHD1 levels (representative image of two independent experiments). d ChIP-seq genome browser tracks of the Hoxb cluster locus showing GFP ChIP in primary NSCs with endogenous SMCHD1-GFP fusion protein, compared to the whole cell extract (WCE) input control. This region is heavily marked by SMCHD1 and MommeD43 does not alter localization. On top are indicated a few genes in the locus for reference. e Scatter plot of log2-transformed normalized GFP ChIP-seq counts in Smchd1GFP/GFP and Smchd1MommeD4-GFP3/MommeD43-GFP NSCs around (±5 kb) previously published peaks. The Pearson coefficient indicates very high positive correlation showing no noticeable changes in SMCHD1 DNA binding sites, two-tailed p value. f ATPase assay using recombinant purified wild-type murine SMCHD1 extended ATPase domain (grayscale) compared with the MommeD43 mutant equivalent (blue). Mean ± SD, N = 3 per concentration per protein. MommeD43 abbreviated to MD43.
Fig. 2
Fig. 2. MommeD43 has a gain of function effect on Hox gene silencing and skeletal development.
a Scoring of the three observed skeletal phenotypes in Smchd1MommeD43/MommeD43 and Smchd1MommeD43/+ embryos (ENU mutant allele), n = 12, 17, and 9 for homozygous, heterozygous, and wild-type embryos. bd Diagrams of the skeletal defects (left) of the three distinct phenotypes observed in Smchd1MommeD43/MommeD43 E17.5 embryos with corresponding representative images (right). The white arrows point to the defect. e Heatmap of the log2 fold change between somite-paired Smchd1MommeD43/MommeD43 and Smchd1+/+ (ENU mutant allele) E8.5 embryos to account precisely for developmental stage. The values used are the mean expression of three biological replicates measured by RNA sequencing. f Plot of the normalized log2 expression values for the two Hox genes most affected by MommeD43. Each circle represents an individual biological replicate. Bars are mean ± SEM, n = 3, displayed p value of F test to show significantly increased variance in MD43. MommeD43 abbreviated to MD43.
Fig. 3
Fig. 3. The MommeD43 mutation alters gene expression in the frontonasal prominences but does not recapitulate morphological changes observed in BAMS.
ah Cutaways of three-dimensional renderings of E14.5 embryos imaged by HREM oriented to measure various craniofacial features (a, c, e, g) and graphs detailing the measurements normalized to embryo crown-rump length (b, d, f, h). n/s = not significant, **p = significant adjusted two-tailed p value (unpaired t test, Benjamini–Hochberg correction for multiple testing). N = 5–7 per genotype. Scale bar in a = 2 mm; scale bar in c = 0.86 mm and relates to e, g. i Diagram of E10.5 embryo. Arrow points to the FNP collected for RNA sequencing. j MD plot of log2 fold change of normalized RPKM counts of gene expression in FNP tissue from two somite-matched pairs of Smchd1MommeD43/MommeD43 and Smchd1+/+ (ENU mutant allele) E10.5 embryos showing 53 downregulated and 3 upregulated genes by MommeD43 (56 total DEGs, FDR < 0.05). k Gene Ontology pathway analysis of the 11 main biological processes affected by the 37 uniquely mapped genes recognized by the GO platform out of the 56 DEGs shown in j. Bars show p values corrected for multiple testing (Fisher’s exact t test, Benjamini–Hochberg correction). MommeD43 abbreviated to MD43.
Fig. 4
Fig. 4. MommeD43 results in improved silencing of DUX4 in a mouse model of FSHD.
a Diagram of D4Z4 repeat in healthy humans, FSHD1 patients, and the 2.5-unit transgene repeat used in the murine model (described in ref. ). bd Relative DUX4, Wfdc3, and Smchd1 transcript levels in myoblasts, myotubes, cerebellum, spleen, and fibroblasts. Bars represent the average transcript levels per genotype (average value in D4Z4-2.5 tissue is set as 1); each dot represents a single mouse, n = 5 per genotype. Statistical analysis was performed using a Student’s t test. *P < 0.05; **P < 0.01, two-tailed. e H3K4me2 levels, H3K9me3 levels, H3K27me3 levels, and the chromatin compaction score (H3K9me3 level corrected for H3K4me2 level) in fibroblast cultures (black dots) and spleen (gray dots). Bars represent the average levels per genotype; each dot represents a single mouse, n = 3 per genotype per tissue/cell type. Statistical analysis was performed using a Student’s t test. *P < 0.05, two-tailed. MommeD43 abbreviated to MD43.
Fig. 5
Fig. 5. MommeD43 has a hypomorphic effect on Smchd1-dependent chromatin interactions.
a Upper panel, X chromosome (IGV) with significant (FDR < 0.1) differential interactions in Smchd1MommeD43-GFP/MommeD43-GFP vs Smchd1GFP/GFP at 1 Mb resolution (red, strengthened, n = 3 per genotype). Gray semi-circles represent the top 5 interactions by fold change. Lower panel, difference in Eigenvectors used to determine A/B compartments between Smchd1MommeD43-GFP/MommeD43-GFP and Smchd1GFP/GFP (100 kb resolution). b, c Differential interactions caused by Smchd1 deletion between the Smchd1del/del and Smchd1MommeD43-GFP/MommeD43-GFP at 1 Mb (b) and 100 kb (c) resolution. Each point represents one interaction, X-linked interactions in purple, two-tailed p value. d Main SMCHD1-dependent interactions on chromosome 11. e, f Left panels, heatmaps of normalized Hi-C interactions in each genotype of female NSCs surrounding the Hoxb cluster at 100 kb resolution. Right panels, heatmaps of the region 96–106 Mb region at 50 kb resolution. White dotted squares indicate the most significant interaction lost upon Smchd1 deletion, also reduced in Smchd1MommeD43-GFP/MommeD43-GFP cells. The tracks between the heatmaps show the genes (blue—sense, red—antisense, light blue—Hoxb genes, green – Keratin genes) and previously published Smchd1 ChIP-seq peaks (black). g, h DNA FISH with probes labeling the Hoxb cluster (green) and the olfactory receptor gene cluster (magenta) highlighted in a. in the same colors (DAPI DNA stain, cyan). Left panel, non-interacting loci for both alleles (g). Right panel, one non-interacting, and one interacting allele (h). i Scoring of DNA FISH in g. in male and female NSCs of both the ENU mutant (FVB/NJ) and CRISPR mutant line (C57BL/6 J). Aggregated data from six independent experiments. Two-sided paired t test. MommeD43 abbreviated to MD43. j Heatmaps of Capture-C interactions centered on the Hoxa cluster (mm10 chr6:52055505-52361195) in presomitic mesoderm tissue from somite-matched embryos (E8.5). A genome browser track shows some of the genes in the region. The dotted line encompasses interactions involving the Hoxa6 locus, which showed altered expression in this tissue.
Fig. 6
Fig. 6. MommeD43 results in depleted H3K27me3 on the inactive X chromosome.
a ChIP-seq track of H3K27me3 in Smchd1MommeD43-GFP/MommeD43-GFP vs Smchd1GFP/GFP primary female NSCs at the Hoxb cluster, n = 3 biological replicates per genotype. The track shows no differences in H3K27me3 localization (ChIP-seq is not a directly quantitative technique, and so the difference in peak height between the two tracks might not be of biological significance). b Scatter plot of log-transformed normalized H3K27me3 ChIP-seq counts in Smchd1MommeD43-GFP/MommeD43-GFP vs Smchd1GFP/GFP NSCs around (±2.5 kb, then merged if within 1 kb) peaks determined from both datasets. The Pearson coefficient indicates very high positive correlation. c MA plot showing normalized CTCF ChIP-seq values over peaks. On the x axis, Smchd1MommeD43-GFP/MommeD43-GFP - Smchd1GFP/GFP log2 fold change, and on the y axis the average between them. Highlighted are peaks showing statistically significant differential binding, in cyan for Smchd1MommeD43-GFP/MommeD43-GFP, and in magenta those found in Smchd1del/del, both compared to Smchd1GFP/GFP (FDR 0.1), n = 3 biological replicates per genotype. d Representative images of three independent immunofluorescence staining experiments with anti-H3K27me3 (green), anti-SMCHD1 (orange), and DAPI (DNA stain, cyan) in primary female Smchd1+/+ (top) and Smchd1MommeD43/MommeD43 (bottom) NSCs. The arrow points to the inactive X chromosome which is characterized by very high levels of both H3K27me3 and SMCHD1. eg Scoring (mean ± SD) of the volume and total levels of H3K27me3 and Smchd1 of the inactive X chromosome in female Smchd1fl/fl, Smchd1del/del, Smchd1+/+, and Smchd1MommeD43/MommeD43 (ENU mutant and CRISPR mutant) primary female NSCs. Levels of H3K27me3 and Smchd1 are defined as the total intensity of fluorescence inside the volume of the inactive X, normalized by the total nuclear volume of each scored cell, then by the mean of all datapoints in its respective control. The inactive X chromosome is defined as the high H3K27me3 region in a semi-automated approach using Imaris to define a closed surface of highest green fluorescence in each nucleus. MommeD43 abbreviated to MD43. The percentage displayed is the ratio between each Smchd1 variant and its respective control. N provided for each sample in the figure. Unpaired t tests two-tailed p values displayed for each comparison.

Similar articles

Cited by

References

    1. Bernstein BE, et al. A bivalent chromatin structure marks key developmental genes in embryonic stem cells. Cell. 2006;125:315–326. - PubMed
    1. Kile BT, Hilton DJ. The art and design of genetic screens: mouse. Nat. Rev. Genet. 2005;6:557–567. - PubMed
    1. Allshire RC, Ekwall K. Epigenetic regulation of chromatin states in Schizosaccharomyces pombe. Cold Spring Harb. Perspect. Biol. 2015;7:a018770. - PMC - PubMed
    1. Pikaard CS, Mittelsten Scheid O. Epigenetic regulation in plants. Cold Spring Harb. Perspect. Biol. 2014;6:a019315. - PMC - PubMed
    1. Schotta G, Ebert A, Dorn R, Reuter G. Position-effect variegation and the genetic dissection of chromatin regulation in Drosophila. Semin. Cell Dev. Biol. 2003;14:67–75. - PubMed

Publication types