. 2023 Sep 25;14(9):631.
doi: 10.1038/s41419-023-06160-w.

REPIN1 regulates iron metabolism and osteoblast apoptosis in osteoporosis

Affiliations

REPIN1 regulates iron metabolism and osteoblast apoptosis in osteoporosis

Yu Xia et al. Cell Death Dis. .

Abstract

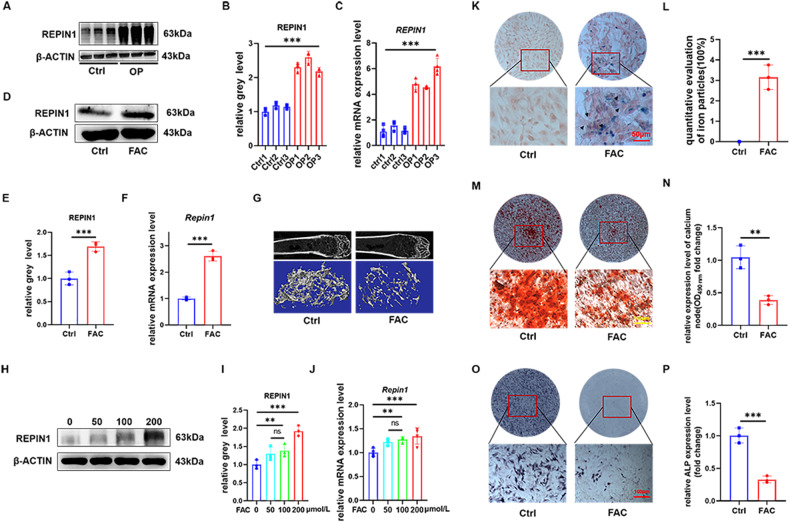
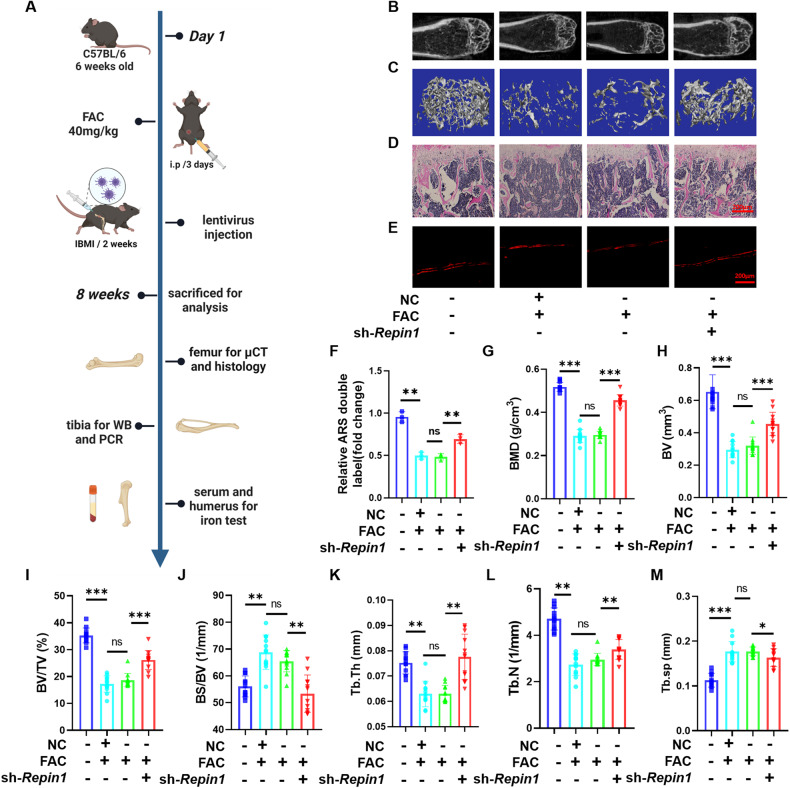
Osteoporosis is not well treated due to the difficulty of finding commonalities between the various types of it. Iron homeostasis is a vital component in supporting biochemical functions, and iron overload is recognized as a common risk factor for osteoporosis. In this research, we found that there is indeed evidence of iron accumulation in the bone tissue of patients with osteoporosis and REPIN1, as an origin specific DNA binding protein, may play a key role in this process. We revealed that sh-Repin1 therapy can rescue bone loss in an iron-overload-induced osteoporosis mouse model. Knockdown of Repin1 can inhibit apoptosis and enhance the resistance of osteoblasts to iron overload toxicity. REPIN1 promoted apoptosis by regulating iron metabolism in osteoblasts. Mechanistically, knockdown of Repin1 decreased the expression of Lcn2, which ameliorated the toxic effects of intracellular iron overload. The anti-iron effect of lentivirus sh-Repin1 was partially reversed or replicated by changing LCN2 expression level via si-RNA or plasmid, which indirectly verified the key regulatory role of LCN2 as a downstream target. Furthermore, the levels of BCL2 and BAX, which play a key role in the mitochondrial apoptosis pathway, were affected. In summary, based on the results of clinical specimens, animal models and in vitro experiments, for the first time, we proved the key role of REPIN1 in iron metabolism-related osteoporosis.


Conflict of interest statement

The authors declare no competing interests.

Figures

Fig. 1
Fig. 1. The expression of REPIN1 increases in osteoporosis patients, and iron overload impairs osteogenic function in vitro.
A, B The expression levels of REPIN1 in bone tissues from osteoporosis patients were analyzed by western blotting. C The mRNA levels of REPIN1 from osteoporosis patients were analyzed. D, E The expression level of REPIN1 in bone tissues of mice was analyzed by western blotting. F The mRNA levels of Repin1 were analyzed by qRT‒PCR. G Representative micro-CT reconstruction images of trabecular bone under the distal femur growth plate in the control and FAC groups. H, I The expression levels of REPIN1 in BMSCs exposed to FAC (0–200 μmol/L) were analyzed by western blotting. J The mRNA levels of Repin1 in BMSCs exposed to FAC (0–200 μmol/L) were analyzed by qRT‒PCR. K Perl’s Prussian blue staining was used to stain the iron particles in cells. The blue-stained iron particles are indicated by arrows. L Semiquantitative evaluation of iron particles after Perl’s Prussian blue staining. M ARS staining at 21 days. N Semiquantitative evaluation of the ARS recovery ratio (fold change). O ALP staining at 7 days. P Relative ALP expression level (fold change). (Cells in GJ were exposed to FAC at concentrations of 200 μmol/L for 48 h before examination. Values are shown as the means ± SDs **p < 0.01 and ***p < 0.005, n = 3 per group all these studies were performed at least three biological replicates).
Fig. 2
Fig. 2. Repin1 knockdown alters iron accumulation and enhances resistance to iron toxicity in MC 3T3 E1 cells.
A Perl’s Prussian blue staining was used to stain the iron particles in cells. The blue-stained iron particles are indicated by arrows. B FerroOrange fluorescent probe was used to measure intracellular iron content. C Cell viability was observed by live/dead staining. Cells in AC were exposed to FAC at concentrations of 200 μmol/L for 48 h before examination. D Semiquantitative evaluation of iron particles after Perl’s Prussian blue staining. E Quantitative evaluation of FerroOrange (Fold change). F Quantitative evaluation of Live/Dead. (Values are shown as the means ± SDs. **p < 0.01, n = 3 per group, all studies were performed with at least three biological replicates).
Fig. 3
Fig. 3. Repin1 knockdown mitigated iron-overload-induced suppression of osteogenesis and mineralization.
A Representative images of ARS staining at 21 days. B Representative images of ALP staining at 7 days. C Relative ALP expression level (fold change). D Semiquantitative evaluation of the ARS recovery ratio (fold change). Cells after lentivirus transfection were exposed to FAC at various concentrations (0–200 μmol/L) during osteogenic induction. E The expression levels of RUNX2, OSX, COL1A1 and ALP in MC 3T3 E1 cells were analyzed by western blotting after 4 d of osteogenic induction in the presence of 200 μmol/L FAC. FI Quantitative analysis of western blotting. JM The mRNA levels of Runx2, Osx, Col1a1 and Alp were analyzed. (Values are shown as the means ± SDs. *p < 0.05, **p < 0.01 and ***p < 0.005, n = 3 per group, all studies were performed with at least three biological replicates).
Fig. 4
Fig. 4. Repin1 regulates iron-overload-induced osteoblast apoptosis.
A TUNEL staining of MC 3T3 E1 cells exposed to 200 μmol/L FAC for 48 h. B Relative TUNEL-positive cells (Fold Change). C The expression levels of Cyt C, BCL2, BAX and CLEAVED CASP3 were analyzed by western blotting. DG Quantitative analysis of western blotting. H, I Mitochondrial membrane potential detection. JL The mRNA levels of Cyt c, Bcl2 and Bax were analyzed by qRT‒PCR. (Values are shown as the means ± SDs **p < 0.01 and ***p < 0.005, n = 3 per group, all studies were performed with at least three biological replicates).
Fig. 5
Fig. 5. Repin1 knockdown alters the gene expression profiles of MC 3T3 E1 cells and resists iron overload via the apoptosis pathway.
A Volcano plots of all differentially expressed genes ( > 2-fold) in NC- and sh-Repin1-transfected MC 3T3 E1 cells after exposure to 200 μmol/L FAC for 48 h. B Heatmaps of all differentially expressed genes ( > 2-fold) in NC- and sh-Repin1-transfected MC 3T3 E1 cells after exposure to 200 μmol/L FAC for 48 h. Red represents higher expression, and blue represents lower expression. C The enriched KEGG pathways. DF The expression of Lcn2, Bcl2 and Bax in sequencing results. G The mRNA levels of Lcn2 were analyzed by qRT‒PCR. H The expression levels of LCN2 were analyzed by western blotting. I Quantitative analysis of western blotting. Cells in H, I were exposed to FAC at various concentrations (0–200 μmol/L) for 48 h before examination (values are shown as the means ± SDs **p < 0.01 and ***p < 0.005, n = 3 per group, all studies were performed with at least three biological replicates).
Fig. 6
Fig. 6. Altering the expression of Lcn2 can reverse or mimic the effect of sh-Repin1 on iron-overload-induced osteoblast apoptosis.
A TUNEL staining of MC 3T3 E1 cells exposed to 200 μmol/L FAC for 48 h. B Relative TUNEL-positive cells (Fold Change). C The expression levels of Cyt C, LCN2, BCL2, BAX and CLEAVED CASP3 were analyzed by western blotting. DH Quantitative analysis of western blotting. I, J Mitochondrial membrane potential detection. KN The mRNA levels of Cyt c, Lcn2, Bcl2 and Bax were analyzed by qRT‒PCR. (Values are shown as the means ± SDs *p < 0.05, **p < 0.01 and ***p < 0.005, n = 3 per group, all studies were performed with at least three biological replicates).
Fig. 7
Fig. 7. Repin1 knockdown prevents iron-overload-induced bone loss in vivo.
A Schematic diagram showing the in vivo experimental design. B, C Representative micro-CT reconstruction images of trabecular bone under the distal femur growth plate in the control group, NC + FAC group, FAC group, and sh-Repin1 + FAC group are shown. D Representative H&E staining images of trabecular bone under the distal femur growth plate from the control group, NC + FAC group, FAC group, and Sh-repin1+FAC group are shown. E Alizarin red double-label experiment. F Quantitative analysis of the width of the alizarin red double label. GM Quantitative analysis of bone parameters. The region of interest selected for trabecular analysis started 100 sections below the proximal end of the distal femur growth plate, and 150 slices (6 µm each) were read per sample. G BMD (g/cm3). H BV (mm3). I BV/TV (%). J BS/BV (1/mm). K Tb. Th (mm). L Tb. N (1/mm). M Tb.sp (mm). (Values are shown as the means ± SDs. *p < 0.05, **p < 0.01 and ***p < 0.005, n = 6 biologically independent mice per group).

Similar articles

Cited by

References

    1. Rachner TD, Khosla S, Hofbauer LC. Osteoporosis: now and the future. Lancet. 2011;377:1276–87. doi: 10.1016/S0140-6736(10)62349-5. - DOI - PMC - PubMed
    1. Schnitzler CM, Macphail AP, Shires R, Schnaid E, Mesquita JM, Robson HJ. Osteoporosis in African hemosiderosis: role of alcohol and iron. J Bone Miner Res. 1994;9:1865–73. doi: 10.1002/jbmr.5650091205. - DOI - PubMed
    1. Liu G, Men P, Kenner GH, Miller SC. Age-associated iron accumulation in bone: implications for postmenopausal osteoporosis and a new target for prevention and treatment by chelation. Biometals. 2006;19:245–51. doi: 10.1007/s10534-005-6666-2. - DOI - PubMed
    1. Miller RG, Segal JB, Ashar BH, Leung S, Ahmed S, Siddique S, et al. High prevalence and correlates of low bone mineral density in young adults with sickle cell disease. Am J Hematol. 2006;81:236–41. doi: 10.1002/ajh.20541. - DOI - PubMed
    1. Sadat-Ali M, Sultan O, Al-Turki H, Alelq A. Does high serum iron level induce low bone mass in sickle cell anemia? Biometals. 2011;24:19–22. doi: 10.1007/s10534-010-9391-4. - DOI - PubMed

Publication types