. 2023 Sep 25;14(1):5973.
doi: 10.1038/s41467-023-41600-3.

Blockade of interferon signaling decreases gut barrier integrity and promotes severe West Nile virus disease

Affiliations

Blockade of interferon signaling decreases gut barrier integrity and promotes severe West Nile virus disease

Shih-Ching Lin et al. Nat Commun. .

Abstract

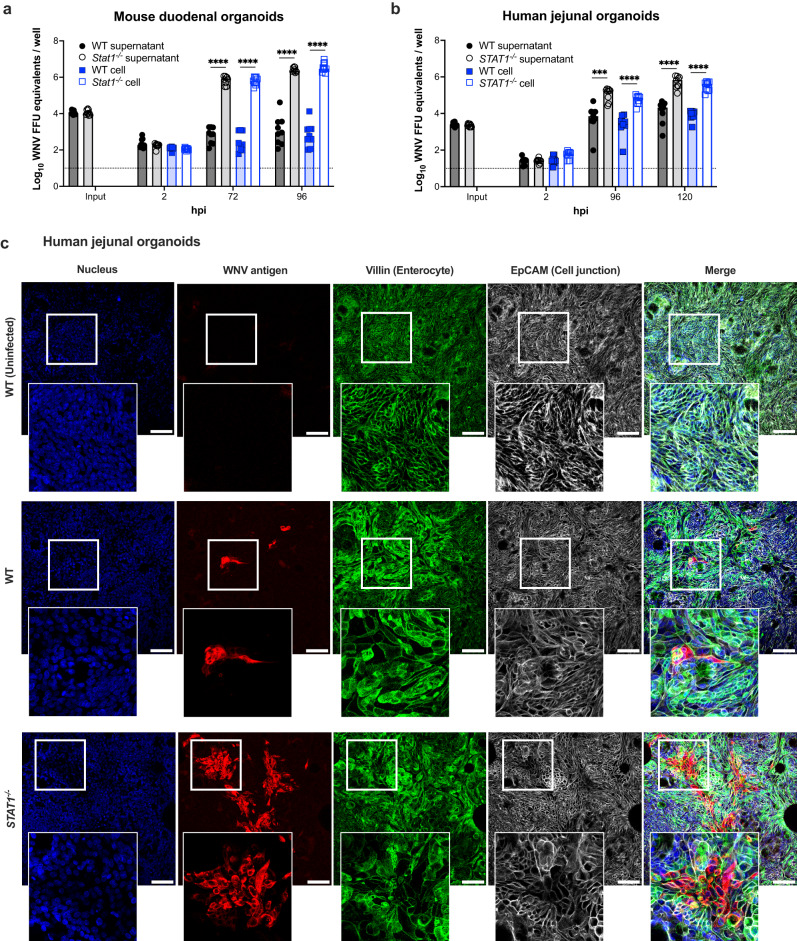
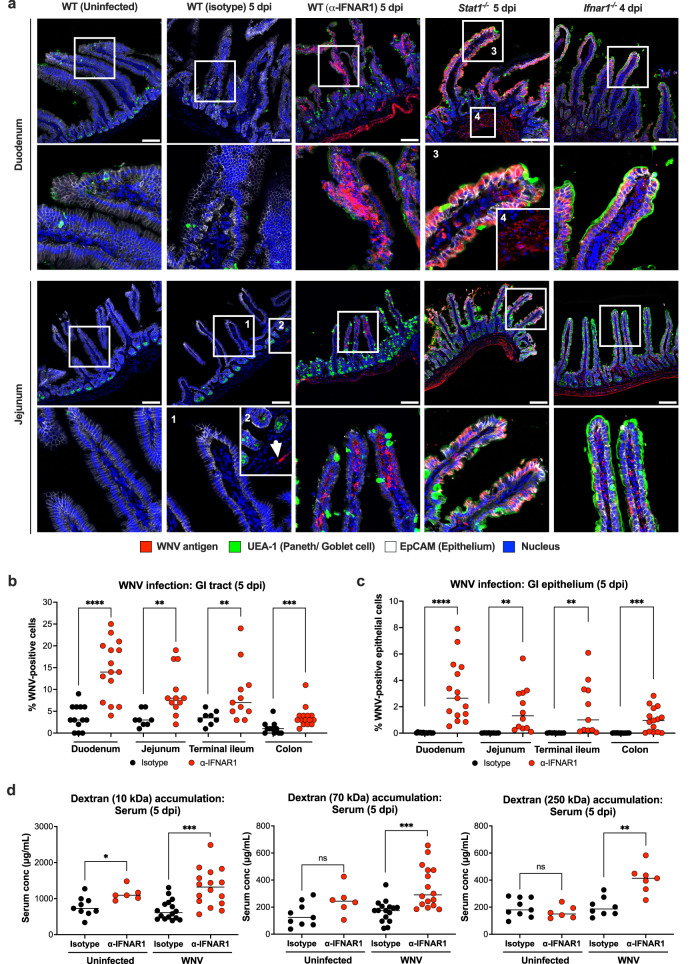
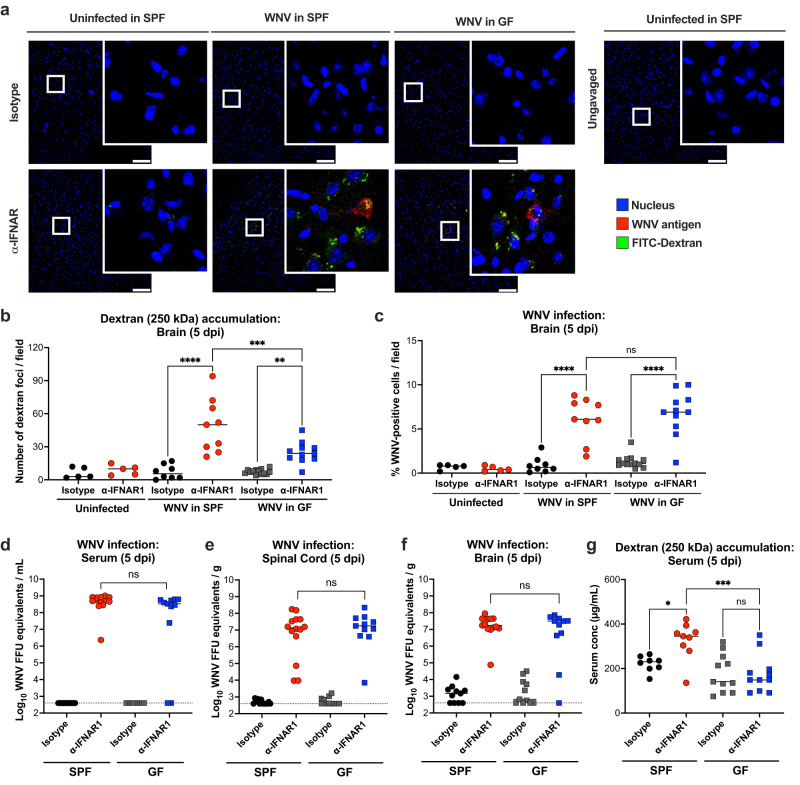
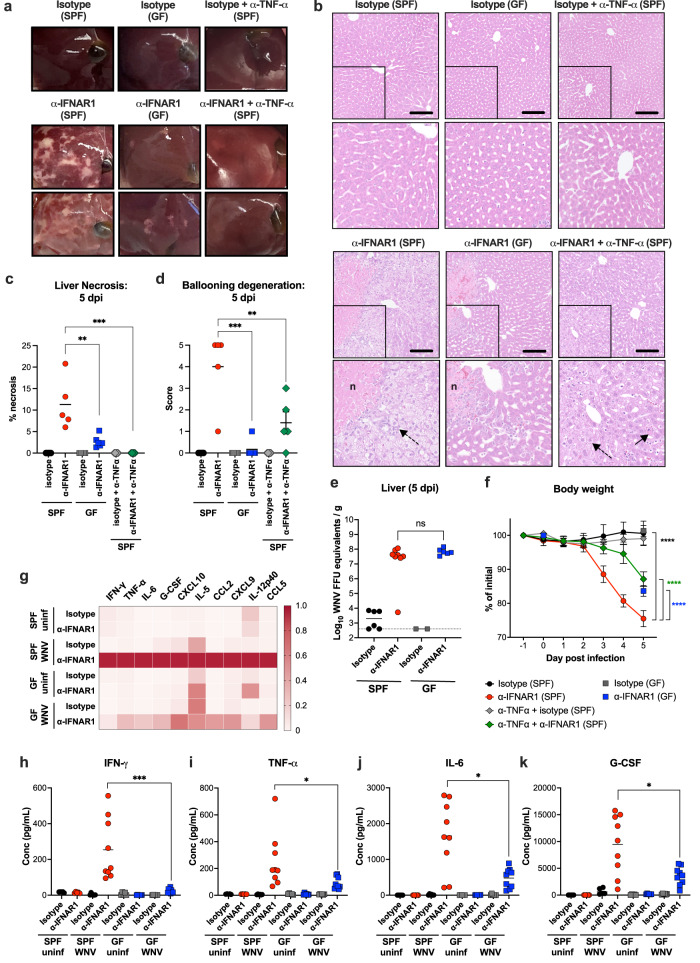
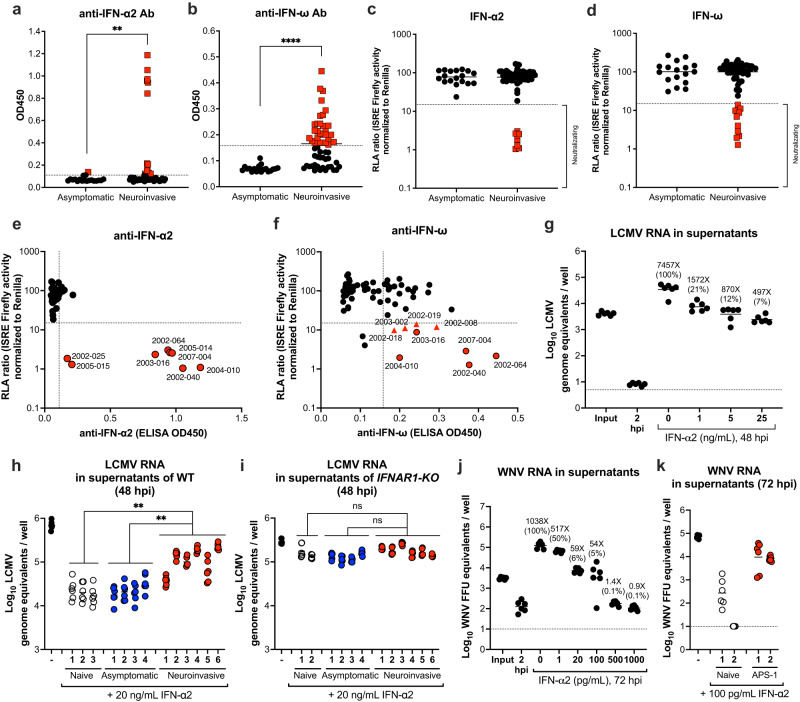
The determinants of severe disease caused by West Nile virus (WNV) and why only ~1% of individuals progress to encephalitis remain poorly understood. Here, we use human and mouse enteroids, and a mouse model of pathogenesis, to explore the capacity of WNV to directly infect gastrointestinal (GI) tract cells and contribute to disease severity. At baseline, WNV poorly infects human and mouse enteroid cultures and enterocytes in mice. However, when STAT1 or type I interferon (IFN) responses are absent, GI tract cells become infected, and this is associated with augmented GI tract and blood-brain barrier (BBB) permeability, accumulation of gut-derived molecules in the brain, and more severe WNV disease. The increased gut permeability requires TNF-α signaling, and is absent in WNV-infected IFN-deficient germ-free mice. To link these findings to human disease, we measured auto-antibodies against type I IFNs in serum from WNV-infected human cohorts. A greater frequency of auto- and neutralizing antibodies against IFN-α2 or IFN-ω is present in patients with severe WNV infection, whereas virtually no asymptomatic WNV-infected subjects have such antibodies (odds ratio 24 [95% confidence interval: 3.0 - 192.5; P = 0.003]). Overall, our experiments establish that blockade of type I IFN signaling extends WNV tropism to enterocytes, which correlates with increased gut and BBB permeability, and more severe disease.


Conflict of interest statement

M.S.D. is a consultant or advisor for Inbios, Vir Biotechnology, Senda Biosciences, Ocugen, Topspin Therapeutics, Moderna, and Immunome. The Diamond laboratory has received unrelated funding support in sponsored research agreements from Vir Biotechnology, Emergent BioSolutions, and Moderna. J.-L.C. is an inventor on patent application PCT/US2021/042741 submitted by Rockefeller University that covers diagnosis of susceptibility to, and treatment of, viral disease and viral vaccines. The remaining authors declare no competing interests.

Figures

Fig. 1
Fig. 1. WNV infection of mouse and human intestinal enteroids is restricted by STAT1-dependent signaling.
WT and STAT1-deficient mouse and human intestinal enteroids were inoculated with WNV (MOI of 0.5 for mouse and 0.1 for human enteroids) and cultured at 37 °C for the indicated time points. ab Viral RNA extracted from supernatants and cell monolayers of mouse (a) or human (b) organoids was quantitated by RT-qPCR. Bars illustrate geometric means, and dotted lines show limits of detection (LOD). Each data point represents an individual well (n = 9 per group from 3 independent experiments). Statistical analysis: two-tailed Mann-Whitney test: ****P < 0.0001 (a); ***P = 0.0002, ****P < 0.0001 (b). c Human organoids cultured under air-liquid interface conditions were inoculated with WNV (MOI of 10) for 72 h, then fixed and stained with antibodies against WNV antigen (red), villin (green), and EpCAM (white), and counterstained for the nuclei (Hoechst 33258, blue). Scale bar, 100 μm. Data are representative of 3 experiments.
Fig. 2
Fig. 2. WNV infection in the GI tract is restricted by type I IFN responses.
Stat1-/- and Ifnar1-/- mice, as well as WT mice treated with either isotype control or blocking IFNAR1 antibodies, were inoculated subcutaneously in the footpad with 102 FFU of WNV. a Immunofluorescent confocal microscopy imaging of duodenal and jejunal cryosections of the GI tract at 4-5 dpi show WNV antigen (red), Paneth and goblet cells (UEA-1, green), EpCAM (white), and nuclei (Hoechst 33258, blue). Scale bar, 100 μm. Data are representative of 4 experiments; from left to right, n = 8, 13, 15, 8, and 8 mice per group. b, c Quantitation of WNV antigen positive cells in different regions along the GI tract was determined as a percentage of total Hoechst 33258-positive cells per field (b) or as a percentage of total EpCAM-positive epithelial cells per field (c). Lines indicate mean values. Data are from 4 experiments; from left to right, n = 13, 15, 8, 12, 8, 11, 11, and 15 per group. d Serum concentrations of 10, 70, and 250 kDa dextrans at 3 h after oral gavage in uninfected or WNV-infected (5 dpi) mice treated with anti-IFNAR1 or isotype control Ab. Data are from 3 experiments with lines indicating mean values; from left to right, n = 9, 6, 16, 16, 9, 6, 16, 16, 9, 6, 8, and 7 mice per group. Statistical analysis, from left to right: (b, c) two-tailed Mann-Whitney test: ****P < 0.0001, **P = 0.0013, **P = 0.0094, ***P = 0.0004 (b); ****P < 0.0001 (c); and (d) two-tailed Mann-Whitney test with Bonferroni correction: ns, not significant, ***P = 0.0006, ***P = 0.0003, **P = 0.0036.
Fig. 3
Fig. 3. Type I IFN signaling-deficiency alters accumulation of GI tract-derived molecules in the brains of WNV infected mice.
ac Uninfected or WNV-infected (5 dpi) specific pathogen free (SPF) or germ-free (GF) mice treated with either isotype control or blocking IFNAR1 antibodies were administered 250 kDa FITC-dextran by oral gavage. Confocal microscopy imaging of brain sections shows WNV-antigen (red), dextran (green), and nuclei (Hoechst 33258, blue). Scale bars, 100 μm, and high-power insets are shown from the boxed regions (a). Accumulation of translocated dextran was quantitated as the number of foci per field (b). WNV antigen staining was quantitated as a percentage of total Hoechst 33258-positive cells per field (c). Data are from 3 experiments with lines indicating mean values; from left to right, n = 5, 5, 8, 9, 13, and 11 (b-c). df WNV RNA levels in serum (d), spinal cord (e), and brain (f) were determined by RT-qPCR. Data are from 3 experiments with solid lines indicating geometric mean values and dotted lines showing limits of detection (LOD); from left to right, n = 11, 13, 11, and 11 mice per group (d and f); n = 12, 14, 11 and 11 mice per group (e). g Accumulation of orally-gavaged 250 kDa FITC-dextran in the serum of WNV-infected SPF and GF mice at 5 dpi that were treated with the indicated antibodies. Lines indicate mean values. Data are from 3 experiments; from left to right, n = 8, 9, 11, and 11 mice per group. Statistical analysis, from left to right: (bc, and g) one-way ANOVA with Šídák’s post-test: ****P < 0.0001, ***P = 0.0005, **P = 0.0059 (b); ****P < 0.0001, ns, not significant, ****P < 0.0001 (c); *P = 0.0249, ***P = 0.0004, ns, not significant (g) and (df) two-tailed Mann-Whitney test: ns, not significant.
Fig. 4
Fig. 4. Differences in inflammation and hepatic injury in WNV-infected anti-IFNAR1-treated SPF and GF mice.
a Representative gross pathology images of the liver of WNV infected (5 dpi) SPF or GF mice treated with the indicated antibodies (3 experiments, n = 6–8 mice per group). Pale white areas in the parenchyma represent regions of necrosis. bd Hepatic injury. Hematoxylin and eosin staining of liver sections from isotype control or anti-IFNAR1 treated SPF or GF mice at 5 dpi. Some of the SPF animals also received anti-TNF-α antibody beginning one day before subcutaneous WNV inoculation. Boxed insets are shown immediately below at higher magnification. The letter n denotes necrosis, dotted arrows show ballooning hepatocytes, and the solid arrow shows an acidophilic body with karyorrhexis (apoptotic body). Scale bars indicate 100 μm (b). Quantitation of liver injury as determined by the extent of necrosis (c) and ballooning degeneration (d). Scoring index is described in the Methods. Lines indicate mean values; from left to right, results are from n = 5, 5, 5, 6, 5, and 5 mice per group. e WNV RNA levels in liver at 5 dpi were determined by RT-qPCR. Results are from 2 experiments with solid lines indicating mean values and dotted line indicating LOD; from left to right, n = 6, 8, 2, and 6 mice per group. f SPF and GF mice receiving different treatments were measured for body weight daily or at 0 and 5 dpi (for GF mice only). Data from 2 experiments and presented as the mean ± SEM; from top to bottom, n = 7, 7, 6, 6, 7, and 9 mice per group. gk Cytokine levels in serum. GF and SPF mice were treated with isotype control or anti-IFNAR1 antibody. Some of the animals were then infected with WNV via subcutaneous inoculation. At 5 dpi, serum was harvested, and cytokines were measured using a multiplexed assay (see Methods). A heat map of cytokine levels, normalized to the highest value for each cytokine, is shown (g). Absolute serum levels of IFN-γ (h), TNF-α (i), IL-6 (j), and G-CSF (k) are shown. Data are from 2 experiments with lines indicating the mean values; from left to right, n = 5, 5, 6, 9, 5, 6, 6, and 9 mice per treatment group. Statistical analysis: (c, d) one-way ANOVA with Dunnett’s post-test: **P = 0.0019, ***P = 0.0003 (c); **P = 0.008, ***P = 0.0003 (d); (e) two-tailed Mann-Whitney test: ns, not significant; (f) two-way ANOVA with Dunnett’s post-test: ****P < 0.0001; (hk) two-tailed Mann-Whitney test with Bonferroni correction: ***P = 0.003 (h); *P = 0.047 (i); *P = 0.019 (j); *P = 0.048 (k).
Fig. 5
Fig. 5. Auto-Abs against type I IFN in human patients with WNV infection.
a, b The optical density (O.D. 450 nm) values of anti-IFN-α2 (a) and anti-IFN-ω (b) auto-Abs in asymptomatic (n = 19) and neuroinvasive (n = 56) WNV cohorts. Samples with positive signals are colored red. cd Luciferase reporter assay measuring serum neutralization of exogenous IFN-α2 (c) and IFN-ω (d) from subjects who experienced asymptomatic (n = 18) or neuroinvasive WNV (n = 56) infection. An RLA ratio lower than 15% was defined as neutralization (red colored samples), as described previously. e, f Correlation of ELISA and Luciferase reporter assay results for detecting auto-Abs against IFN-α2 (e) and IFN-ω (f) with neutralizing activity. In e and f, samples with red circles neutralize IFN-α2. In f, samples with red triangles neutralize IFN-ω only. Data are from 1 experiment performed in duplicate, and the mean values are shown. gi Human intestinal enteroids in wild type (g, h) or IFNAR1 KO backgrounds (i) were pretreated with 0, 1, 5 and 25 ng/mL of IFN-α2 for 8 h (g) or with 20 ng/mL IFN-α2 in the presence of 10% patient serum sample for 8 h (h, i). The treated cultures were inoculated with LCMV (MOI of 0.1) for 2 h. Supernatants were harvested at 2 (input) or 48 hpi and assayed for viral RNA by RT-qPCR. Fold differences were calculated by the increase of LCMV genome equivalents compared to 2 hpi. jk Human enteroids were pretreated with 0, 1, 5 and 25 ng/mL of IFN-α2 for 8 h (j) or with 100 pg/mL of IFN-α2 in the presence of 10% sera (from naive wild-type or APS-1 donors) for 8 h (k). The treated cultures were inoculated with WNV (MOI of 0.1) for 2 h. Supernatants were harvested at 2 (input) or 72 hpi and assayed for viral RNA. Fold values were calculated by the increase of WNV FFU equivalents compared to the 2 hpi collection. Lines indicate geometric means and dotted lines show LOD. Each data point represents an individual well with n = 6 wells per group from 2 experiments. Color definitions: untreated (black), sera from naïve (uninfected) individuals (white), sera from asymptomic infections (blue), sera from neuroivasive infections (red) (hi) or sera from APS-1 patients (red) (k). Statistical analysis: (ab) two-tailed Mann–Whitney test: **P = 0.0047 (a); ****P < 0.0001 (b); (hi) one-way ANOVA with Dunnett’s post-test, from left to right: **P = 0.002, **P = 0.0016 (h); ns, not significant (i).

Similar articles

  • Autoantibodies neutralizing type I IFNs underlie West Nile virus encephalitis in ∼40% of patients.
    Gervais A, Rovida F, Avanzini MA, Croce S, Marchal A, Lin SC, Ferrari A, Thorball CW, Constant O, Le Voyer T, Philippot Q, Rosain J, Angelini M, Pérez Lorenzo M, Bizien L, Achille C, Trespidi F, Burdino E, Cassaniti I, Lilleri D, Fornara C, Sammartino JC, Cereda D, Marrocu C, Piralla A, Valsecchi C, Ricagno S, Cogo P, Neth O, Marín-Cruz I, Pacenti M, Sinigaglia A, Trevisan M, Volpe A, Marzollo A, Conti F, Lazzarotto T, Pession A, Viale P, Fellay J, Ghirardello S, Aubart M, Ghisetti V, Aiuti A, Jouanguy E, Bastard P, Percivalle E, Baldanti F, Puel A, MacDonald MR, Rice CM, Rossini G, Murray KO, Simonin Y, Nagy A, Barzon L, Abel L, Diamond MS, Cobat A, Zhang SY, Casanova JL, Borghesi A. Gervais A, et al. J Exp Med. 2023 Sep 4;220(9):e20230661. doi: 10.1084/jem.20230661. Epub 2023 Jun 22. J Exp Med. 2023. PMID: 37347462 Free PMC article.
  • Human type I interferons protect Vero E6 and ARPE-19 cells against West Nile virus and are neutralized by pathogenic autoantibodies.
    Ferrari A, Cassaniti I, Rovida F, Lilleri D, Croce S, Trespidi F, Ghirardello S, Gervais A, Zhang SY, Casanova JL, Borghesi A, Baldanti F. Ferrari A, et al. Sci Rep. 2025 Apr 2;15(1):11271. doi: 10.1038/s41598-025-89312-6. Sci Rep. 2025. PMID: 40175402 Free PMC article.
  • Viral pathogen-associated molecular patterns regulate blood-brain barrier integrity via competing innate cytokine signals.
    Daniels BP, Holman DW, Cruz-Orengo L, Jujjavarapu H, Durrant DM, Klein RS. Daniels BP, et al. mBio. 2014 Aug 26;5(5):e01476-14. doi: 10.1128/mBio.01476-14. mBio. 2014. PMID: 25161189 Free PMC article.
  • West Nile virus infection in children.
    Barzon L, Pacenti M, Sinigaglia A, Berto A, Trevisan M, Palù G. Barzon L, et al. Expert Rev Anti Infect Ther. 2015;13(11):1373-86. doi: 10.1586/14787210.2015.1083859. Epub 2015 Aug 31. Expert Rev Anti Infect Ther. 2015. PMID: 26325613 Review.
  • West Nile virus neuroinvasive disease.
    Davis LE, DeBiasi R, Goade DE, Haaland KY, Harrington JA, Harnar JB, Pergam SA, King MK, DeMasters BK, Tyler KL. Davis LE, et al. Ann Neurol. 2006 Sep;60(3):286-300. doi: 10.1002/ana.20959. Ann Neurol. 2006. PMID: 16983682 Review.

Cited by

References

    1. Shrestha B, Gottlieb D, Diamond MS. Infection and injury of neurons by West Nile encephalitis virus. J. Virol. 2003;77:13203–13213. doi: 10.1128/JVI.77.24.13203-13213.2003. - DOI - PMC - PubMed
    1. Samuel MA, Morrey JD, Diamond MS. Caspase 3-dependent cell death of neurons contributes to the pathogenesis of West Nile virus encephalitis. J. Virol. 2007;81:2614–2623. doi: 10.1128/JVI.02311-06. - DOI - PMC - PubMed
    1. Suthar MS, Diamond MS, Gale M., Jr West Nile virus infection and immunity. Nat. Rev. Microbiol. 2013;11:115–128. doi: 10.1038/nrmicro2950. - DOI - PubMed
    1. Mostashari F, et al. Epidemic West Nile encephalitis, New York, 1999: results of a household-based seroepidemiological survey. Lancet. 2001;358:261–264. doi: 10.1016/S0140-6736(01)05480-0. - DOI - PubMed
    1. Campbell GL, Marfin AA, Lanciotti RS, Gubler DJ. West Nile virus. Lancet. Infect. Dis. 2002;2:519–529. doi: 10.1016/S1473-3099(02)00368-7. - DOI - PubMed

Publication types