. 2023 Sep 25;14(1):5534.
doi: 10.1038/s41467-023-41095-y.

THBS1-producing tumor-infiltrating monocyte-like cells contribute to immunosuppression and metastasis in colorectal cancer

Affiliations

THBS1-producing tumor-infiltrating monocyte-like cells contribute to immunosuppression and metastasis in colorectal cancer

Mayuki Omatsu et al. Nat Commun. .

Abstract

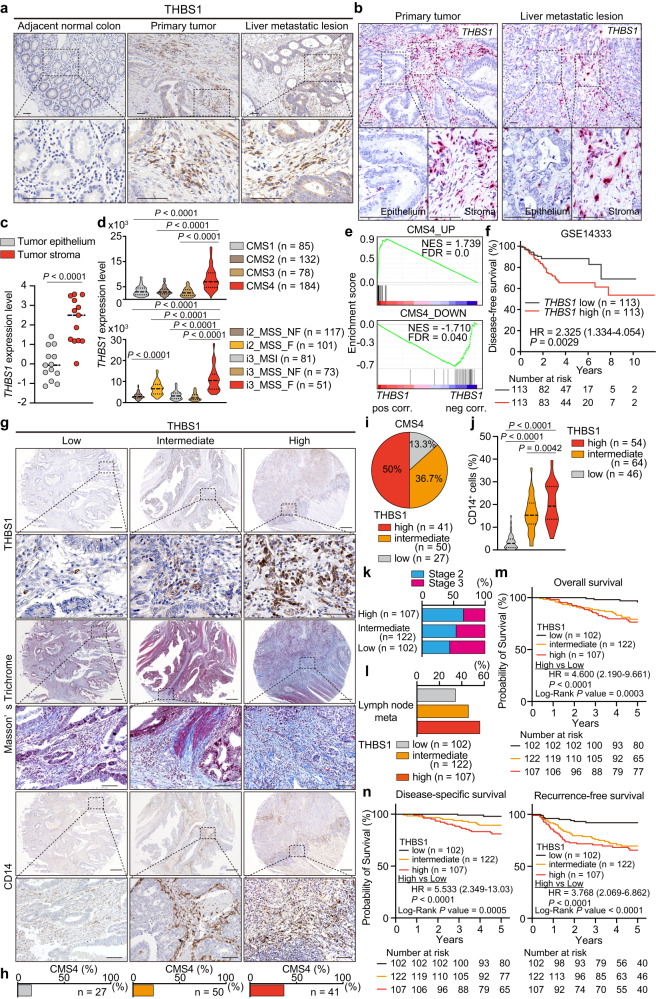
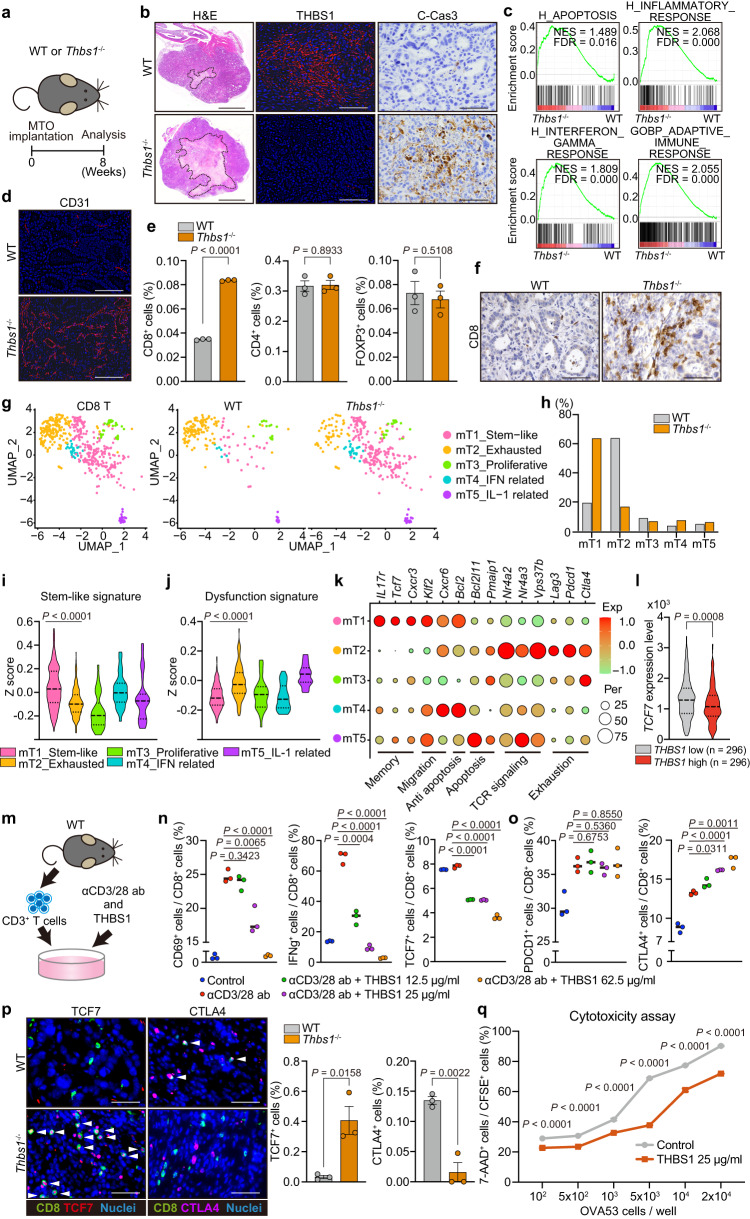
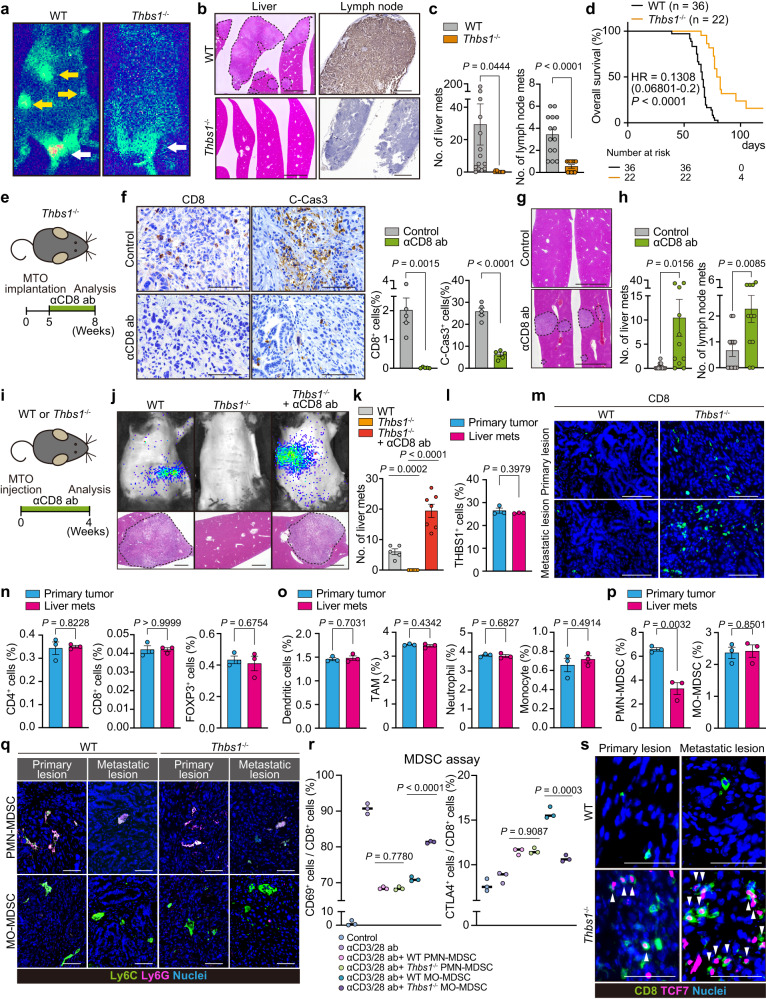
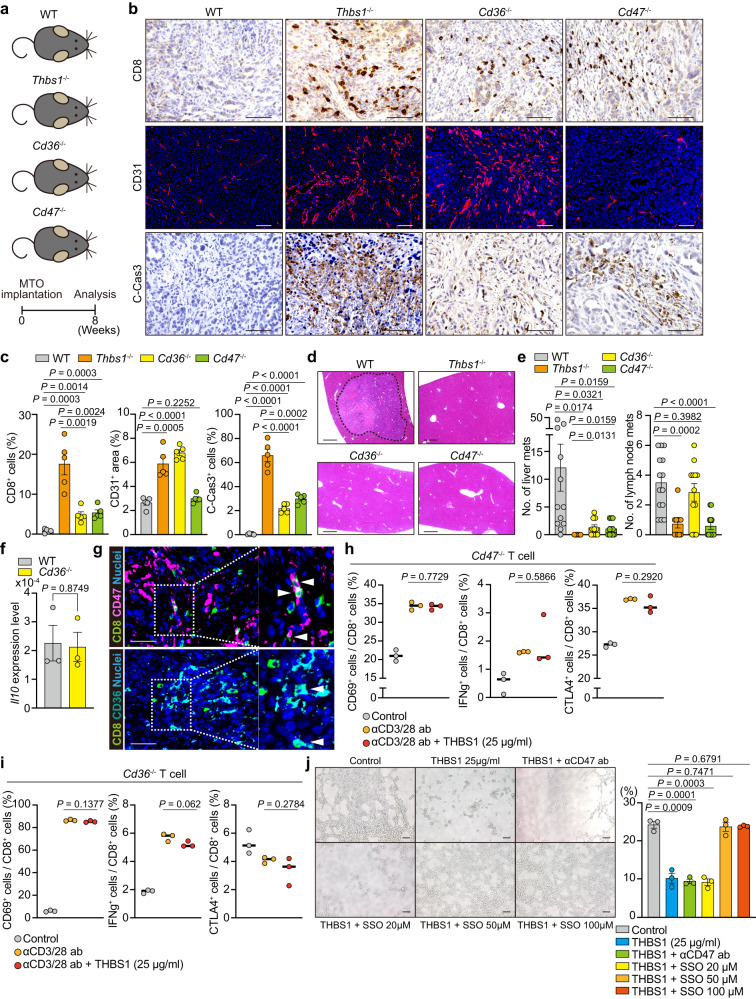
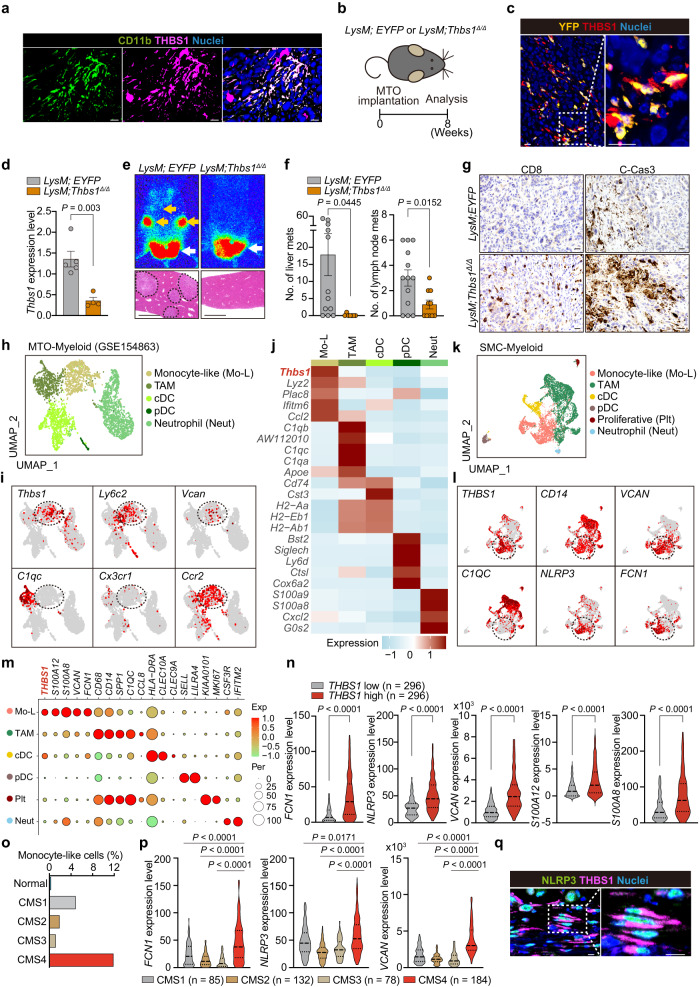
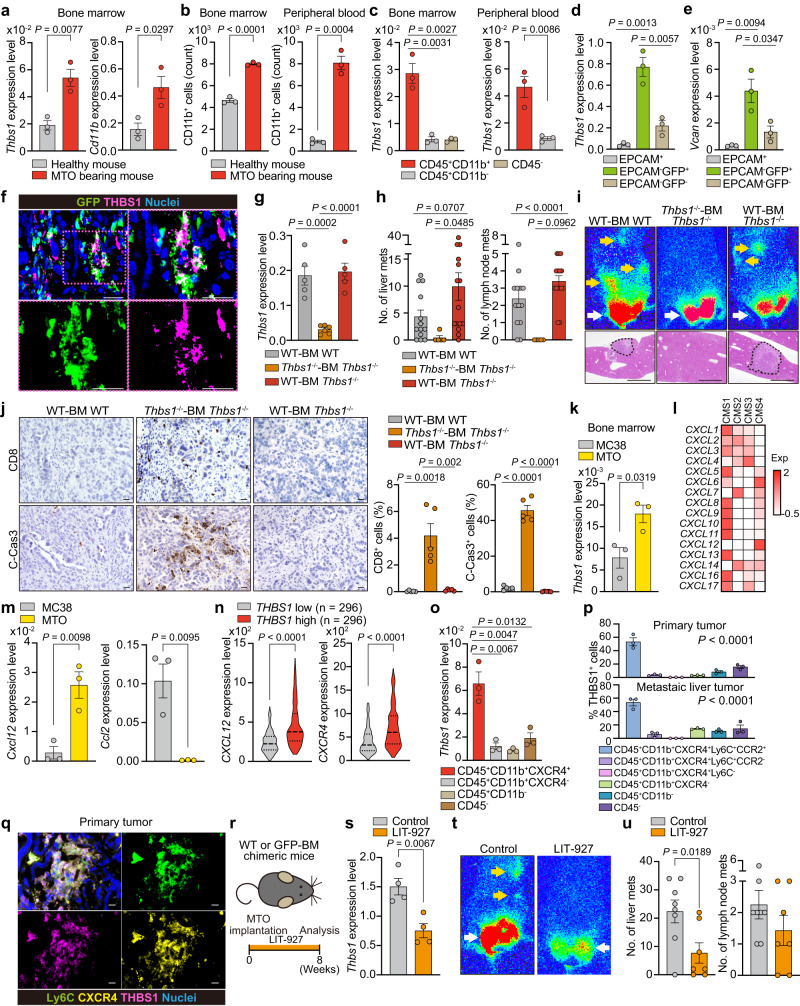
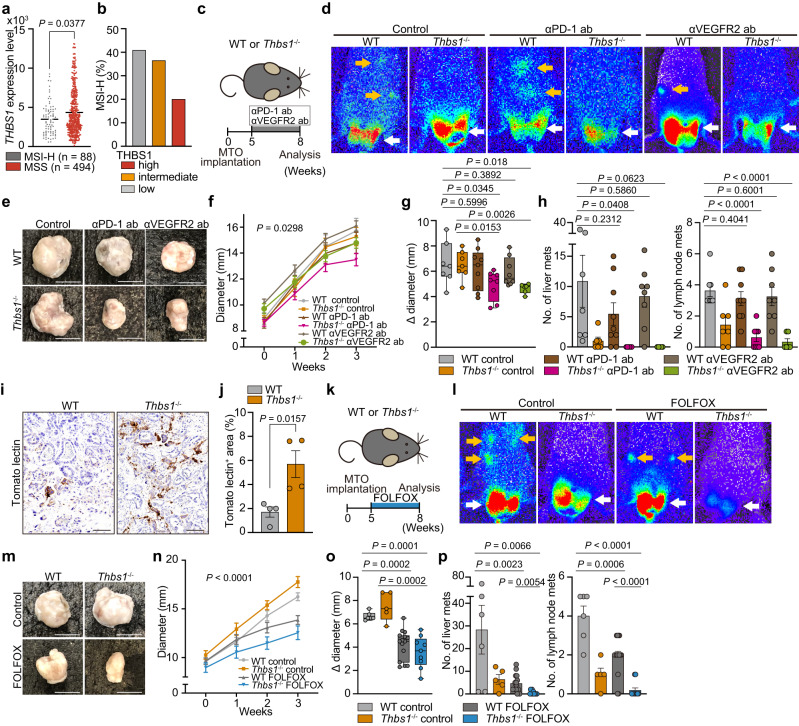
Mesenchymal activation, characterized by dense stromal infiltration of immune and mesenchymal cells, fuels the aggressiveness of colorectal cancers (CRC), driving progression and metastasis. Targetable molecules in the tumor microenvironment (TME) need to be identified to improve the outcome in CRC patients with this aggressive phenotype. This study reports a positive link between high thrombospondin-1 (THBS1) expression and mesenchymal characteristics, immunosuppression, and unfavorable CRC prognosis. Bone marrow-derived monocyte-like cells recruited by CXCL12 are the primary source of THBS1, which contributes to the development of metastasis by inducing cytotoxic T-cell exhaustion and impairing vascularization. Furthermore, in orthotopically generated CRC models in male mice, THBS1 loss in the TME renders tumors partially sensitive to immune checkpoint inhibitors and anti-cancer drugs. Our study establishes THBS1 as a potential biomarker for identifying mesenchymal CRC and as a critical suppressor of antitumor immunity that contributes to the progression of this malignancy with a poor prognosis.


Conflict of interest statement

Yuichi Fukunaga is employed by Sumitomo Pharma Co., Ltd. The remaining authors disclose no conflicts.

Figures

Fig. 1
Fig. 1. THBS1 expression is primarily localized in the non-epithelial stroma areas of human CRCs and associated with the aggressiveness.
a, b Representative images of immunostaining (a, n = 3 samples per indicated lesion) and RNAscope (b, n = 3 samples per indicated lesion) of THBS1 in human CRCs and liver metastasis. The experiments were independently repeated three times, yielding similar results. c, THBS1 expression in tumor epithelium (n = 13), and tumor stroma (n = 13) of CRC dataset (GSE35602). d THBS1 expression in each subtype of CMS (top) and IMF (bottom) in TCGA. e Gene set enrichment analysis (GSEA) of the indicated gene sets. f Kaplan-Meier curve in CRC dataset (GSE14333). gj Staining g in TMAs of human CRCs (THBS1: low n = 102, intermediate n = 122, high n = 107; the rest: low n = 46, intermediate n = 64, high n = 54). Proportion h of CMS4 subtype in indicated groups. Proportion i of CRCs with low-, intermediate- or high-intensity of THBS1 in CMS4-annotated CRCs. Quantification j of CD14 staining in g. k, l Proportion of stage 2 or 3 k and lymph node metastasis l in CRCs with low-, intermediate-, or high-intensity of THBS1 in TMAs. m, n Kaplan-Meier curves of patients corresponding to TMAs. Hazard ratio with 95% confidence interval and P values, analyzed by Log-rank test, are shown in f, m, n. Mean ± SEM. Scale bars, 50 μm a, b, top panels 200 μm and bottom panels 50 μm in each indicated protein g. P values were calculated by two tailed Mann-Whitney test in c, d or two-tailed, unpaired Student’s t test in j. Source data are provided as a Source Data file.
Fig. 2
Fig. 2. TME-derived THBS1 suppresses inflammation and immunosurveillance in aggressive murine CRC.
a Schematic representation of orthotopic MTO implantation. b Staining in orthotopic MTO tumors (n = 5 mice). Bars, 500 μm (H&E), 50 μm (the rest). Dash lines denote necrotic areas. c GSEA of transcriptomics of orthotopic MTO tumors in WT or Thbs1-/- mice (n = 3). d Immunostaining in orthotopic MTO tumors (n = 5 mice per group). Bars, 50 μm. e, Proportion of indicated cells in total cells of orthotopic MTO tumors, analyzed by FACS (n = 3 tumors from three distinct mice per group). f Immunostaining in orthotopic MTO tumors (n = 5 mice per group). Bars, 50 μm. gk scRNA-seq of orthotopic MTO tumors (n = 2 tumors from two distinct mice per group; analyzed cell numbers are indicated in Methods “Single-cell RNA sequencing”). UMAP plot g and proportion of each compartment h in re-clustered CD8+ T subset. Violin plots (i, j) and dot plots of representative genes k for the indicated gene signatures in each CD8 subset. l Expression levels of TCF7 in TCGA (n = 296 samples per group). m Schematic representation of stimulation experiment of isolated CD3+ T cells. n, o FACS analyses of proportion of indicated marker-expressing cells in CD8+ T cells in m (n = 3 biologically independent samples). p Co-immunostaining for CD8 and TCF7 (left) or CTLA4 (right) in primary tumors of MTO-inoculated mouse and proportion of double positively stained cells per field (n = 3 mice per group). White arrowheads denote double positive cells. Scale bars, 50 μm. q Cytotoxicity assay by co-culture of OVA-expressing MTO and OVA53 cells in the presence or absence of THBS1 (n = 3 biologically independent samples per group). Vertical axis indicates the proportion of dead cells (7-AAD+) in CFSE labeled OVA-expressing MTO. Staining experiments b, d, f were independently repeated three times. Mean ± SEM. Two-tailed, unpaired Student’s t test in e, n, oq, two-tailed Mann–Whitney test in i, j, l. Source data are provided as a Source Data file.
Fig. 3
Fig. 3. Loss of TME-derived THBS1 suppresses metastases and improves prognosis.
ad Orthotopic implantation of MTO. Bioluminescence imaging (a; white arrows: primary lesions, yellow arrows: distant metastases), H&E of liver (b left), CK19 staining of lymph node (b, right), macroscopic numbers of liver or lymph node metastasis (c; n: WT = 14, Thbs1-/- = 12), and Kaplan-Meier curve d. Hazard ratio with 95% confidence interval and P values, by Log-rank test. eh Anti-CD8 antibody (αCD8 ab) treatment on MTO-inoculated Thbs1-/- mice (n: control = 12, αCD8 ab = 11). Schematic representation e, immunostaining and quantification in primary tumors in e (f, n = 5 mice per group), H&E of liver g, and macroscopic numbers of metastasis h. i–k αCD8 ab treatment on MTO splenic injection model (n: control = 5, Thbs1-/- = 7, Thbs1-/- + αCD8 ab = 7). Schematic representation i, bioluminescence imaging (j, top), H&E of liver (j, bottom), and macroscopic numbers of metastasis k. l FACS analyses of THBS1+ cell proportion per total cells in indicated lesions in MTO-bearing WT mice (n = 3 mice per group). m Immunostaining in indicated lesions. np FACS analyses on proportion of indicated cells among total cells in primary tumors or liver metastasis (n = 3 mice per group) in MTO-bearing WT mice. Dendritic cells, CD45+CD11c+; TAM, CD11b+F4/80+; neutrophils, CD45+CD11c-CD11b+Ly6C+Ly6G+F4/80-; monocytes, CD45+CD11c-CD11b+Ly6C+Ly6G-F4/80-; PMN-MDSC, CD45+CD11c-CD11b+Ly6C+Ly6G+; MO-MDSC, CD45+CD11c-CD11b+Ly6C+Ly6G- cells. q Co-immunostaining in indicated lesions. PMN-MDSC, Ly6C+Ly6G+; MO-MDSC, Ly6C+Ly6G- cells (n = 3 mice). r MDSC assay by co-culturing T cells isolated from WT mice and MO-MDSCs or PMN-MDSCs from primary tumors in MTO-bearing WT or Thbs1-/- mice, measured by FACS are shown (n = 3 biologically independent samples). s Co-immunostaining in indicated lesions (n = 3 mice). White arrowheads denote co-stained cells. Mean ± SEM. P values were calculated by two-tailed, unpaired Student’s t test (except d). Scale bars, 500 μm (b, left; g), 200 μm (b,right; j). 50 μm f, m, q, 25 μm s. Dash lines denote liver metastases b, g, j. Source data are provided as a Source Data file.
Fig. 4
Fig. 4. THBS1 enhances metastases through the interaction with both CD47 and CD36.
a Schematic representation of orthotopic implantation of MTO in the mice with indicated genotypes (n: WT = 14, Thbs1-/- = 11, CD36-/- = 12, CD47-/- = 12). bd Immunostaining b and quantification of b (c; n = 5 mice per group) of the primary tumors and H&E staining d of liver of a. Dash lines denote liver metastases. e Macroscopic quantification of the numbers of liver and lymph node metastases in a (n = mice, per genotype: WT = 14, Thbs1-/- = 11, CD36-/- = 12, CD47-/- = 12). f qRT-PCR analysis in the orthotopic MTO tumors in WT and Cd36-/- mice (n = 3 mice per group). g Co-immunostaining for CD8 and CD47 (top) or CD36 (bottom) in primary lesions of MTO-bearing WT mice (n = 3 mice). White arrowheads denote co-stained cells. h, i FACS analyses of indicated cell proportions in CD8+ (CD3+CD8+) T cells sorted from CD47-/- h or CD36-/- i mice. Individual plots indicate the biological replicates of isolated CD8+ (CD3+CD8+) CD47-/- T cells or CD36-/- T cells (n = 3 per group) treated with or without anti-CD3/CD28 antibodies. j Representative images of tube formation assay of C166 cells in the presence or absence of recombinant THBS1 (25 μg/ml) or presence of THBS1 combined with anti-CD47 antibody (αCD47ab) or sulfosuccinimidyl oleate (SSO) at indicated concentration, and quantification of tube area (n = 3 biologically independent samples). Scale bars, 50 μm b, g, 100 μm j, 200 μm d. Mean ± SEM. P values were calculated by two-tailed, unpaired Student’s t test. Source data are provided as a Source Data file.
Fig. 5
Fig. 5. Monocyte-like cells are the primary source of THBS1.
a Co-immunostaining of the orthotopic MTO tumors in WT mice (n = 3 mice). b Schematic representation of orthotopic implantation of MTO to the mice with indicated genotypes. c Co-immunostaining in the MTO tumors in LysM;EYFP mice (n = 3 mice). d qRT-PCR analysis in the orthotopic MTO tumors in LysM;EYFP (n = 5 mice) and LysM;Thbs1Δ/Δ mice (n = 4 mice). e Bioluminescence imaging (top) and H&E of liver (bottom) of b. f Macroscopic numbers of metastases in liver (n = mice per group: LysM;EYFP = 12, LysM;Thbs1Δ/Δ = 7) and lymph node (n = mice per group: LysM;EYFP = 13, LysM;Thbs1Δ/Δ = 10) of b. g Immunostaining in the orthotopic MTO tumors of b (n = 5 mice). hj UMAP plot h of murine myeloid clusters, and UMAP plots i and heatmap j of representative genes for each cluster of (h) in scRNAseq data of orthotopic MTO tumors (GSE154863). Dash lines denote monocyte-like cluster. km UMAP plot k of human myeloid clusters and UMAP plots l and dot plots m of representative genes for each cluster of k in SMC dataset (GSE132465). Dash lines denote monocyte-like cluster. n Transcript levels of indicated genes in TCGA (n = 296). o Proportions of monocyte-like cells in myeloid cellular compartment of SMC, stratified by CMS subtypes. p Violin plots for indicated genes in TCGA, stratified by CMS subtypes (n: CMS1 = 85, CNS2 = 132, CMS3 = 78, CMS4 = 184). q Co-immunostaining in human CRC (n = 3 samples). Arrows in e: primary lesion (white), distant metastases (yellow). Dash lines denote liver metastases in e. Scale bars, 10 μm (a, c, g, q), 500 μm e. Immunostaining experiments (a, c, g, q) were independently repeated at least three times, yielding similar results. P values were calculated by two-tailed, unpaired Student’s t test in d, f, or two-tailed Mann–Whitney test n, p. Source data are provided as a Source Data file.
Fig. 6
Fig. 6. BM-derived THBS1-expressing cells are recruited by CXCL12 signaling.
a qRT-PCR analyses in BM cells (n = 3 mice). b FACS analyses in the BM and peripheral blood cells (n = 3 mice). Positive cell numbers in 10000 total cells are shown. c qRT-PCR analyses of sorted cells from BM or peripheral blood of MTO-bearing mice (n = 3 mice). d, e qRT-PCR analyses of sorted cells from MTO tumors in GFP-BM mice (n = 3 mice). f Co-immunostaining of the MTO tumors in GFP-BM mice (n = 3 mice). g qRT-PCR analyses of the MTO tumors in WT-BM WT (n = 5), Thbs1-/--BM Thbs1-/- (n = 6), and WT-BM Thbs1-/- chimeric mice (n = 5). h Macroscopic numbers of metastasis (n: WT-BM WT = 13, Thbs1-/--BM Thbs1-/- = 5, WT-BM Thbs1-/- chimeric mice = 15). i Bioluminescence imaging (top) and H&E staining of liver (bottom) in indicated mice with MTO implantation. j Immunostaining in MTO tumors and positive cell proportion (n = 5 mice). k qRT-PCR analyses in BM cells of MC38- or MTO-bearing mice (n = 3 mice). l Heatmap in TCGA (n: CMS1 = 85, CNS2 = 132, CMS3 = 78, CMS4 = 184). m qRT-PCR analyses in indicated orthotopic tumors in WT mice (n = 3 mice). n Transcript levels in TCGA. o, qRT-PCR analyses of sorted cells from BM of MTO-bearing mice (n = 3). p, FACS analyses of proportions among THBS1+ cells in MTO-bearing WT mice (n = 3). q, Co-immunostaining in WT tumors (n = 3 mice). ru CXCL12 inhibitor (LIT-927) treatment, following orthotopic MTO implantation (n: control = 8, LIT-927 = 7). Schematic representation (r), qRT-PCR analyses (s, n = 4), bioluminescence imaging t, and quantification of macroscopic numbers of metastases u. Arrows in i, t: primary lesions (white), distant metastases (yellow). Dash lines denote liver metastases in i. Scale bars, 10 μm f, j, q, 500 μm i. Mean ± SEM. Two tailed, Mann–Whitney test n, one-way ANOVA p, or tow tailed, unpaired Student’s t test (the rest). Source data are provided as a Source Data file.
Fig. 7
Fig. 7. Inhibition of THBS1 partially improved response of aggressive CRC to current treatments.
a THBS1 expression in MSI-H or MSS CRC from TCGA. b Proportion of MSI-H CRC in TMA samples, stratified by THBS1 expression intensity (n: high = 100, intermediate = 115, low = 93). ch Treatment experiment with anti-PD-1 antibody (αPD-1 ab) or anti-VEGFR2 antibody (αVEGFR2 ab) on MTO-bearing WT or Thbs1-/- mice (n: WT control = 8, THBS1-/- control = 7, WT with αPD-1 ab = 9, Thbs1-/- with αPD-1 ab = 8, WT with αVEGFR2 ab = 8, Thbs1-/- with αVEGFR2 ab = 6). Schematic representation c, and bioluminescence imaging d. Macroscopic images e, growth kinetics f, and the change in diameter g of primary tumors in indicated groups. Macroscopic numbers of liver and lymph node metastases h. i, j Tomato lectin staining (i) in the orthotopic MTO tumors in WT (n = 5) or Thbs1-/- mice (n = 4) and quantification j. k–p, Treatment experiment with FOLFOX on MTO-bearing WT or Thbs1-/- mice (n = mice per group: WT control = 6, THBS1-/- control = 5, WT with FOLFOX = 15, Thbs1-/- with FOLFOX = 9). Schematic representation k and bioluminescence imaging l. Macroscopic images m, growth kinetics n, and the change in diameter o of primary tumors in indicated groups. Macroscopic numbers of liver and lymph node metastases p. Arrows in d, l: primary lesions (white), distant metastases (yellow). Scale bars: 50 μm in i, 1 cm (rest). Mean ± SEM. The whiskers show smallest and largest values and the box extends from the 25th to 75th percentiles, and the line of the middle of the box is plotted at the median in Box and whiskers plot g, o. P values are calculated by two tailed, unpaired Student’s t test g, h, j, o, p, two tailed, Mann–Whitney test a, or two-way ANOVA f, n. Source data are provided as a Source Data file.

Similar articles

Cited by

References

    1. Martinez-Ordoñez A, et al. Hyaluronan driven by epithelial aPKC deficiency remodels the microenvironment and creates a vulnerability in mesenchymal colorectal cancer. Cancer Cell. 2023;41:252–271.e259. - PMC - PubMed
    1. Calon A, et al. Stromal gene expression defines poor-prognosis subtypes in colorectal cancer. Nat. Genet. 2015;47:320–329. - PubMed
    1. Nakanishi Y, et al. Simultaneous loss of both atypical protein kinase C genes in the intestinal epithelium drives serrated intestinal cancer by impairing immunosurveillance. Immunity. 2018;49:1132–1147.e1137. - PMC - PubMed
    1. Kasashima H, et al. Stromal SOX2 upregulation promotes tumorigenesis through the generation of a SFRP1/2-expressing cancer-associated fibroblast population. Dev. Cell. 2021;56:95–110.e110. - PMC - PubMed
    1. Guinney J, et al. The consensus molecular subtypes of colorectal cancer. Nat. Med. 2015;21:1350–1356. - PMC - PubMed

Publication types

Substances