. 2023 Sep 25;14(1):5826.
doi: 10.1038/s41467-023-41118-8.

Targetable NOTCH1 rearrangements in reninoma

Affiliations

Targetable NOTCH1 rearrangements in reninoma

Taryn D Treger et al. Nat Commun. .

Abstract

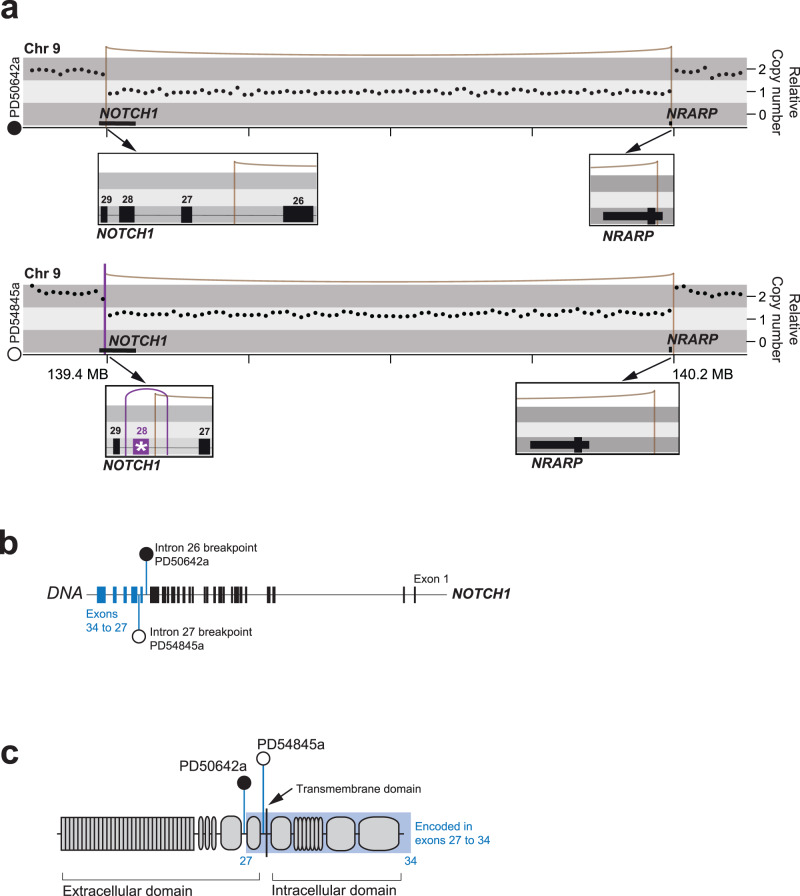
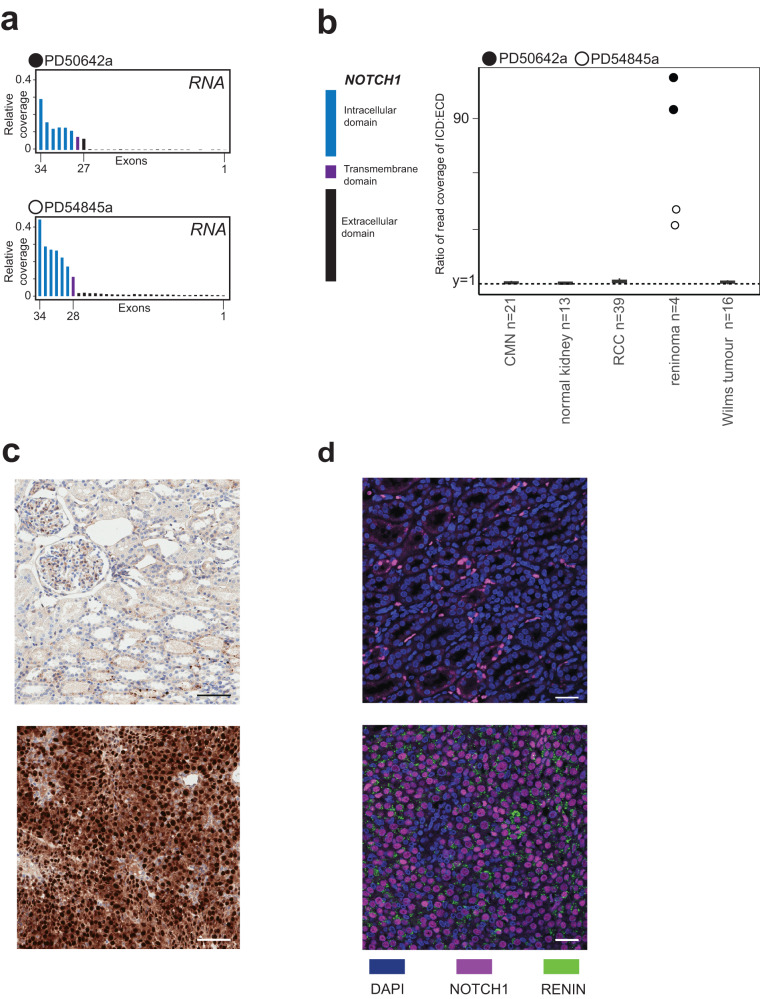
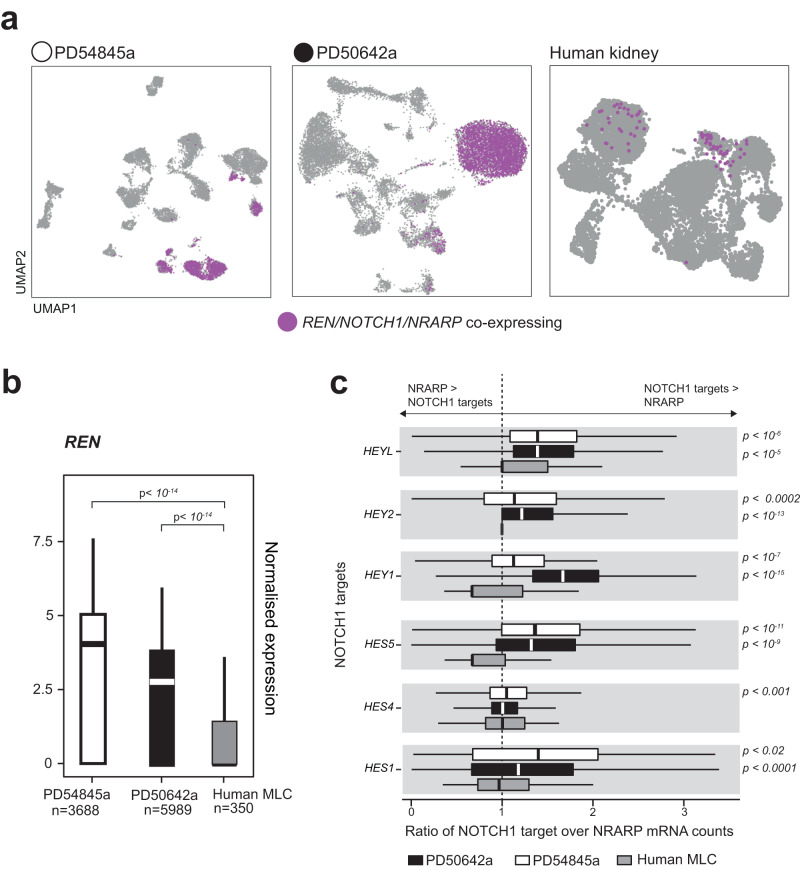
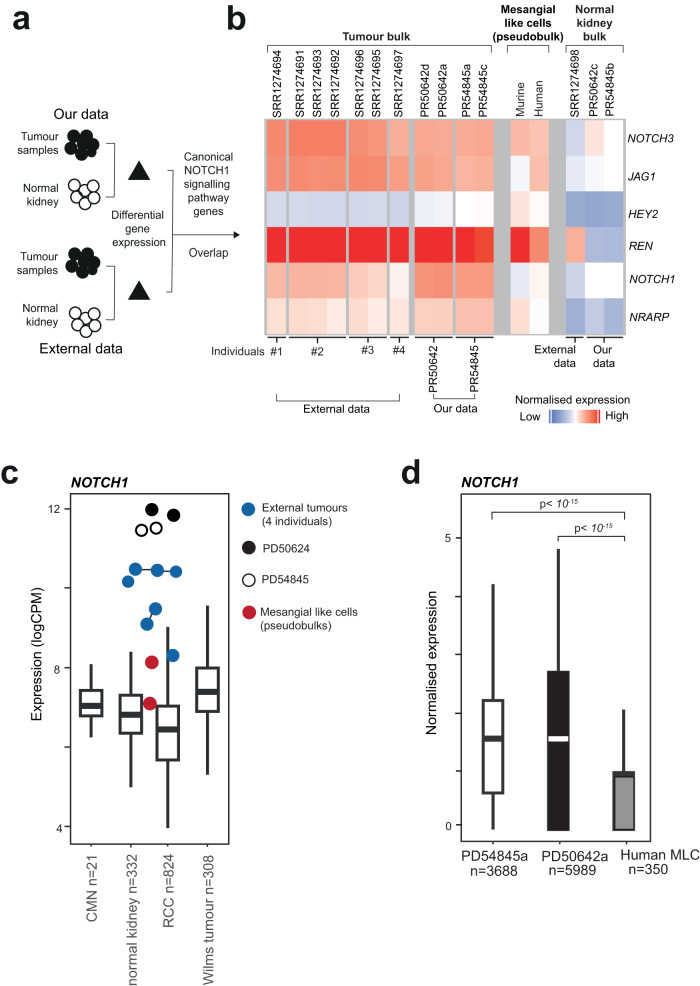
Reninomas are exceedingly rare renin-secreting kidney tumours that derive from juxtaglomerular cells, specialised smooth muscle cells that reside at the vascular inlet of glomeruli. They are the central component of the juxtaglomerular apparatus which controls systemic blood pressure through the secretion of renin. We assess somatic changes in reninoma and find structural variants that generate canonical activating rearrangements of, NOTCH1 whilst removing its negative regulator, NRARP. Accordingly, in single reninoma nuclei we observe excessive renin and NOTCH1 signalling mRNAs, with a concomitant non-excess of NRARP expression. Re-analysis of previously published reninoma bulk transcriptomes further corroborates our observation of dysregulated Notch pathway signalling in reninoma. Our findings reveal NOTCH1 rearrangements in reninoma, therapeutically targetable through existing NOTCH1 inhibitors, and indicate that unscheduled Notch signalling may be a disease-defining feature of reninoma.


Conflict of interest statement

The authors declare no competing interests.

Figures

Fig. 1
Fig. 1. Driver events involving NOTCH1 and NRARP in two reninoma cases.
a Rearrangement plots showing copy number, rearrangements and position on chromosome 9. Boxes detail the position of breakpoints in relation to genes. * highlights exon 28 involved in the inversion in PD54845. b NOTCH1 gene, illustrating where breakpoints occur in each case. c NOTCH1 schematic, illustrating breakpoints occurring in the regulatory region in each case.
Fig. 2
Fig. 2. Expression and staining of NOTCH1 in reninomas.
a Normalised coverage of NOTCH1 from RNA sequencing, plotted per exon, for both primary reninomas. Transmembrane domain highlighted. b Ratio of normalised coverage of NOTCH1 intracellular signalling domain vs. extracellular domain, plotted for reninomas, congenital mesoblastic nephroma (CMN, n = 21), Wilms tumour (n = 16), normal kidney (n = 13) and renal cell carcinoma (RCC, n = 39). c Immunohistochemistry of normal kidney (upper panel) and tumour from case 1 (lower panel) with an antibody targeting NOTCH1 at the C terminus (Ab52627). The experiment was repeated 3 times. Scale bars 100 μm, original magnification 6.5×. d Immunofluorescence with antibodies targeting activated NOTCH1 intracellular domain (D3B8) and renin(ab134783). The upper panel shows staining in the normal kidney. The lower panel highlights the co-expression of activated NOTCH1 (purple staining) and renin(green staining) in reninoma from case 1. The experiment was performed once. Scale bars 30 μm, original magnification 40×.
Fig. 3
Fig. 3. Single nuclear level quantification of NOTCH1 signalling in reninomas and in mesangial-like cells.
a Uniform Manifold Approximation and Projection (UMAP) plots of tumour (left and middle panels) and healthy human kidney (right panel) cells. b Box plot quantifying renin expression in tumour cells and mesangial-like cells (MLC). The box contains the 25th to 75th percentiles of the data, with the central line denoting the median value. The upper whisker extends from the median to the largest value, no further than the 1.5 * inter-quartile range (IQR). The lower whisker extends from the median to the smallest value, at most 1.5 * IQR. Wilcoxon rank-sum test, two-sided, with adjustment for multiple comparisons. c Box plots showing the ratio of NOTCH1 target genes vs. NRARP for tumours and mesangial-like cells (MLC). The box contains the 25th to 75th percentiles of the data, with the central line denoting the median value. The upper whisker extends from the median to the largest value, no further than the 1.5 * inter-quartile range (IQR). The lower whisker extends from the median to the smallest value, at most 1.5 * IQR. Wilcoxon rank-sum test, two-sided, with adjustment for multiple comparisons. HEYL: PD50642a n = 1569, PD54845a n = 2517, MLC n = 111; HEY2: PD50642a n = 1164, PD54845a n = 2913, MLC n = 104; HEY1: PD50642a n = 185, PD54845a n = 536, MLC n = 111; HES5: PD50642a n = 706, PD54845a n = 1171, MLC n = 52; HES4: PD50642a n = 3174, PD54845a n = 5828, MLC n = 144; HES1: PD50642a n = 28, PD54845a n = 517, MLC n = 128. Source data are provided as a Source Data file.
Fig. 4
Fig. 4. Notch signalling across in-house and existing bulk reninoma transcriptomes.
a Schematic of differential gene expression analyses across different data sets. b Heatmap showing expression of Notch signalling genes and REN across reninoma, matched normal kidney, human mesangial-like cells and murine mesangial-like cells. c NOTCH1 expression (log-CPM (counts per million)) in reninomas, compared to mesangial-like cells (psuedobulks, n = 2), normal kidney (n = 332), congenital mesoblastic nephroma (CMN, n = 21), Wilms tumour (n = 308) and renal cell carcinoma (RCC, n = 824). The box contains the 25th to 75th percentiles of the data, with the central line denoting the median value. The upper whisker extends from the median to the largest value, no further than the 1.5 * inter-quartile range (IQR). The lower whisker extends from the median to the smallest value, at most 1.5 * IQR. d Box plot quantifying NOTCH1 expression in tumour cells and mesangial-like cells (MLC). The box contains the 25th to 75th percentiles of the data, with the central line denoting the median value. The upper whisker extends from the median to the largest value, no further than the 1.5 * inter-quartile range (IQR). The lower whisker extends from the median to the smallest value, at most 1.5 * IQR. Wilcoxon rank-sum test, two-sided, with adjustment for multiple comparisons. Source data are provided as a Source Data file.

References

    1. Jamshidi F, Nielsen TO, Huntsman DG. Cancer genomics: why rare is valuable. J. Mol. Med. 2015;93:369–381. - PMC - PubMed
    1. Inam R, Gandhi J, Joshi G, Smith NL, Khan SA. Juxtaglomerular cell tumor: reviewing a cryptic cause of surgically correctable hypertension. Curr. Urol. 2019;13:7–12. - PMC - PubMed
    1. Trnka P, Orellana L, Walsh M, Pool L, Borzi P. Reninoma: an uncommon cause of renin-mediated hypertension. Front. Pediatr. 2014;2:89. - PMC - PubMed
    1. Martini AG, et al. Transcriptome analysis of human reninomas as an approach to understanding juxtaglomerular cell biology. Hypertension. 2017;69:1145–1155. - PMC - PubMed
    1. Castellanos-Rivera RM, et al. Recombination signal binding protein for Ig-κJ region regulates juxtaglomerular cell phenotype by activating the myo-endocrine program and suppressing ectopic gene expression. J. Am. Soc. Nephrol. 2015;26:67–80. - PMC - PubMed

Publication types

MeSH terms