. 2023 Sep 25;14(1):5979.
doi: 10.1038/s41467-023-41633-8.

Driving forces behind phase separation of the carboxy-terminal domain of RNA polymerase II

Affiliations

Driving forces behind phase separation of the carboxy-terminal domain of RNA polymerase II

David Flores-Solis et al. Nat Commun. .

Abstract

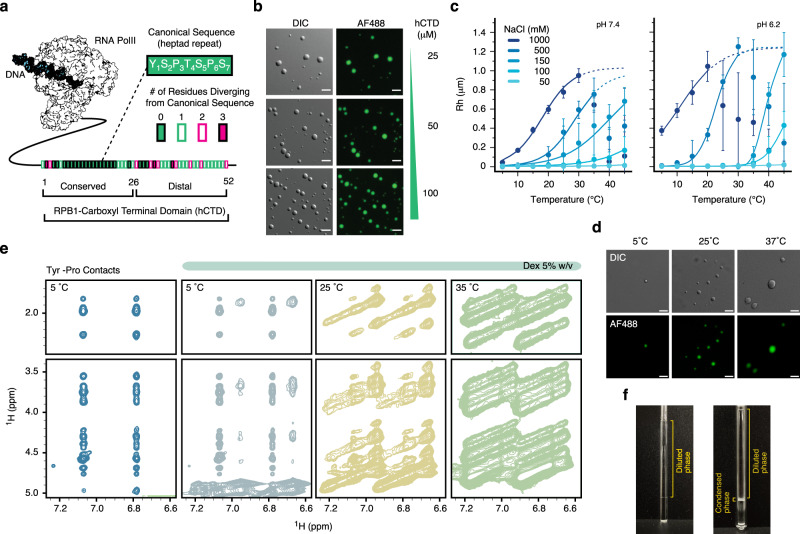
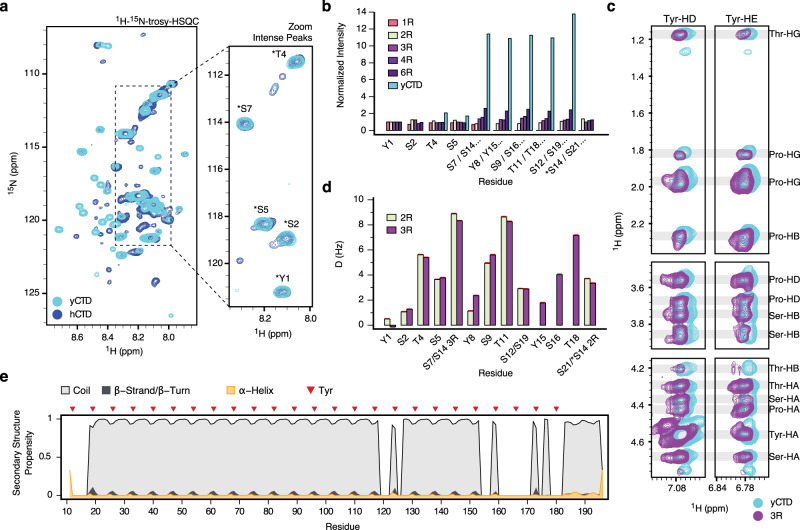
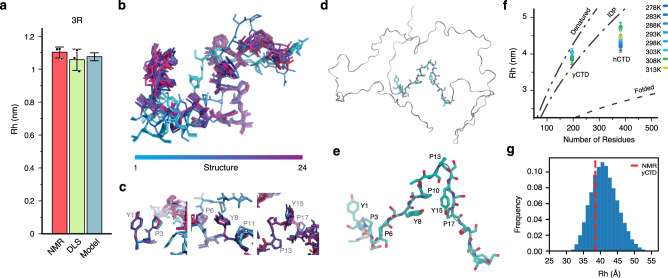
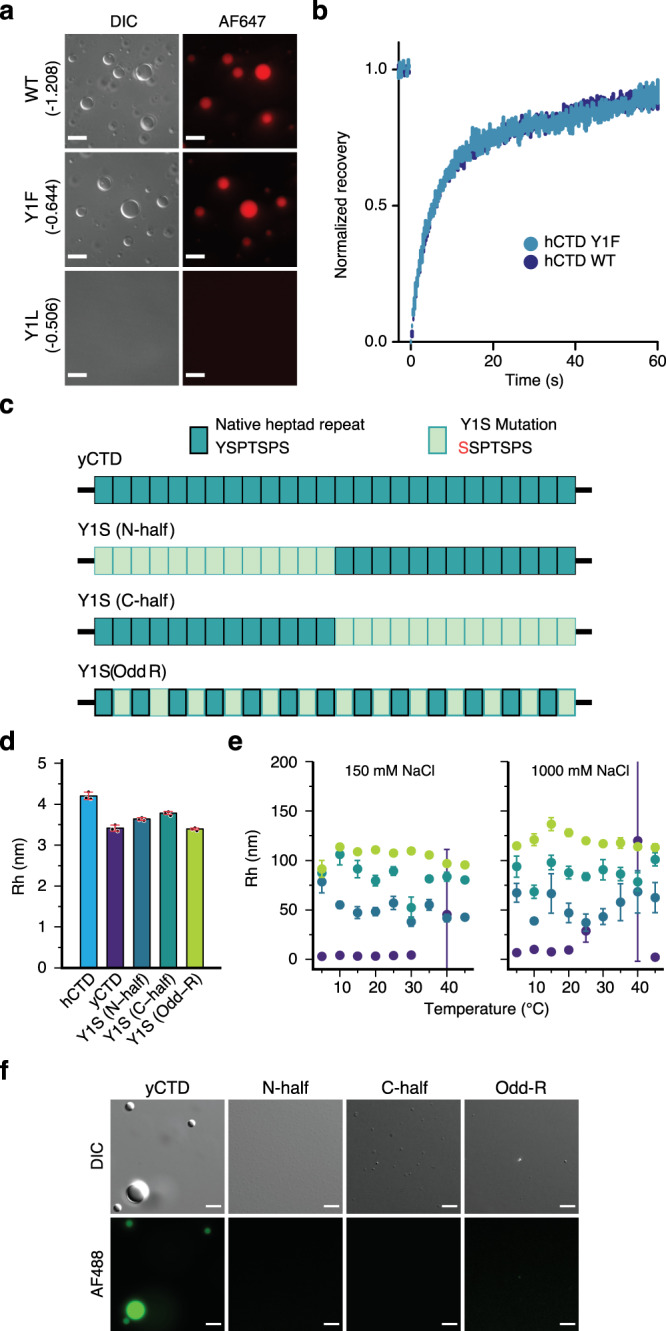
Eukaryotic gene regulation and pre-mRNA transcription depend on the carboxy-terminal domain (CTD) of RNA polymerase (Pol) II. Due to its highly repetitive, intrinsically disordered sequence, the CTD enables clustering and phase separation of Pol II. The molecular interactions that drive CTD phase separation and Pol II clustering are unclear. Here, we show that multivalent interactions involving tyrosine impart temperature- and concentration-dependent self-coacervation of the CTD. NMR spectroscopy, molecular ensemble calculations and all-atom molecular dynamics simulations demonstrate the presence of diverse tyrosine-engaging interactions, including tyrosine-proline contacts, in condensed states of human CTD and other low-complexity proteins. We further show that the network of multivalent interactions involving tyrosine is responsible for the co-recruitment of the human Mediator complex and CTD during phase separation. Our work advances the understanding of the driving forces of CTD phase separation and thus provides the basis to better understand CTD-mediated Pol II clustering in eukaryotic gene transcription.


Conflict of interest statement

The authors declare no competing interests.

Figures

Fig. 1
Fig. 1. Phase separation of human CTD.
a Schematic representation of human RNA Pol II illustrating the conserved heptad repeats YSPTSPS of the CTD of RPB1, the largest subunit of Pol II. Variations from the YSPTSPS repeat sequence are color coded. b Micrographs demonstrating concentration-sensitive phase separation of hCTD in the absence of molecular crowding agents (300 mM NaCl, 25 mM HEPES, 1.0 mM TCEP, pH 7.4). c Influence of temperature, pH, and ionic strength to induce hCTD phase separation (in 25 mM HEPES, 1.0 mM TCEP) monitored by dynamic light scattering. No crowding agents were used. Solid lines represent sigmoidal regression; dotted lines indicate tendencies in conditions where sedimentation occurred. Dots represent mean values (n = 3) and error bars represent ± std for independent measurements. d Droplet morphologies of hCTD (25 μM) in high salt conditions. The pictures correspond to 1 M NaCl in 25 mM HEPES, 1.0 mM TCEP (pH 7.4) at three different temperatures. e, f Interresidue contacts in two-dimensional 1H-1H NOESY spectra of yCTD in isotropic mixed conditions (5 °C without dextran; blue) and in conditions of phase separation (5 % dextran and increasing temperature). Cross-peaks between aromatic Tyr protons and aliphatic side-chain protons (vertical scale) are displayed in (e). The NMR tubes in (f) show the formation of a macroscopic condensate prior to recording the NOESY spectra in the presence of dextran and increased temperature. Micrographs are representative of 3 independent biological replicates. Scale bar, 5 µm.
Fig. 2
Fig. 2. Tyrosine-proline contacts in CTD heptad repeats.
a Superposition of 1H-15N- TROSY spectra of human (dark blue) and yeast (cyan) CTD. The region highlighted displays the most intense peak resonances from residues of the canonical heptad repeats (above 50% of the initial threshold). Typical chemical shifts from canonical residues (*) are indicated in the inset. b Residue-specific normalized cross peak intensities observed in 1H-15N-HSQC spectra of yCTD and CTD peptides composed of one to six canonical heptad repeats YSPTSPS. For longer sequences, the cross peaks of individual heptad repeats overlap (labeled e.g. as “S7/S14…”). c NOE contacts between Tyr ring protons and aliphatic proline protons in two-dimensional 1H-1H NOESY spectra of 3R-CTD (purple) and yCTD (cyan) at non-phase separating conditions (5 °C). In addition to Tyr-Pro contacts, Tyr-Thr and Tyr-Ser cross-peaks were assigned in the NOESY spectrum of 3R-CTD. d 1H-15N residual dipolar couplings (RDCs) for 2R- and 3R-CTD. Due to the increased resolution in the IPAP-HSQC experiments, RDCs could be determined for individual residues in the repeats. e Secondary structure propensity in yCTD derived from experimental NMR chemical shifts. The location of Tyr residues is marked by red triangles. Non-assigned/overlapping residues were excluded from the analysis.
Fig. 3
Fig. 3. CTD structure in the dilute phase.
a Hydrodynamic radius Rh of 3R-CTD from NMR, DLS, and the ensemble of structures shown in (b). Error bars in panel (a) represent two times std. b, c Ensemble of low energy structures of 3R-CTD calculated with Rosetta using NMR restraints. Individual structures are colored from blue to purple. Contacts between Pro and Tyr residues are highlighted in (c). d, e Selected structure of yCTD from the ensemble of yCTD conformations generated by hierarchical chain growth (HCG) with the help of NMR data. A 21-residue fragment comprising three conserved heptad repeats is shown with side-chains. Residue numbering in (e) starts with the N-terminal Tyr of the 21-residue fragment. f Hydrodynamic radii Rh of hCTD and yCTD at increasing temperatures in the dilute phase (25 μM concentration of hCTD/yCTD). Error bars represent two times std for independent NMR diffusion measurements (n = 3). The curves describe the predicted tendency of Rh as a function of the number of residues for fully denatured, intrinsically disordered (IDP), and folded proteins. g Histogram distribution of Rh values for the HCG structures of yCTD compared with the experimental value at 5 °C (red dashed line).
Fig. 4
Fig. 4. Contribution of tyrosine residues to CTD phase separation.
a Micrographs of wild-type (WT) hCTD and variants in which all Tyr residues were replaced by phenylalanine (Y1F) or leucine (Y1L). Wild-type CTD and the Y1F variant, but not the Y1L variant, form droplets at a concentration of 20 μM in the presence of 16% w/v dextran. Scale bar, 10 μm. The GRAVY score, indicating the hydrophobic character of each construct, is shown in parenthesis; a higher value indicates stronger hydrophobicity. b Superposition of the fluorescence recovery curves (n = 5) of wild-type hCTD (blue) and the variant Y1F (cyan). Curves show the average normalized recovery (mean ± standard error). cf Influence of the distribution of Tyr residues on yCTD phase separation. Three different variants were analyzed, in which either the Tyr residues in the N-terminal half (Y1S (N-half)) or the C-terminal half (Y1S (C-half)) or every second Tyr (Y1S (Odd-R)) were replaced by Ser (schematically shown in (c)). Panel (d) compares the mean (n = 3) hydrodynamic radii of the three constructs with wild-type yCTD as determined by diffusion NMR in the dilute phase (5 °C; protein concentration 100 μM). Error bars in (d) represent two times std. Hydrodynamic radii of Y1S variants of yCTD in phase separation-promoting conditions (100 μM each and pH 7.4) for two different NaCl concentrations are shown in (e) (mean ± std). Wild-type yCTD (purple) starts to form droplets at >25 °C. Error bars in (e) represent std for independent measurements (n = 3). Variants in the columns of panel (f) were fluorescently labeled with Alexa Fluor 488 (AF488) and tested for phase separation by microscopy at similar conditions as shown in panel (e) (150 mM NaCl). Scale bar, 5 μm. Micrographs in panel (a) and (f) are representative of 3 independent biological replicates.
Fig. 5
Fig. 5. Aromatic and side-chain intramolecular contacts.
a The design variants TPPS and PYP with the same amino acid composition as yCTD but changed sequence. Swapped residues are shown in red. b Overlay of the aromatic regions of two-dimensional 1H-1H NOESY spectra of yCTD and its PYP and TPPS variants recorded in the dilute phase. Five regions of interest (ROI) were defined and used for signal integration. c, d Integrals of the NOE peaks (arbitrary units; AU) extracted from the spectra in panel (b). The integrals are classified into two vertical categories corresponding to the chemical shift of the aromatic protons in positions epsilon (c) and delta (d). The stacks of each graph are divided into the five horizontal regions of chemical shifts (δ; vertical scale) indicated graphically in (b).
Fig. 6
Fig. 6. Analysis of intermolecular tyrosine-proline interactions in MD simulations.
a Visualization of the MD simulation box for the multi-copy system (10 protein copies). Each protein copy is colored differently and is labeled with a number. Proteins are shown in cartoon representation with Pro and Tyr side-chains in stick representation. b Distribution of distances between Pro and Tyr rings in a subset of Pro and Tyr pairs with contact frequency above 10%. Representative configurations (central structures of structural clusters) of Tyr-Pro pairs in single-copy (single) and multi-copy (multi) systems are shown in relation to the actual distance between the residues. c Representative configurations of Tyr-Pro pairs for the most highly populated (top) structural clusters with the applied all-atom RMSD cut-off of 0.7 Å. The shown structures correspond to the filled circles in (d). Cluster populations and distances between the residues are indicated. d Occupancy of the top structural clusters with respect to the applied all-atom RMSD cut-off used for clustering. The populations of the top clusters were estimated relative to the total number of configurations in joint master Tyr-Pro MD trajectories (see Methods) with a separation distance <2 nm (see (b)).
Fig. 7
Fig. 7. Enrichment of intermolecular tyrosine-proline interactions in simulated crowded environments.
a Absolute fractions of the top 10 residue-residue contacts in the multi-copy system. Below, the sequence logo corresponding to the composition of heptads in the full-length hCTD sequence is shown. b Position-resolved interaction matrix in hCTD heptads obtained for single-copy (intramolecular contacts) and multi-copy (intermolecular contacts) systems. A value given for each pair corresponds to the ratio of the frequency of a particular contact type in the pool of all contacts seen in MD and the same frequency in a randomized background. Contacts colored red are enriched, and those shown in blue are depleted. Only positions corresponding to the canonical heptad residues are considered for the analysis. c Distribution of intermolecular contact frequencies along the hCTD sequence, averaged over the 10 protein copies in multi-copy simulations. Sequence positions corresponding to Tyr and Pro residues are indicated with green and blue-filled circles, respectively. d Comparison of depletion/enrichment values for Tyr-Pro contacts in the inter molecular context (multi-copy systems) to those in the intra-molecular context (single-copy systems) estimated as a ratio between the observed and the expected fractions of contacts, with the latter being evaluated from the frequency of residues in question. The corresponding fractions of the contacts are indicated above bars. The results of hCTD simulations are shown in comparison to the statistics obtained for other disordered low-complexity proteins (LGE1, FUS), simulated using the same modeling framework.
Fig. 8
Fig. 8. Co-recruitment of Mediator complex and human CTD into condensates.
a Differential interference contrast and fluorescence microscopy of the phase separation of hCTD and the human Mediator complex. Different mixtures and conditions are indicated with vertical bars. hCTD was labeled with Alexa Flour 488 (AF488; green), and the human mediator complex hMED with Alexa Flour 647 (red). be Structure of the mediator-bound preinitiation complex (PDB id 7ENC). Some proteins were omitted for better visualization in panel (b). The structure of the hMED-bound CTD is displayed in (b, inset). Panels ce highlight Tyr-Tyr (c), Pro-Pro (d), and Tyr-Pro (c and e) contacts between mediator subunits and hCTD. Micrographs are representative of 3 independent biological replicates. Scale bar, 5 µm.

Similar articles

Cited by

References

    1. Banani SF, Lee HO, Hyman AA, Rosen MK. Biomolecular condensates: organizers of cellular biochemistry. Nat. Rev. Mol. Cell Biol. 2017;18:285–298. - PMC - PubMed
    1. Choi J-M, Holehouse AS, Pappu RV. Physical principles underlying the complex biology of intracellular phase transitions. Annu. Rev. Biophys. 2020;49:107–133. - PMC - PubMed
    1. Sabari BR, Dall’Agnese A, Young RA. Biomolecular condensates in the nucleus. Trends Biochem. Sci. 2020;45:961–977. - PMC - PubMed
    1. Chong S, et al. Imaging dynamic and selective low-complexity domain interactions that control gene transcription. Science. 2018;361:378–378. - PMC - PubMed
    1. Guo C, Luo Z, Lin C. Phase separation, transcriptional elongation control, and human diseases. J. Mol. Cell Biol. 2021;13:314–318. - PMC - PubMed

Publication types

Substances