. 2023 Sep 25;14(1):5980.
doi: 10.1038/s41467-023-41615-w.

Structural insights into the mechanism of GTP initiation of microtubule assembly

Affiliations

Structural insights into the mechanism of GTP initiation of microtubule assembly

Ju Zhou et al. Nat Commun. .

Abstract

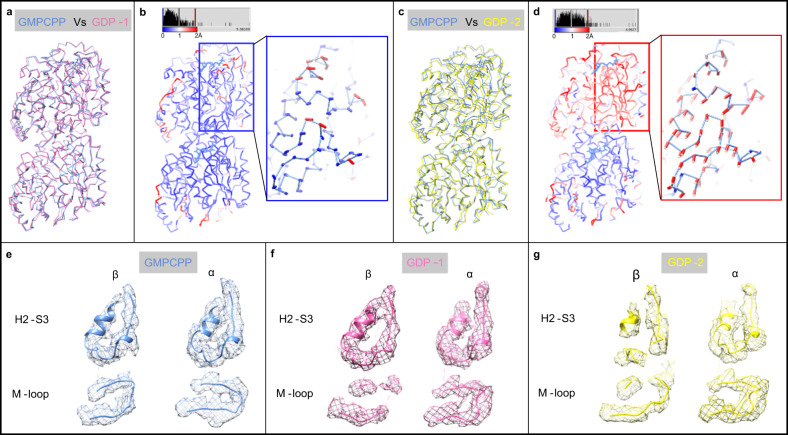
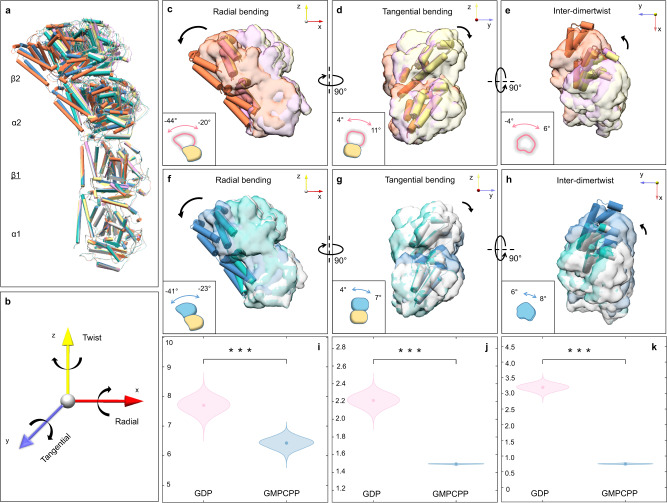
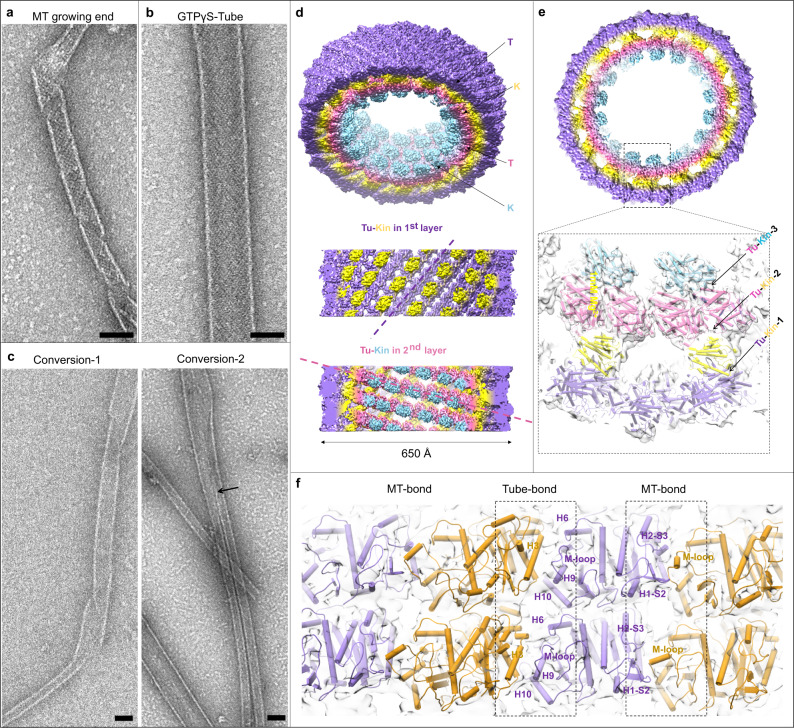
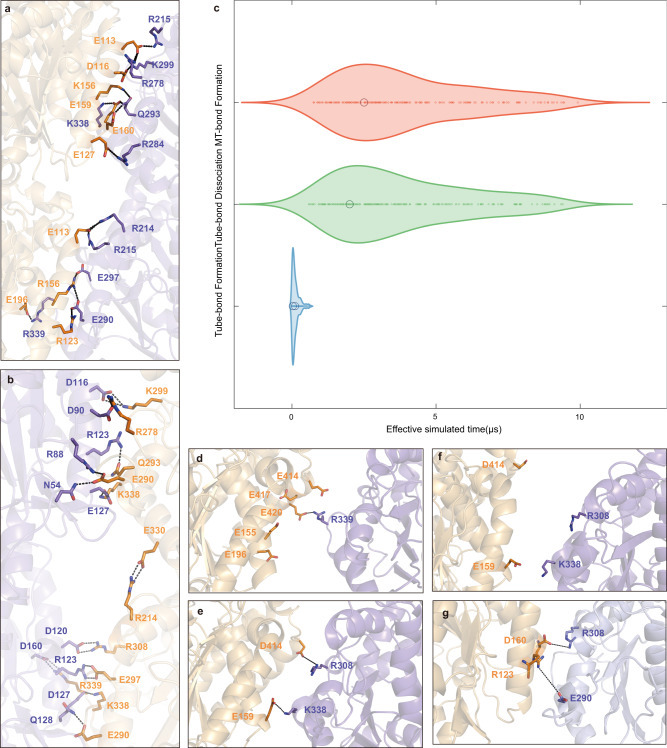
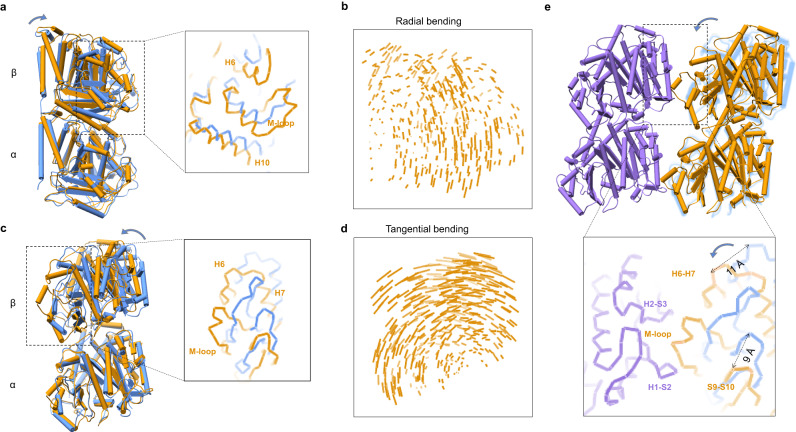
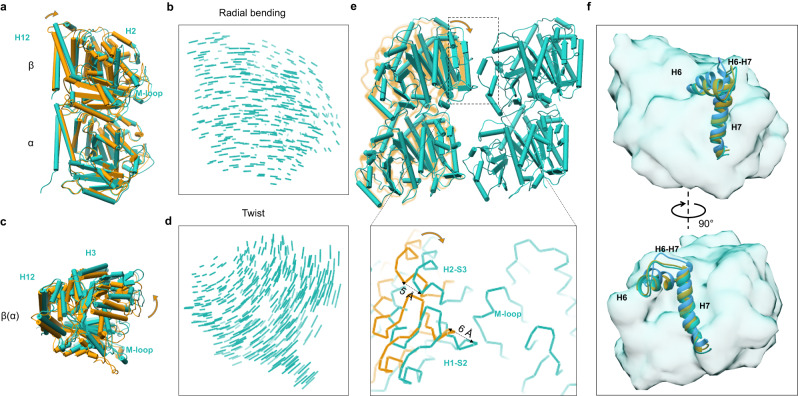
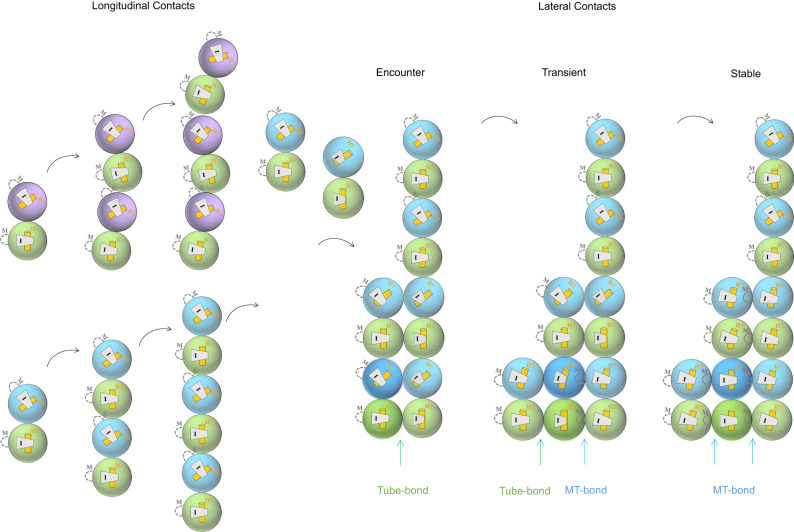
In eukaryotes, the dynamic assembly of microtubules (MT) plays an important role in numerous cellular processes. The underlying mechanism of GTP triggering MT assembly is still unknown. Here, we present cryo-EM structures of tubulin heterodimer at their GTP- and GDP-bound states, intermediate assembly states of GTP-tubulin, and final assembly stages of MT. Both GTP- and GDP-tubulin heterodimers adopt similar curved conformations with subtle flexibility differences. In head-to-tail oligomers of tubulin heterodimers, the inter-dimer interface of GDP-tubulin exhibits greater flexibility, particularly in tangential bending. Cryo-EM of the intermediate assembly states reveals two types of tubulin lateral contacts, "Tube-bond" and "MT-bond". Further, molecular dynamics (MD) simulations show that GTP triggers lateral contact formation in MT assembly in multiple sequential steps, gradually straightening the curved tubulin heterodimers. Therefore, we propose a flexible model of GTP-initiated MT assembly, including the formation of longitudinal and lateral contacts, to explain the nucleation and assembly of MT.


Conflict of interest statement

The authors declare no competing interests.

Figures

Fig. 1
Fig. 1. Comparison of GMPCPP- and GDP-tubulin heterodimer structures in solution.
a Cα-trace superimposition of the two tubulin heterodimer models between GMPCPP (cornflower blue) and GDP-1 (hot pink) state, aligned on the α-tubulin (same for bd). b Cα-atoms-RMSD between the two models shown in a, with deviations colored from blue to red. The chain-trace being displayed corresponds to the GMPCPP-tubulin model. Displacement vectors of Cα-chain of H1-S2 and H2-S3 loops in β-tubulin are represented by heavy lines in the inset. The vector >1 Å is colored in red and <1 Å is colored in blue (same for d). c Cα-trace superimposition of the two tubulin heterodimers between GMPCPP (cornflower blue) and GDP-2 state (yellow). d Cα-atoms-RMSD between the two models shown in c. The inset shows the displacement vectors of H1-S2 and H2-S3 loops. eg The density of cryo-EM maps (mesh) and corresponding models of H2-S3 loop and M-loop. β-tubulin is shown in the left panel and α-tubulin in the right panel. e GMPCPP state. f GDP-1 state. g GDP-2 state. Electron densities are contoured at 3.06 σ.
Fig. 2
Fig. 2. The curvature fluctuation around the inter-dimer interfaces of tubulin tetramer in solution.
a Overview of three major conformations of GDP- and GMPCPP-tubulin tetramers. All models are aligned together using β1-tubulin as reference. GDP-tubulin tetramers are colored with coral, plum and khaki, respectively. GMPCPP-tubulin tetramers are colored with steel blue, light sea green and light gray, respectively. b The coordinate system is defined to describe the bending angles of α2, β2-tubulin relative to α1, β1-tubulin. And the quantitative values of the angles are decomposed in the x (radial bending), y (tangential bending) and z (twist) axes. ch Bending of inter-dimer in radial, tangential and twist directions. The upper heterodimer (α2, β2-tubulin) shown in (a) of GDP-state (ce) and GMPCPP-state (fh). The black arrow indicates the direction of bending. A simplified cartoon model and its bending angle range are displayed in the left-bottom corner. H11 and H12 helices are represented as cylinders, the N and I domain are shown as surfaces. ik Violin plots representing the standard deviation of bending angles are shown for GDP and GMPCPP states, obtained from bootstrapping datasets for a two sample T-test. The circles in each related violin plot indicate the mean value of the standard deviation angle. The vertical axis represents the standard deviation of bending angles, while the horizontal axis corresponds to different nucleotide states. The two sided T-test assumed the standard deviation angles of GDP and GMPCPP are in the same distributions with equal means in 1 dimensional space with the 95% confidence interval. Statistically significant results from the two sided T-tests are denoted as follows: *p-value < 0.05; **p-value < 0.01; ***p-value < 0.001. In all three tests, the hypotheses are rejected. i Violin plot displaying the distribution of standard deviation in radial bending angles. The p-value is 1*10−11 and effect size is 5.38. j Violin plot displaying the distribution of standard deviation in tangential bending angles. The p-value is 1*10−12 and effect size is 13.13. k Violin plot displaying the distribution of standard deviation in twist angles. The p-value is 1*10−12 and effect size is 30.07.
Fig. 3
Fig. 3. Negative-staining EM micrographs and cryo-EM structure of the MT assembly intermediate.
ac EM micrographs of negatively stained specimens. Scale bar: 50 nm. a Helical ribbons appear at the growing end of GTPγS-MT at 28 °C with 2 mM Mg2+. b Only GTPγS-Tube exists in the condition of 10 mM Mg2+. c GTPγS-Tubes convert into MT directly in two different ways. Left (Conversion-1): One Tube converts into one MT. Right (Conversion-2): One Tube splits into two MTs. The branch point is pointed out by the black arrow. Three independent replications of negative staining were conducted. df Cryo-EM structure of GTPγS-Tube-KMD complex. d The density map of GTPγS-Tube-KMD complex. Top: Slightly tilted top view of the whole complex. Middle: Side view of the outer tubulin (medium purple) and kinesin (yellow). Bottom: Side view of the inner tubulin (hot pink) and kinesin (cyan). The dashed line indicates the direction of tubulin heterodimer arrangement. e A cross section of the whole map. Atomic models of tubulin and kinesin are fitted in the density map, and three tubulin-kinesin interfaces are labeled (inset). f The density map and corresponding models of four adjacent tubulin heterodimers in the outer layer of GTPγS-Tube. “Tube-bond” and “MT-bond” interfaces are indicated by the black box with dashed line. Secondary structures engaging in these interfaces are labeled.
Fig. 4
Fig. 4. The “Tube-to-MT” conversion revealed by MD simulations.
a, b Two snapshots of the MD simulations show different lateral interactions. The dominant amino acid residues are listed in the “Tube-bond” interface (a) and “MT-bond” interface (b). The tubulin model is depicted as a ribbon structure, with key residues represented as sticks. Dark orange and light purple indicate the adjacent tubulin subunits. c The violin plots demonstrate the distribution of effective simulated time in three main states of “Tube-bond Formation” (blue), “Tube-bond Dissociation” (green) and “MT-bond Formation” (red). dg Snapshots of the MD simulations show the lateral interface between two tubulin monomers during the process of “Tube-bond Formation” (d, e), “Tube-bond Dissociation” (f) and “MT-bond Formation” (g). The dominant residues are shown as sticks.
Fig. 5
Fig. 5. M-loop gets ordered upon forming one side of the lateral contacts of “MT-bond”.
ad Structural comparison between the initial state of GMPCPP-tubulin heterodimer in solution (blue) and the intermediate state of tubulin heterodimer in the Tube lattice (orange). Models are superimposed on the α-tubulin. The direction of movement is marked by the blue arrow. a Side view. The inset shows the movements of M-loop and its surrounding regions (same for c). b Displacement vectors of β-tubulin Cα coordinates comparison between two tubulin heterodimers shown in (a). The length of the stick correlates with its displacement (same for d). c, d Structural changes (c) and β-tubulin displacement vectors (d) shown from the tangential direction. e Structural changes of β-tubulin upon forming the one side of “MT-bond” with neighboring tubulin heterodimer. Two neighboring tubulin heterodimer models forming “MT-bond” in the Tube lattice are colored with medium purple and orange. The GMPCPP-tubulin heterodimer model in solution is colored in cornflower blue. The structure model of GMPCPP-tubulin heterodimer in solution is superimposed on the tubulin heterodimer (orange) in the Tube lattice, using α-tubulin as reference. The inset is a zoom-in view of key components of lateral contacts, including M-loop.
Fig. 6
Fig. 6. H1-S2 and H2-S3 loops are pulled close to the neighbor M-loop to form the other “MT-bond”.
a, b Structural comparison between the tubulin heterodimer in the Tube lattice and MT lattice, shown from the radial bending direction. Models are superimposed on the α-tubulin. The radial bending direction is indicated by the orange arrow. Two models are displayed in (a) as a side view, and the corresponding β-tubulin displacement vectors are shown in (b). c, d Structural comparison shown from the top view. Two models are displayed in (c), and the corresponding β-tubulin displacement vectors are shown in (d). e Structural changes of β-tubulin upon forming the other side of “MT-bond”. Two adjacent tubulin heterodimer models in the MT lattice are colored in green. The structure model of tubulin heterodimer in the Tube lattice (orange) is superimposed on that of the left tubulin heterodimer in the MT lattice, using α-tubulin as reference. The inset is a zoom-in view of key components of lateral contacts of “MT-bond”. f H6 and H7 helix of β-tubulin during different MT assembly stages. Top: Side view. Bottom: Back view. H6 and H7 helix of β-tubulin in solution is colored in cornflower blue, those in the Tube and MT lattice are colored in orange and green, respectively. The whole β-tubulin is shown with a green transparent surface.
Fig. 7
Fig. 7. Schematic illustration of the conformational changes of the MT assembly.
α- and β-tubulin are represented by green, blue (GTP bound) and purple (GDP bound) spheres. M-loops that are disordered and M-helixes that are ordered are indicated by curved dashed lines and solid lines, respectively. Helix H7 and the intermediate domain (I) undergo a rotational movement during the curved-to-straight process, indicating different intra-dimer curvatures. In the process of assembling microtubules, two major steps occur sequentially: longitudinal contacts are formed first, followed by lateral contacts. In the early assembly stage, single-strand GTP-tubulin oligomers display less structural variation between different tubulin heterodimers than GDP-tubulin oligomers. Upon reaching the length of four heterodimers longitudinally, a single strand of GTP-tubulin starts to recruit new tubulin heterodimer and form lateral contacts containing three different states: the “encounter state” (one Tube-bond), the “transient state” (one MT-bond), and the “stable state” (two MT-bonds). Once a newly joined tubulin heterodimer (colored with deep green and blue) has gone through the whole process mentioned above, the intra-dimer curvature changes from ~12° to ~0°.

Similar articles

Cited by

References

    1. Roostalu J, Surrey T. Microtubule nucleation: beyond the template. Nat. Rev. Mol. Cell Biol. 2017;18:702–710. - PubMed
    1. Kaul R, Risinger AL, Mooberry SL. Microtubule-targeting drugs: more than antimitotics. J. Nat. Prod. 2019;82:680–685. - PubMed
    1. Dostál V, Libusová L. Microtubule drugs: action, selectivity, and resistance across the kingdoms of life. Protoplasma. 2014;251:991–1005. - PubMed
    1. Gudimchuk NB, McIntosh JR. Regulation of microtubule dynamics, mechanics and function through the growing tip. Nat. Rev. Mol. Cell Biol. 2021;22:777–795. - PubMed
    1. Jordan MA, Kamath K. How do microtubule-targeted drugs work? An overview. Curr. Cancer Drug Targets. 2007;7:730–742. - PubMed

Publication types