. 2023 Sep 25;14(1):5958.
doi: 10.1038/s41467-023-41690-z.

Genome-wide enhancer-gene regulatory maps link causal variants to target genes underlying human cancer risk

Affiliations

Genome-wide enhancer-gene regulatory maps link causal variants to target genes underlying human cancer risk

Pingting Ying et al. Nat Commun. .

Abstract

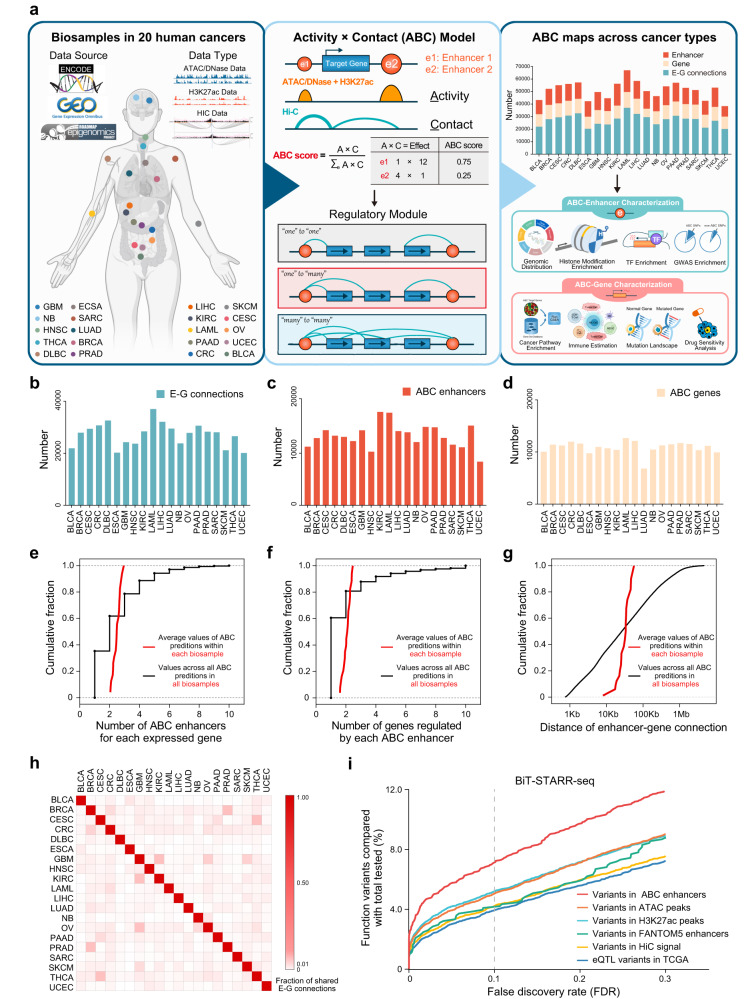
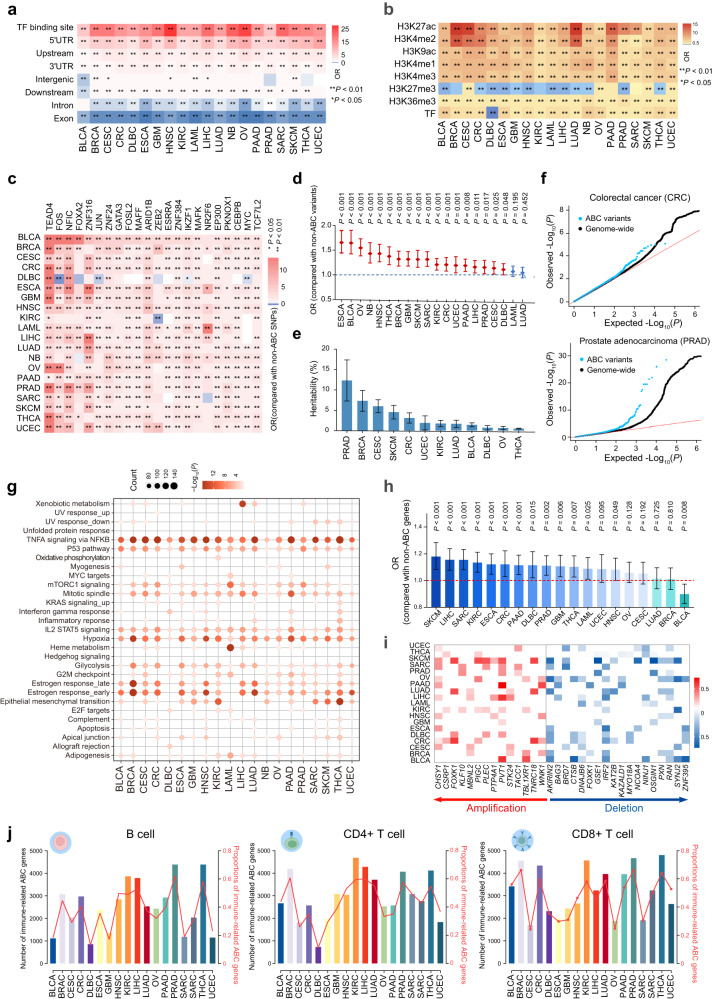
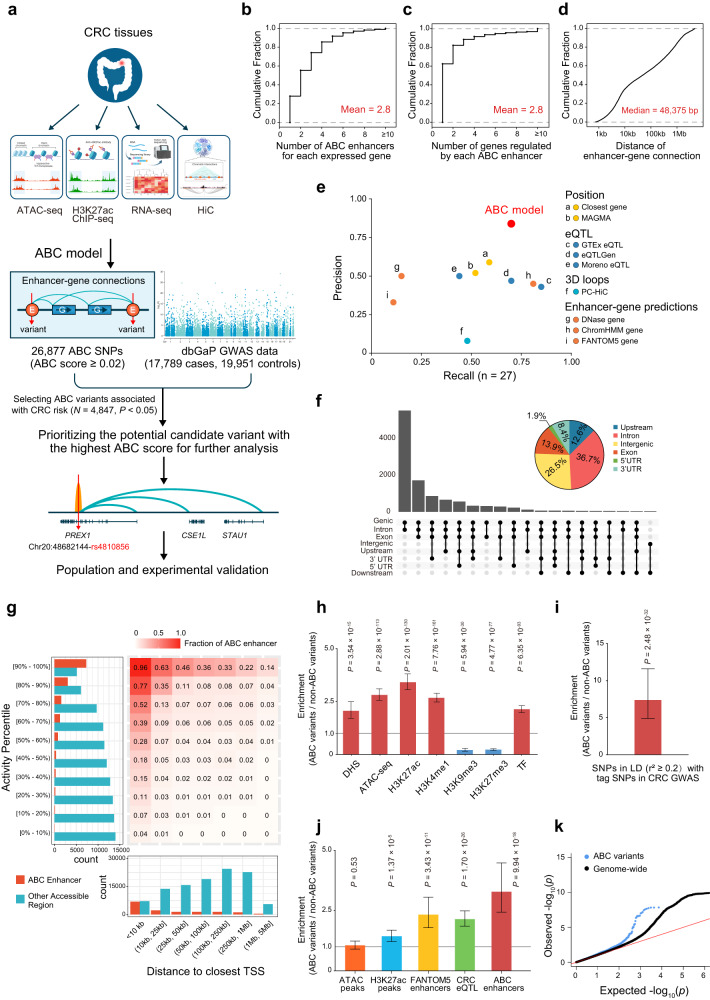
Genome-wide association studies have identified numerous variants associated with human complex traits, most of which reside in the non-coding regions, but biological mechanisms remain unclear. However, assigning function to the non-coding elements is still challenging. Here we apply Activity-by-Contact (ABC) model to evaluate enhancer-gene regulation effect by integrating multi-omics data and identified 544,849 connections across 20 cancer types. ABC model outperforms previous approaches in linking regulatory variants to target genes. Furthermore, we identify over 30,000 enhancer-gene connections in colorectal cancer (CRC) tissues. By integrating large-scale population cohorts (23,813 cases and 29,973 controls) and multipronged functional assays, we demonstrate an ABC regulatory variant rs4810856 associated with CRC risk (Odds Ratio = 1.11, 95%CI = 1.05-1.16, P = 4.02 × 10⁻⁵) by acting as an allele-specific enhancer to distally facilitate PREX1, CSE1L and STAU1 expression, which synergistically activate p-AKT signaling. Our study provides comprehensive regulation maps and illuminates a single variant regulating multiple genes, providing insights into cancer etiology.


Conflict of interest statement

The authors declare no competing interests.

Figures

Fig. 1
Fig. 1. Landscapes of genome-wide enhancer-gene maps across 20 cancer types.
a Overview of ABC enhancer-gene maps across 20 cancer types, which was created with BioRender.com. The multi-omics data that were used to build ABC model including DNase-seq, ATAC-seq, H3K27ac ChIP-seq and HiC-seq of 20 cancer types from multiple datasets were indicated at the left. Enhancer-gene connections were identified by the calculation of ABC score for investigating the different gene regulatory modules. ABC variants and target genes were characterized based on functional enrichment compared to non-ABC variants or genes. Summary of the enhancer-gene maps across 20 cancer types. Bar charts represented the number of enhancer-gene connections (b), ABC enhancers (c) and ABC genes (d) in each cancer type. e Cumulative fractions of the number of enhancers predicted to regulate each gene across 20 cancer types (black line; mean = 2.5) and the mean number of enhancers predicted to regulate each gene within each cancer type (red line; median = 2.5). f Cumulative fractions of the number of genes regulated by each ABC enhancer across 20 cancer types (black line; mean = 2.0) and the mean number of genes regulated by each ABC enhancer within each cancer type (red line; median = 2.1). g Cumulative fractions of the genomic distances between the enhancer and the gene for each predicted enhancer–gene connection across 20 cancer types (black line; median = 26,755 bp) and the median genomic distance between each enhancer-gene connection within each cancer type (red line; median = 28,266 bp). h Replicability of enhancer-gene pairs across cancer types. The color represents the replication ratio of enhancer-gene pairs of one cancer (y-axis) in another cancer type (x-axis). Two connections are considered overlapping if the predicted genes were the same and the enhancer elements overlapped. i Enrichment analyses for variants detected from different approaches (ABC model, ATAC peaks, H3K27ac peaks, FANTOM enhancers, HiC signals or eQTL) within the functionally validated genetic variants set tested by Biallelic Targeted STARR-seq (BiT-STARR-seq) from multiple cancers. The percentages of variants deemed to have genotype-dependent enhancer activity at different FDR thresholds were shown for each set. Source data are provided with this paper.
Fig. 2
Fig. 2. Functional characterization of ABC variants and target genes.
a Enrichment analyses of ABC variants in each functional category of genomic distribution compared with control variants (non-ABC variants). P-values were calculated by two-tailed Fisher’s exact test. b Enrichment analyses of ABC variants in regulatory elements including H3K27ac, H3K4me2, H3K9ac, H3K4me1, H3K4me3, H3K27me3, H3K36me3, TF-binding sites compared with non-ABC variants. P-values were calculated by two-tailed Fisher’s exact test. c Heatmap of enrichment analyses for ABC variants within TF-binding sites from ChIP-seq data of ENCODE portal. P-values were calculated by two-tailed Fisher’s exact test. d Enrichment analyses of ABC variants in cancer-related GWAS variants (LD ≥ 0.2) compared with non-ABC variants. P-values were calculated by two-tailed Fisher’s exact test and bars indicate 95% CIs. e Proportion of GWAS trait heritability explained by ABC variants. The error bars represented standard error. f Quantile-quantile (QQ) plots of P values from GWAS of selected traits. ABC variants were shown in comparison with genome wide variants. GWAS variants were binary annotated using ABC variants with P < 0.05. g GSEA enrichment analyses of ABC genes in MsigDB hallmark gene sets. The circle color represents the significance of enrichment, and the circle size denotes the number of ABC genes within each gene set. h Enrichment analyses of ABC genes in somatically mutated genes from COSMIC database compared with non-ABC genes. P-values were calculated by two-tailed Fisher’s exact test and bars indicate 95% CIs. i The frequencies of amplification and deletion (red indicated amplifications and blue indicated deletions) in ABC genes. Genes recurrently mutated among 20 cancer types were shown. j The number of ABC genes associated with immune cell infiltration estimated by TIMER in each cancer type (left y-axis). The right y-axis shows the proportion of these immune-related ABC genes. The cell symbols were created with BioRender.com. Source data are provided with this paper.
Fig. 3
Fig. 3. Identifying enhancer-gene regulatory connections in our CRC tissues by ABC model.
a The flowchart of ABC model predicting functional variant in CRC tissues, which was created with BioRender.com. b Cumulative fractions of the number of enhancers predicted to regulate each gene (mean = 2.8). c Cumulative fractions of the number of genes regulated by each ABC enhancer (mean = 2.3). d Cumulative fractions of the genomic distances between the enhancer and the gene for each predicted enhancer-gene connection (median=48,375 bp). e Precision-recall plot of the accuracy for assigning genes to regulatory variants that predicted by ABC model or other previous predictions, considering a credible set consisting of 27 variant-gene connections which were validated by functional experiments. Recall indicated fraction of the variants identified, and precision indicated fraction of the target genes that was predicted. f Genomic annotation of ABC enhancers. Pie chart indicates the proportions of ABC enhancers annotated with each positional category. Upset plot displays the number of ABC enhancers between groups for each intersection. g Summary of ABC enhancers in CRC tissues. Plot included 124,474 non-promoter candidate elements in terms of ATAC peaks. The coloring of the heat map represented the fraction of elements in the corresponding distance and activity bins that are ABC enhancers. h Enrichment analyses of ABC variants in regulatory elements compared with non-ABC variants in CRC tissues. P-values were calculated by two-tailed Fisher’s exact test and bars indicate 95% confidence intervals (CIs). i Enrichment analyses of ABC variants in CRC GWAS signals (LD ≥ 0.2). P-values were calculated by two-tailed Fisher’s exact test and bars indicate 95% confidence intervals (CIs). j Enrichment analyses of CRC GWAS signals in ABC enhancers and other regulatory elements. Results were calculated by two-tailed Fisher’s exact test. Error bars represented the 95%CIs. k Quantile–quantile plot of CRC GWAS P values. ABC variants are shown in comparison with genome-wide variants. GWAS variants were binarily annotated using ABC variants. Source data are provided with this paper.
Fig. 4
Fig. 4. ABC variant rs4810856 acts as an allele-specific enhancer to promote PREX1, CSE1L and STAU1 expression.
a Manhattan plot for the associations between ABC variants and CRC risk in GECCO cohort. The P values (-log10) of the variants (y-axis) are presented according to chromosomal positions (x-axis, NCBI build 38). P < 0.05 was considered statistically significant (denoted by red line). b The ABC score of the variant-gene pairs associated with CRC risk. c eQTL analyses for the correlation between rs4810856 and the expression of target genes in our own CRC tissues (NCC = 63; NCT = 48; NTT = 19). The gene expression was normalized relative to GAPDH. The association between the genotype and gene expression was assessed using linear regression model. Data are shown as the median (minimum to maximum). d TAD overlaid with gene annotations surrounding rs4810856 from the Hi-C in HCT116 cells. e, f The relative luciferase activity in SW480 and HCT116 cells. Data were shown as the median (minimum to maximum), from three independent experiments with three technical replicates. ***P < 0.0001, **P < 0.001 were calculated by a two-sided Student’s t-test. g The rs4810856 [C] resides within ZEB1 binding motif predicted by JASPAR. h EMSAs of rs4810856 in SW480 cells. i ZEB1 super-shift EMSAs in SW480 cells. 1×, 2× and 4× represented 0.1 μg, 0.2 μg and 0.4 μg of ZEB1 antibody. j Chromatin enrichment of ZEB1 at the rs4810856 in SW480 cells. Data were presented as the median (minimum to maximum) and normalized to the input from three repeated experiments with three replicates. ***P < 0.0001 were calculated by a two-sided Student’s t-test. The effect of ZEB1 knockdown (k) or overexpression (l) on relative luciferase activity of vectors containing rs4810856 [C] or rs4810856 [T] allele in SW480 cells. The center line of the box presentation as the median, box limits indicated upper and lower quartiles, and whiskers indicated the maximum and minimum. ***P < 0.0001, **P < 0.001, *P < 0.01 were calculated by a two-sided Student’s t-test, from three independent experiments with three technical replicates. Source data are provided with this paper.
Fig. 5
Fig. 5. Direct effects of the ABC variant rs4810856 on ZEB1 affinity, target genes expression and cell proliferation.
CRISPR/Cas9 mediated single variant mutation of rs4810856 in SW480 and HCT116 cells. The genotype of rs4810856 was converted from CC to CT in SW480 cells (a), and from CT to TT in HCT116 cells (b). c Chromatin enrichment of ZEB1 at the rs4810856 in parental (SW480[CC] and HCT116[CT]) and mutated cells (SW480[CT] and HCT116[TT]). Data were presented as the median (minimum to maximum) and normalized to the input from three repeated experiments, each with three replicates. IgG served as negative control. ***P < 0.0001 were calculated by a two-sided Student’s t-test. d Expression of target genes in parental and mutated cells. Data were presented as the mean ± SEM of triplicate experiments, each with 3 technical replicates. ***P < 0.0001, **P < 0.001 were calculated by a two-sided Student’s t-test. e The effects of ZEB1 knockdown on target genes expression in parental and mutated cells. The center line of the box presentation as the median, box limits indicated upper and lower quartiles, and whiskers indicated the maximum and minimum. ***P < 0.0001, **P < 0.001 were calculated by a two-sided Student’s t-test, from three independent experiments with three technical replicates. f Enrichment quantification of allele-specific 3 C profiles in CRISPR/Cas9 editing cell lines with different rs4810856 genotypes depict the relative interaction frequencies between DNA fragment containing rs4810856 as the anchor and representative BssKI enzyme cutting sites indicated by dot plot. Data were shown as the mean ± SD of triplicate experiments. **P < 0.001, *P < 0.01 were calculated by a two-sided Student’s t-test. g The direct effect of rs4810856 genotype on cell proliferation. Results were shown as the means ± SEM from triplicate experiments. ***P < 0.0001, **P < 0.001 were calculated by a two-sided Student’s t-test. h The direct effect of rs4810856 genotype on colony formation ability. The results presented colony formation ability relative to control cells (set to 100%). Data were shown as the median (minimum to maximum) from triplicate experiments. ***P < 0.0001 were calculated by a two-sided Student’s t-test. Source data are provided with this paper.
Fig. 6
Fig. 6. PREX1, CSE1L and STAU1 exert synergistic effects to drive CRC development by activating p-AKT signaling pathway.
a The effects of target genes on cell proliferation in SW480 cells. Data were presented as mean values ± SEM from triplicate experiments. ***P < 0.0001, **P < 0.001 were calculated by a two-sided Student’s t-test. b The effects of target genes on colony formation ability in SW480 cells. The results presented colony formation ability relative to control cells (set to 100%). Data were shown as the median (minimum to maximum) from triplicate experiments. ***P < 0.0001 were calculated by a two-sided Student’s t-test. c The potential effects of target genes on proliferation of COLO678 cell line from CRISPR/Cas9-based loss-of-function screens. d The effects of target genes on growth of xenograft tumors in nude mice. Representative images, growth curves of xenograft tumors, H&E staining and immunohistochemical analysis derived from lentivirus-mediated SW480 cells were shown. The results were shown as the means ± SD for five mice per group. ***P < 0.0001, *P < 0.01 were calculated by a two-sided Student’s t-test. e Schematic of the RIP depicting the identification of target mRNAs binding with STAU1. f The target mRNAs binding selectively with STAU1 in SW480 cells. MACS2 were used for peak calling to obtain the enrichment fold change and P values for the mRNA associated with STAU1 binding. g STAU1 RIP coupled with qRT-PCR for PTEN mRNA in SW480 and HCT116 cells. Data were presented as the median (minimum to maximum) and normalized to the input from three repeated experiments with three replicates. ***P < 0.0001 were calculated by a two-sided Student’s t-test. h The effect of STAU1 overexpression on PTEN expression in SW480 and HCT116 cells. The center line of the box presentation as the median, box limits indicated upper and lower quartiles, and whiskers indicated the maximum and minimum. ***P < 0.0001 were calculated by a two-sided Student’s t-test, from three independent experiments with three technical replicates. i The effects of target gene on p-AKT signaling in both CRC cell lines by western blot. Source data are provided with this paper.
Fig. 7
Fig. 7. Graphical representation of the regulation mechanism underlying ABC variant rs4810856 and CRC risk.
Firstly, we leveraged ABC model to establish genome-wide regulatory maps genes across 20 cancer types by integrating large-scale multi-omics data including chromatin accessibility (ATAC-seq or DNase-seq), histone modifications (H3K27ac ChIP-seq), and chromatin interaction (Hi-C). We further characterized the functional characteristics of ABC variants based on genomic distribution, functional annotation and GWAS enrichment. Meanwhile, pathway analysis, mutation landscape, immune infiltration and drug response were integrated to the effects of ABC genes in tumorigenesis and clinical application. Mechanistically, we systematically screened ABC variants associated with CRC risk in 17,789 cases and 19,951 controls using GWAS chip data and independently validated in a large-scale population consisting of 6024 cases and 10,022 controls. We identified an ABC regulatory variant rs4810856 that is significantly associated with an increased risk of CRC (OR = 1.11, 95%CI = 1.05–1.16, P = 4.02×10⁻⁵). Mechanistically, the ABC variant acted as an allele-specific enhancer mediated by TF ZEB1 to distally facilitate expression of PREX1, CSE1L and STAU1, which synergistically activated p-AKT signaling to drive CRC cell proliferation. The graph was created with BioRender.com.

References

    1. Welter D, et al. The NHGRI GWAS Catalog, a curated resource of SNP-trait associations. Nucl. Acids Res. 2014;42:D1001–D1006. doi: 10.1093/nar/gkt1229. - DOI - PMC - PubMed
    1. Schaub MA, Boyle AP, Kundaje A, Batzoglou S, Snyder M. Linking disease associations with regulatory information in the human genome. Genome Res. 2012;22:1748–1759. doi: 10.1101/gr.136127.111. - DOI - PMC - PubMed
    1. Chang J, et al. Exome-wide analyses identify low-frequency variant in CYP26B1 and additional coding variants associated with esophageal squamous cell carcinoma. Nat. Genet. 2018;50:338–343. doi: 10.1038/s41588-018-0045-8. - DOI - PubMed
    1. Gasperini M, Tome JM, Shendure J. Towards a comprehensive catalogue of validated and target-linked human enhancers. Nat. Rev. Genet. 2020;21:292–310. doi: 10.1038/s41576-019-0209-0. - DOI - PMC - PubMed
    1. Khurana E, et al. Role of non-coding sequence variants in cancer. Nat. Rev. Genet. 2016;17:93–108. doi: 10.1038/nrg.2015.17. - DOI - PubMed

Publication types