. 2023 Sep 25;14(9):630.
doi: 10.1038/s41419-023-06117-z.

Identification of a miRNA multi-targeting therapeutic strategy in glioblastoma

Affiliations

Identification of a miRNA multi-targeting therapeutic strategy in glioblastoma

Arthur Bassot et al. Cell Death Dis. .

Abstract

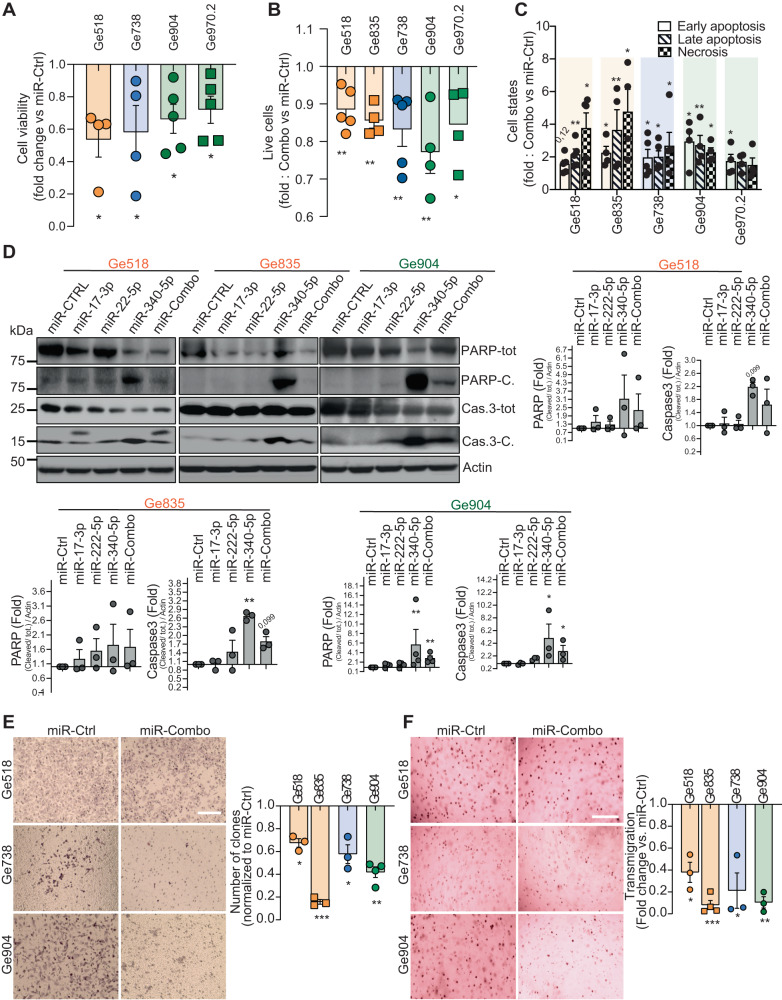
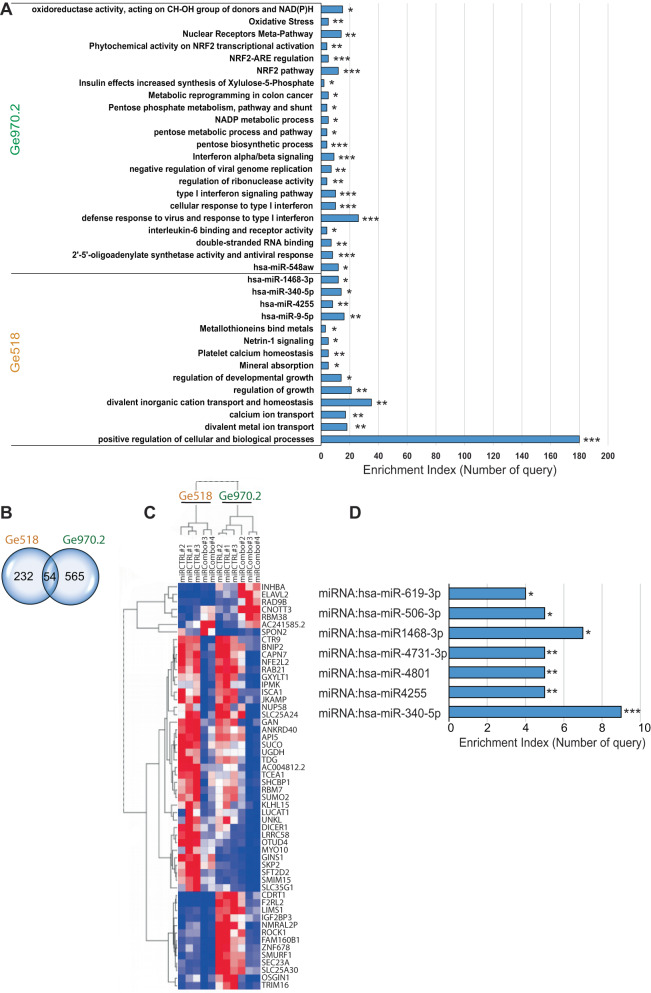
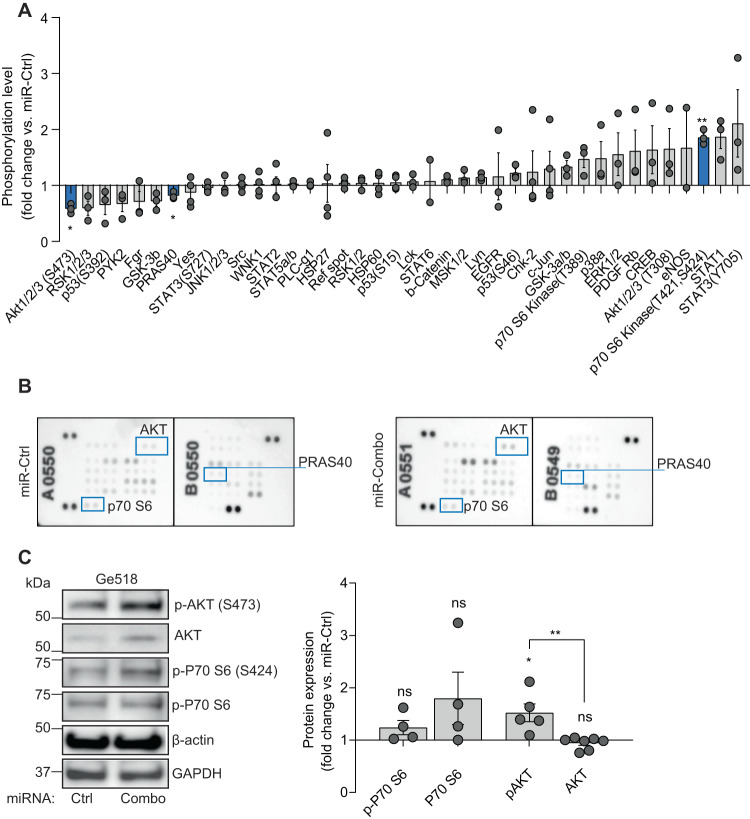
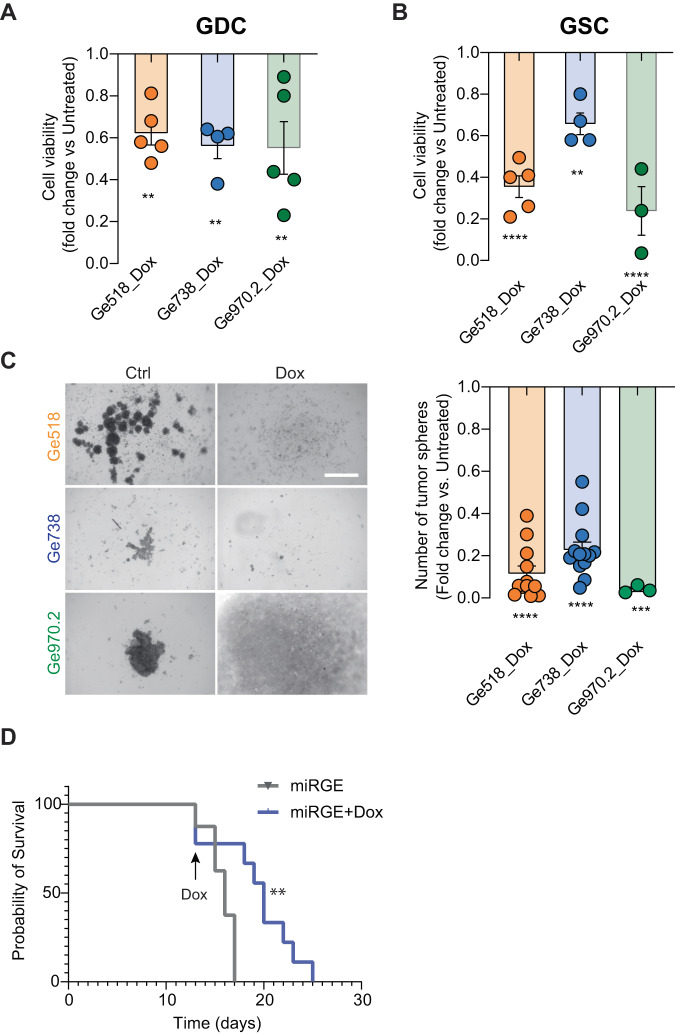
Glioblastoma (GBM) is a deadly and the most common primary brain tumor in adults. Due to their regulation of a high number of mRNA transcripts, microRNAs (miRNAs) are key molecules in the control of biological processes and are thereby promising therapeutic targets for GBM patients. In this regard, we recently reported miRNAs as strong modulators of GBM aggressiveness. Here, using an integrative and comprehensive analysis of the TCGA database and the transcriptome of GBM biopsies, we identified three critical and clinically relevant miRNAs for GBM, miR-17-3p, miR-222, and miR-340. In addition, we showed that the combinatorial modulation of three of these miRNAs efficiently inhibited several biological processes in patient-derived GBM cells of all these three GBM subtypes (Mesenchymal, Proneural, Classical), induced cell death, and delayed tumor growth in a mouse tumor model. Finally, in a doxycycline-inducible model, we observed a significant inhibition of GBM stem cell viability and a significant delay of orthotopic tumor growth. Collectively, our results reveal, for the first time, the potential of miR-17-3p, miR-222 and miR-340 multi-targeting as a promising therapeutic strategy for GBM patients.


Conflict of interest statement

The authors declare no competing interests.

Figures

Fig. 1
Fig. 1. TCGA analysis reveals miR-17-3p, miR-222, miR-340 and miR551b as the four miRNAs for which expression is consistently correlated with poor survival regardless of disease stage, patient age, gender, mutations, treatment.
A Kaplan–Meier analysis of TCGA dataset for miR-17-3p expression (median = 8.364, mean = 7.969; SD = 1.047, n = 53 miR-17-3plow, n = 55 miR-17-3phigh; Chi2 = 8.7 on 1 degree of freedom). B Kaplan–Meier analysis of TCGA dataset for miR-340 expression (median = 6.992, mean = 6.717; SD = 0.686, n = 50 miR-340low, n = 56 miR340high; Chi2 = 10.4 on 1 degree of freedom). C Kaplan–Meier analysis of TCGA dataset for miR-551b expression (median = 6.720, mean = 7.310; SD = 1.038, n = 68 miR-551blow, n = 67 miR-551bhigh; Chi2 = 7.3 on 1 degree of freedom). D Kaplan–Meier analysis of TCGA dataset for miR-222 expression (median = 8.325, mean = 9.446; SD = 2.066, n = 70 miR-222low, n = 65 miR-222high; Chi2 = 10.3 on 1 degree of freedom).
Fig. 2
Fig. 2. MiR-17-3p, -340, and -222 modulate GBM cell survival, clonogenicity, and transmigration.
A Cell viability of Ge518, Ge738, Ge904 and Ge970.2 transiently transfected with nontargeting scrambled control or mimics of miR-340, -17-3p, 551b and -222 antagomir was evaluated after three or four days using CellTiter-Glo. Histograms represent the fold change of cell survival for the miR-Combo versus the miR-Ctrl (n = 4–5). B Histograms represent the fold change of live cells in GDCs transiently transfected with nontargeting scrambled control or miR-Combo evaluated by flow cytometry with Annexin V/PI staining (n = 3–4). C Histograms represent the fold change of early and late apoptosis and necrosis in GDCs transiently transfected with non-targeting scrambled control or miR-Combo assessed by flow cytometry with Annexin V/PI staining. D Protein expression was determined by western blot in Ge518, Ge835 and Ge904 transfected with non-targeting scrambled control or miR-Combo. Histogram represents the fold change of protein expression quantified by using ImageJ (n = 4). Data are represented as mean ± SEM (*p < 0.05, **p < 0.01), ns non-significant. E Clonogenicity of Ge518, Ge738, Ge904 and Ge970.2 transiently transfected with nontargeting scrambled control or mimics of miR-340, -17-3p, and -222 antagomir was determined using the clonogenic assay. Representative pictures of 3–4 independent experiments. Histograms represent the fold change of clones formed in for miR-Combo versus the miR-Ctrl condition. Scale bar = 10 µm. F Transmigration of Ge518, Ge738, Ge904 and Ge970.2 transiently transfected with nontargeting scrambled control or mimics of miR-340, -17-3p, and -222 antagomir was determined using transwell plates. Representative pictures of 3 independent experiments. Histograms represent the fold change of transmigrated cells through the transwell for the miR-Combo versus the miR-Ctrl condition. Scale bar = 10 µm. Data are represented as mean ± SEM (*p < 0.05, **p < 0.01 and ***p < 0.001), ns non-significant.
Fig. 3
Fig. 3. The combinatorial modulation of miR-340, -17-3p, and -222 regulated genes involved in several biological processes and metabolic pathways.
A Functional annotation clustering of gene set enrichment analysis showing Ge518 and Ge970.2 transfected with a non-targeting scrambled control or the combinatorial modulation of miR-340, -17-3p, and -222. Histograms show the number of query enriched for each family of genes from g:Profiler analysis. B Venn diagram of comparisons between Ge518 and Ge970.2 transfected with a nontargeting scrambled control or the combinatorial modulation of miR-340, -17-3p and -222. C Hierarchical clustering of Ge518 and Ge970.2 miR-Ctrl vs. miR-Combo based on the differentially expressed genes. D Functional annotation clustering of gene set enrichment analysis comparing Ge518 and Ge970.2 transfected with a non-targeting scrambled control or the combinatorial modulation of miR-340, -17-3p and -222. Histograms show the number of queries enriched for each family of genes from g:Profiler analysis. Data are represented as mean ± SEM (*p < 0.05, **p < 0.01 and ***p < 0.001).
Fig. 4
Fig. 4. The combinatorial modulation of miR-340, -17-3p and -222 induces a decrease of AKT signaling pathway in GBM PDCs.
A The human phospho-kinase array shows the relative expression of phosphorylation profiles of several kinases and their protein substrates. Representative pictures of 3 independent experiments. Histograms represent the fold change of each kinase for the miR-Combo versus the miR-Ctrl condition. B The human phospho-kinase array shows the relative expression of phosphorylation profiles of several kinases and their protein substrates. Representative pictures of 3 independent experiments. C Protein expression was determined by western blot in Ge518 transfected with non-targeting scrambled control or miR-Combo. Histogram represents the fold change of protein expression quantified by using ImageJ (n = 4). Data are represented as mean ± SEM (**p < 0.01), ns non-significant.
Fig. 5
Fig. 5. GBM PDC invasion in neural organoids is reduced by the combinatorial modulation of miR-17-3p, miR-222, and miR-340.
AD Schematic representation of PSC differentiation towards neural organoids. PSC were cultured on Matrigel (A) then aggregated in microwell plates (B) for 3 weeks (C). D Schematic representation of the culture principle for neural organoids. E Immunofluorescence shows NeuN, βIII-Tubulin, GFAP, and MAP2-immunoreactive cells present in the neural organoids. Scale bar = 100 µm. F GAD67, Musashi, Nestin (NES), OLIG2, PSD95, S100B, SOX2 and βIII-Tubulin (TUBB3) mRNA expression was determined by qPCR in the neural organoids before coculturing with GSC Ge904. Data are normalized to housekeeping genes; mean (n = 4) ± SEM. G Immunofluorescence shows GFAP, and βIII-Tubulin-immunoreactive cells present in the co-culture of GSC Ge904 and neural organoids. Scale bar = 100 µm. Histograms represent the invasive score of the GBM cells within the neural organoid. H Immunofluorescence shows Ki-67, and βIII-Tubulin-immunoreactive cells present in the neural organoids. Scale bar = 100 µm. Histograms represent the proliferative score of the GBM cells within the neural organoid. Data are represented as mean ± SEM (*p < 0.05, and **p < 0.01). Representative images of three separate experiments are shown.
Fig. 6
Fig. 6. Repeated injection of miR-Combo delays tumor growth in nude mice.
A Effect of the combinatorial modulation of miR-17-3p, miR-222, and miR-340 on Ge518 tumor growth in vivo (n = 5 mice per group). B Histological analysis of Ge518 tumor treated with miR-Combo. Tumors were stained for the identified proteins, and counterstained with hematoxylin. Scale bar, 50 µm. C Histogram represents the fold change of protein expression quantified by using ImageJ (n = 3). Data are represented as mean ± SEM (**p < 0.01), ns non-significant. D Protein expression was determined by western blot in Ge518 transfected with non-targeting scrambled control or miR-Combo. Histogram represents the fold change of protein expression quantified by using ImageJ (n = 3–4). Data are represented as mean ± SEM (*p  < 0.05, **p < 0.01), ns non-significant. E Effect of the combinatorial modulation of miR-17-3p, miR-222, and miR-340 on Ge738 tumor growth in vivo (n = 5 mice per group).
Fig. 7
Fig. 7. GSC bearing a stable doxycycline-inducible lentivector system expressing miR-17-3p, miR-222, and miR-340 induces a decrease of cell viability and delay tumor growth in vivo.
A Cell viability of Ge518, Ge738, and Ge970.2 PDCs expressing miRGE was evaluated after three days using CellTiter-Glo. Histograms represent the fold change of cell survival for the miRGE treated with doxycycline (Dox) versus untreated. B Cell viability of Ge518, Ge738, and Ge970.2 GSCs expressing miRGE was evaluated after three days using CellTiter-Glo. Histograms represent the fold change of cell survival for the miRGE treated with Dox versus untreated. C Representative pictures of 3–7 independent experiments. The bar graph represents the fold change of GSC miRGE treated with Dox versus untreated. Data are represented as mean ± SEM (**p < 0.01, ***p < 0.001 and ****p < 0.0001). D Effect of miRGE expression turned on by Dox treatment on tumor growth in vivo: a mixture of Ge518, Ge738, and Ge970.2 GSCs (1:1:1) bearing the inducible Tet-On system was intracranially injected into the brain of nude mice (n = 8 mice in the treated group; n = 7 mice in the untreated group). Log-rank Mantel–Cox test was used to calculate significance.

References

    1. Louis DN, Ohgaki H, Wiestler OD, Cavenee WK, Burger PC, Jouvet A, et al. The 2007 WHO classification of tumours of the central nervous system. Acta Neuropathol. 2007;114:97–109. doi: 10.1007/s00401-007-0243-4. - DOI - PMC - PubMed
    1. Stupp R, Mason WP, van den Bent MJ, Weller M, Fisher B, Taphoorn MJ, et al. Radiotherapy plus concomitant and adjuvant temozolomide for glioblastoma. N Engl J Med. 2005;352:987–96. doi: 10.1056/NEJMoa043330. - DOI - PubMed
    1. Verhaak RG, Hoadley KA, Purdom E, Wang V, Qi Y, Wilkerson MD, et al. Integrated genomic analysis identifies clinically relevant subtypes of glioblastoma characterized by abnormalities in PDGFRA, IDH1, EGFR, and NF1. Cancer Cell. 2010;17:98–110. doi: 10.1016/j.ccr.2009.12.020. - DOI - PMC - PubMed
    1. Brennan CW, Verhaak RG, McKenna A, Campos B, Noushmehr H, Salama SR, et al. The somatic genomic landscape of glioblastoma. Cell. 2013;155:462–77. doi: 10.1016/j.cell.2013.09.034. - DOI - PMC - PubMed
    1. Freije WA, Castro-Vargas FE, Fang Z, Horvath S, Cloughesy T, Liau LM, et al. Gene expression profiling of gliomas strongly predicts survival. Cancer Res. 2004;64:6503–10. doi: 10.1158/0008-5472.CAN-04-0452. - DOI - PubMed

Publication types