. 2023 Sep 25;6(1):980.
doi: 10.1038/s42003-023-05368-y.

In vivo label-free optical signatures of chemotherapy response in human pancreatic ductal adenocarcinoma patient-derived xenografts

Affiliations

In vivo label-free optical signatures of chemotherapy response in human pancreatic ductal adenocarcinoma patient-derived xenografts

Jaena Park et al. Commun Biol. .

Abstract

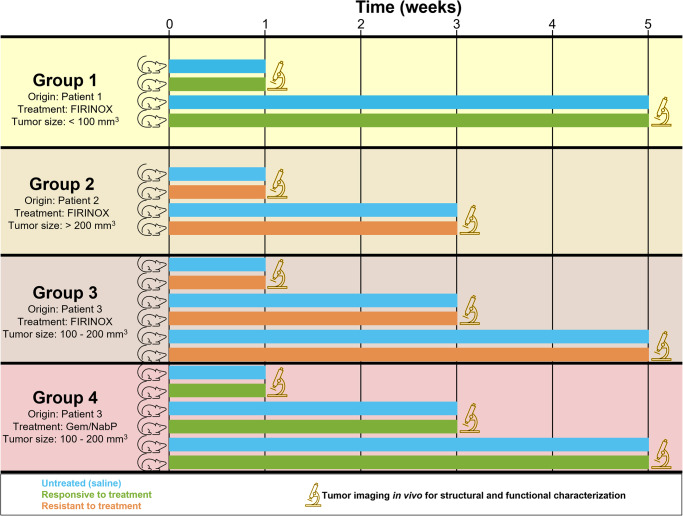
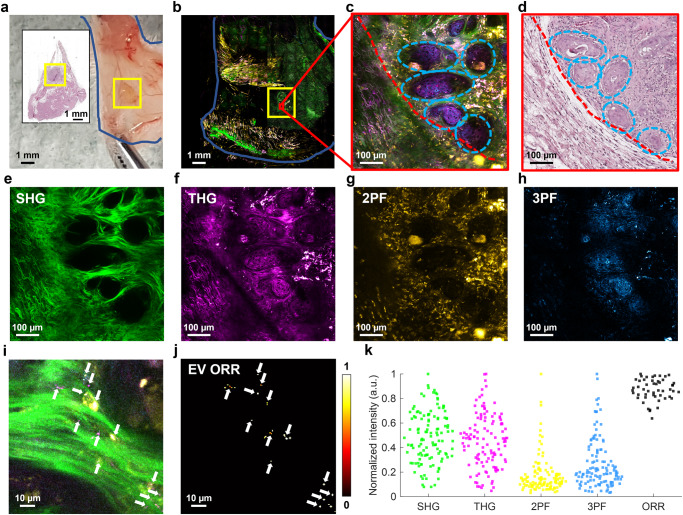
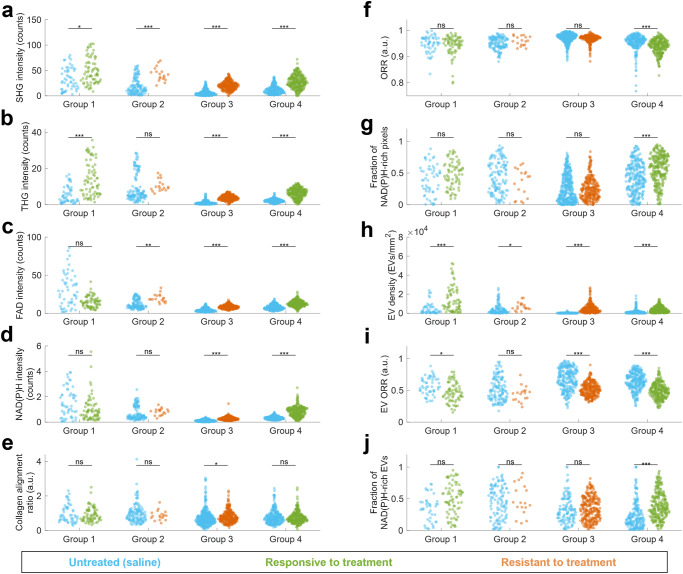
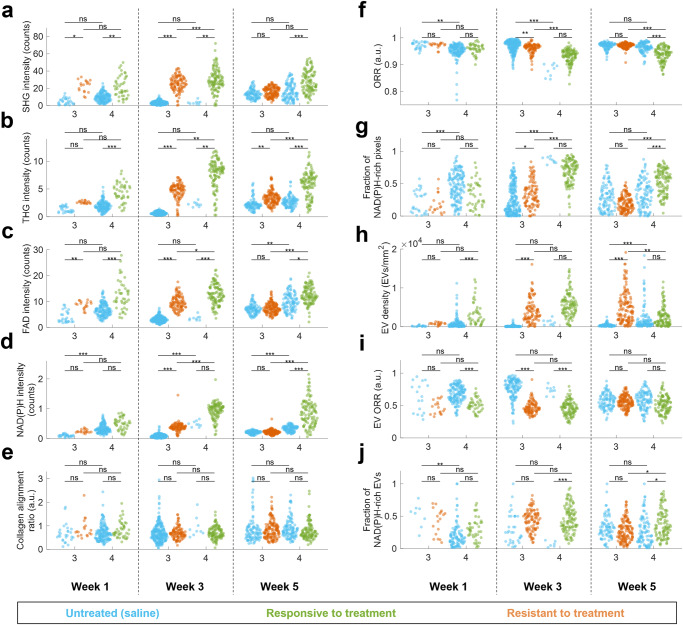
Pancreatic cancer is a devastating disease often detected at later stages, necessitating swift and effective chemotherapy treatment. However, chemoresistance is common and its mechanisms are poorly understood. Here, label-free multi-modal nonlinear optical microscopy was applied to study microstructural and functional features of pancreatic tumors in vivo to monitor inter- and intra-tumor heterogeneity and treatment response. Patient-derived xenografts with human pancreatic ductal adenocarcinoma were implanted into mice and characterized over five weeks of intraperitoneal chemotherapy (FIRINOX or Gem/NabP) with known responsiveness/resistance. Resistant and responsive tumors exhibited a similar initial metabolic response, but by week 5 the resistant tumor deviated significantly from the responsive tumor, indicating that a representative response may take up to five weeks to appear. This biphasic metabolic response in a chemoresistant tumor reveals the possibility of intra-tumor spatiotemporal heterogeneity of drug responsiveness. These results, though limited by small sample size, suggest the possibility for further work characterizing chemoresistance mechanisms using nonlinear optical microscopy.


Conflict of interest statement

The authors declare no competing interests.

Figures

Fig. 1
Fig. 1. Schematic of study design to examine the feasibility of SLAM microscopy to observe and characterize PDAC tumors in PDX mice treated with two different chemotherapy regimens to which it is responsive or resistant.
Four different groups were examined with various combinations of tumor origin, chemotherapy treatment, and starting tumor size. Once tumors reached the starting size, chemotherapy regimens were administered until the predetermined timepoint for in vivo imaging. A total of 20 mice were used; one mouse was examined for each combination of timepoint (1 week, 3 weeks, or 5 weeks), treatment (saline injections for untreated control or chemotherapy treatment), and group (1, 2, 3, or 4).
Fig. 2
Fig. 2. Qualitative and quantitative in vivo imaging of PDAC tumor in PDX mouse using SLAM microscopy.
Example data is from a tumor responsive to FIRINOX (group 1) after 1 week of treatment. a Skin flap outlined in blue and approximate tumor in the yellow box. Inset is an H&E-stained histology image of the corresponding skin flap. b Large-area mosaic SLAM image of the skin flap in (a) with approximate tumor area located in yellow box. c Example FOV within the tumor from the red box in (b). The tumor margin is indicated with a red dashed line. The light blue dashed circles show clusters of cancer cells. d H&E-stained histology image of (c). e SHG, (f) THG, (g) 2PF, and (h) 3PF individual SLAM channels from (c). i Zoomed in the area from the central region of (c), with visible EVs indicated by small bright spots in the THG channel and annotated with white arrows. j EV segmentation mask, which enables quantification of EV density, EV ORR, and a fraction of NAD(P)H-rich EVs. k Example quantification of image channels and ORR from (c), with each point representing a 100×100 μm2 region within the tumor images.
Fig. 3
Fig. 3. Structural and functional analysis of PDAC tumor response to chemotherapy treatment for all groups.
All mosaic images were divided into tiles of 600×600 pixels (300×300 μm2), all timepoints were pooled together, and the following image metrics were computed for each tile: a SHG mean intensity in photon counts per pixel, b THG mean intensity in photon counts per pixel, c 2PF FAD mean intensity in photon counts per pixel, d 3PF NAD(P)H mean intensity in photon counts per pixel, e collagen alignment ratio computer from Fourier analysis of SHG channel, f mean optical redox ratio (ORR) of segmented tumor region within tile, g fraction of NAD(P)H-rich pixels of segmented tumor region within tile, defined as pixels with ORR < 0.8, h segmented EV density in EVs/mm2, i mean EV ORR, j fraction of NAD(P)H-rich EVs, defined as the fraction of EVs within the tile with ORR < 0.8. For groups 1 and 2, n = 2 mice; for groups 3 and 4, n = 3 mice. ns: not significant; *: p < 0.05; **p < 0.01; ***p < 0.001.
Fig. 4
Fig. 4. Structural and functional analysis of PDAC tumor response to chemotherapy treatment for responsive (group 4) and resistant (group 3) over five weeks of treatment.
All mosaic images were divided into tiles of 600×600 pixels (300×300 μm2) and the following image metrics were computed for each tile: a SHG mean intensity in photon counts per pixel, b THG mean intensity in photon counts per pixel, c 2PF FAD mean intensity in photon counts per pixel, d 3PF NAD(P)H mean intensity in photon counts per pixel, e collagen alignment ratio computer from Fourier analysis of SHG channel, f mean optical redox ratio (ORR) of segmented tumor region within tile, g fraction of NAD(P)H-rich pixels of segmented tumor region within tile, defined as pixels with ORR < 0.8, h segmented EV density in EVs/mm2, i mean EV ORR, j fraction of NAD(P)H-rich EVs, defined as the fraction of EVs within the tile with ORR < 0.8. For each timepoint, group, and treatment, n = 1 mouse. ns: not significant; *: p < 0.05; **p < 0.01; ***p < 0.001.

References

    1. Siegel RL, Miller KD, Fuchs HE, Jemal A. Cancer statistics, 2022. CA Cancer J. Clin. 2022;72:7–33. - PubMed
    1. Ansari D, et al. Pancreatic cancer: Yesterday, today and tomorrow. Future Oncol. 2016;12:1929–1946. - PubMed
    1. Binenbaum Y, Na’ara S, Gil Z. Gemcitabine resistance in pancreatic ductal adenocarcinoma. Drug Resist. Updat. 2015;23:55–68. - PubMed
    1. Kim MP, Gallick GE. Gemcitabine resistance in pancreatic cancer: picking the key players. Clin. Cancer Res. 2008;14:1284–1285. - PubMed
    1. Narayanan S, Vicent S, Ponz-Sarvisé M. PDAC as an immune evasive disease: Can 3D model systems aid to tackle this clinical problem? Front. Cell Dev. Biol. 2021;9:787249. - PMC - PubMed

Publication types