. 2023 Sep 25;13(1):15975.
doi: 10.1038/s41598-023-42742-6.

Genomic characterization of rare earth binding by Shewanella oneidensis

Affiliations

Genomic characterization of rare earth binding by Shewanella oneidensis

Sean Medin et al. Sci Rep. .

Abstract

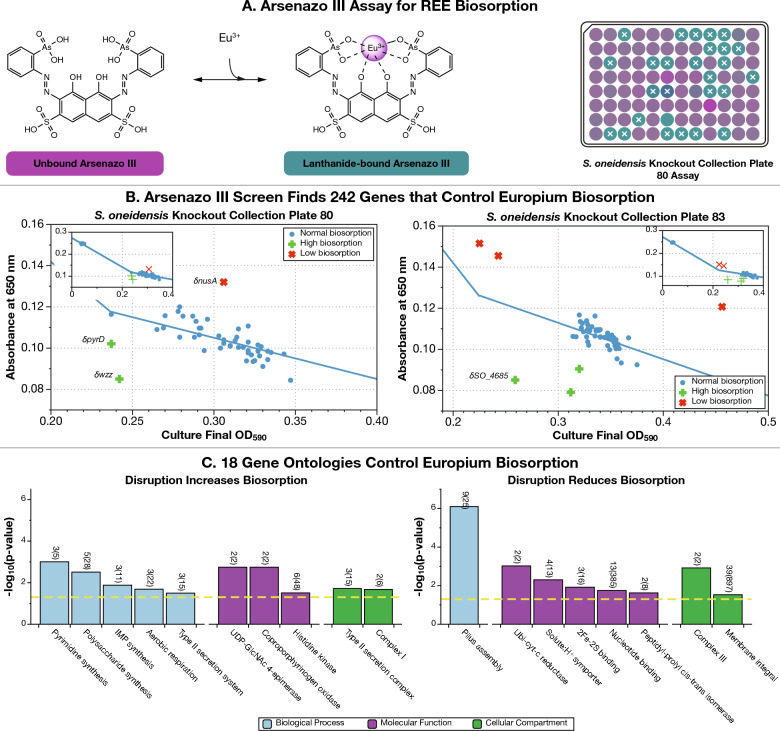
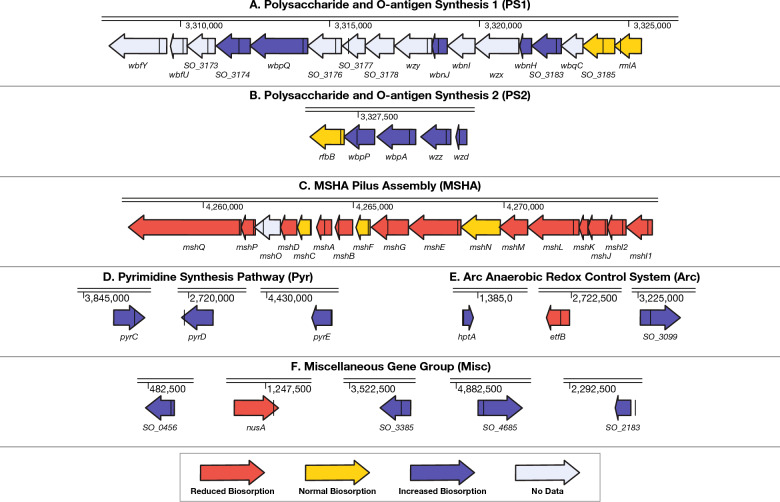
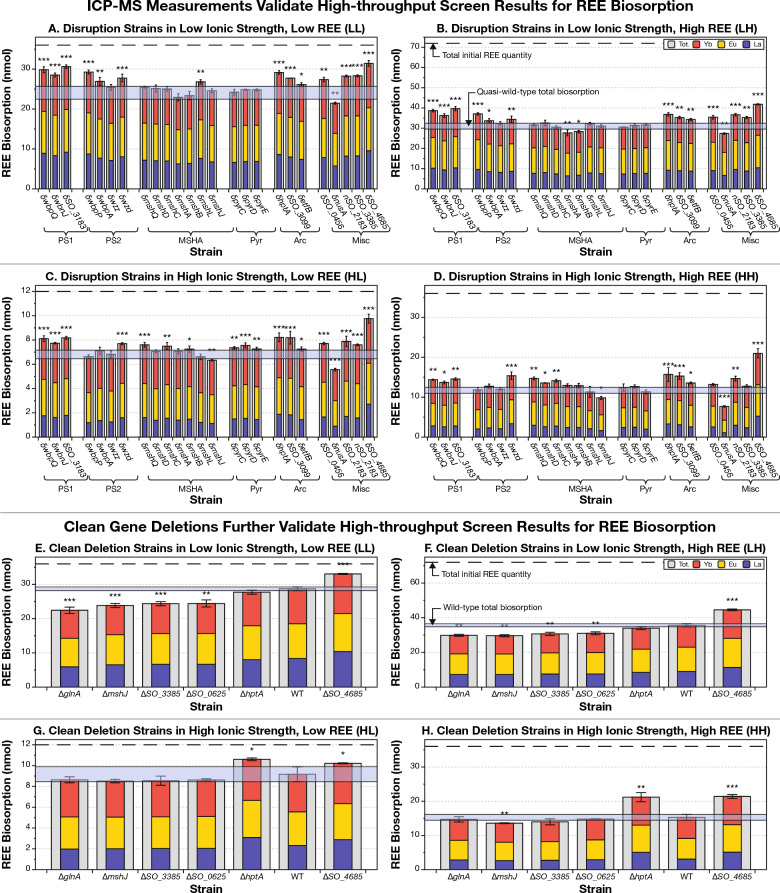
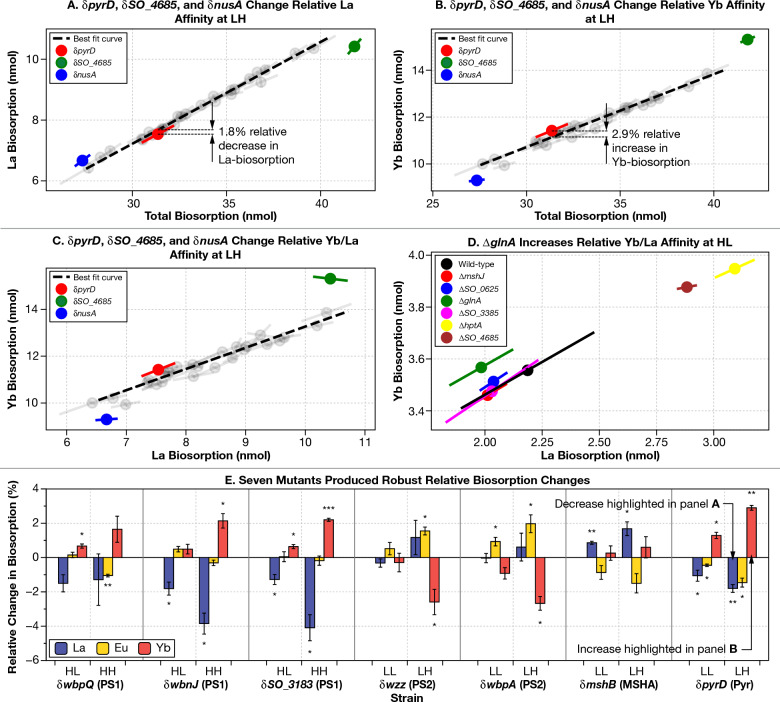
Rare earth elements (REE) are essential ingredients of sustainable energy technologies, but separation of individual REE is one of the hardest problems in chemistry today. Biosorption, where molecules adsorb to the surface of biological materials, offers a sustainable alternative to environmentally harmful solvent extractions currently used for separation of rare earth elements (REE). The REE-biosorption capability of some microorganisms allows for REE separations that, under specialized conditions, are already competitive with solvent extractions, suggesting that genetic engineering could allow it to leapfrog existing technologies. To identify targets for genomic improvement we screened 3,373 mutants from the whole genome knockout collection of the known REE-biosorbing microorganism Shewanella oneidensis MR-1. We found 130 genes that increased biosorption of the middle REE europium, and 112 that reduced it. We verified biosorption changes from the screen for a mixed solution of three REE (La, Eu, Yb) using Inductively Coupled Plasma Mass Spectrometry (ICP-MS) in solution conditions with a range of ionic strengths and REE concentrations. We identified 18 gene ontologies and 13 gene operons that make up key systems that affect biosorption. We found, among other things, that disruptions of a key regulatory component of the arc system (hptA), which regulates cellular response to anoxic environments and polysaccharide biosynthesis related genes (wbpQ, wbnJ, SO_3183) consistently increase biosorption across all our solution conditions. Our largest total biosorption change comes from our SO_4685, a capsular polysaccharide (CPS) synthesis gene, disruption of which results in an up to 79% increase in biosorption; and nusA, a transcriptional termination/anti-termination protein, disruption of which results in an up to 35% decrease in biosorption. Knockouts of glnA, pyrD, and SO_3183 produce small but significant increases (≈ 1%) in relative biosorption affinity for ytterbium over lanthanum in multiple solution conditions tested, while many other genes we explored have more complex binding affinity changes. Modeling suggests that while these changes to lanthanide biosorption selectivity are small, they could already reduce the length of repeated enrichment process by up to 27%. This broad exploratory study begins to elucidate how genetics affect REE-biosorption by S. oneidensis, suggests new areas of investigation for better mechanistic understanding of the membrane chemistry involved in REE binding, and offer potential targets for improving biosorption and separation of REE by genetic engineering.


Conflict of interest statement

The authors are pursuing patent protection for engineered organisms using knowledge gathered in this work (US provisional patent Application no. 63/405353). A.M.S. and S.M. are co-founders of, and B.B. is a contributor, and uncompensated advisor to, REEgen, Inc., which is developing genetically engineered microbes for REE bio-mining. The remaining authors have competing interests to declare.

Figures

Figure 1
Figure 1
Screening the Shewanella oneidensis whole genome knockout collection finds 242 genes representing 18 gene ontologies that control Eu-biosorption. We used the Arsenazo III (As-III) competitive assay for europium- (Eu-) binding to screen 3,373 unique members of the S. oneidensis whole genome knockout collection to identify mutants with modified REE-biosorption capability. (A) Unbound As-III absorbance peaks at ≈ 530 nm (resulting in a cyan color), while Eu-bound As-III (proposed structure) absorbance peaks at ≈ 650 nm (purple). Right panel shows a computer-generated image of a sample assay plate derived from spectroscopic data. Higher biosorption by S. oneidensis results in a lower concentration of Eu-As-III and hence lower 650 nm absorption (the well will be more purple-colored) while lower biosorption results in a higher concentration of Eu-As-III (the well will be more cyan-colored). Additional information on the high-throughput screen is presented in Online Methods and Fig. S1. (B) The As-III screen found 242 genes that control Eu-biosorption (Dataset S1). The largest source of Eu-biosorption variability in the screen is due to bacterial density differences between mutants. For most mutants, the optical density of the culture at the start of the biosorption screen will map onto As-III absorption at 650 nm by a linear piecewise function (shown as a blue solid line). Mutants shown as red diagonal crosses had significantly less biosorption than the plate average. Mutants shown as green horizontal crosses had significantly higher biosorption than the plate average (mutants shown as blue dots are not significantly different from the average). (C) Gene ontology enrichment analysis found that 18 ontologies were enriched with mutants discovered by the As-III screen. The yellow dotted line indicates a p-value of 0.05. We only show results with p-values below 0.05 and gene ontologies with > 1 representative mutant. Numbers above each bar indicate the number of significant biosorption genes within each ontology in the screen results relative to the number in the S. oneidensis genome. Precise definitions of each gene ontology are shown in Dataset S2. IMP: inosine 5ʹ-monophosphate; UDP-GlcNAc 4-epimerase: UDP-N-acetylglucosamine 4-epimerase; Ubi-cyt-c reductase: ubiquinol-cytochrome-c reductase.
Figure 2
Figure 2
Operon enrichment, ontology enrichment, and regulatory analyses pinpoint 6 groups of genes that influence multiple mechanisms behind Eu-biosorption by S. oneidensis. (AC) The results of the high-throughput Eu-biosorption screen (Dataset S1) of the S. oneidensis knockout collection were analyzed to find operons with statistically-significant enrichments of hits (Dataset S3). The location of the transposon disruption in each gene is marked as a black line. Here we show three operons that are the most statistically-significant results of this analysis. (D) The pyrimidine synthesis pathway was selected by ontology enrichment analysis (Dataset S2). (E) One gene involved in the Anaerobic Redox Control (Arc) regulatory system (hptA), as well as two genes regulated by Arc whose knockouts produced differential biosorption were also selected for further analysis. (F) Finally, five genes whose knockouts produced some of the largest changes to Eu-biosorption were also selected for further analysis.
Figure 3
Figure 3
ICP-MS measurements validate the results of high-throughput Eu-biosorption screening in up to 79% of cases. Bar plots show levels of lanthanum (blue), europium (yellow), ytterbium (red), and total REE (grey) biosorption for each strain. The error bar indicates the standard deviation on the total biosorption of three biological replicates. The number of stars above each bar indicates the statistical significance of the measurement difference from quasi-wild-type (AD) and wild-type (EH): *: p-value < 0.05; **: p-value < 0.01; ***: p-value < 0.001. δ indicates a transposon insertion mutant (in panels A to D), while Δ indicates a clean deletion mutant (in panels EH). Note the nSO_2183 mutant which indicates that the transposon is near to, but not within SO_2183. Cross-checks of As-III Eu-biosorption assay and ICP-MS measurements with transposon mutants are shown in Table S2. (A) The low ionic strength, low initial REE concentration environment matches 53% of the As-III screen (Table S2). (B) The low ionic strength, high initial REE concentration environment (LH) recapitulates the highest percentage (63%) of results of the As-III screen. (C) The high ionic strength, low REE environment (HL) reproduces 63% of significant changes to biosorption. (D) The high ionic strength, high initial REE environment reproduces the smallest number (42%) of results from the As-III screen. (EH). Clean deletion mutants replicated at least some of the results of transposon mutant measurements in three of four cases.
Figure 4
Figure 4
Nine gene disruption mutants make notable changes to REE-biosorption selectivity. (A to C) For most transposon insertion mutants (including those with modified total REE biosorption), under most of the four solution conditions tested, individual REE biosorption is linearly related to total biosorption or individual biosorption of either of the other 2 REE tested (grey circles, and the black dashed fit lines in panels AC) over a finite range of REE biosorption (note the finite extend of dashed black lines in panels AC). (AD) Individual points indicate the mean values of the mutants and the error bars show the standard deviation along the axis of maximal variation. (AC) We highlight changes in La and Yb affinity for δpyrD in the LH environment as well as two mutants (δnusA and δSO_4685) who’s total biosorption was too small (δnusA) or large (δSO_4685) to compare to our finite line of best fit, yet nonetheless clearly had different La and Yb affinity relative to the other mutants. In particular, note how both δnusA and δSO_4685 have similar La biosorption to other mutants in (C) yet had very different Yb biosorption. (D) We had insufficient data to perform a line of best fit on our clean gene deletion data, yet it is clear from this plot that the glnA deletion has an increase in relative Yb/La affinity. (E) Here, we display all our mutants with robust biosorption changes (mutants that enhanced or decreased relative biosorption in multiple environments, or when a particular REE had enhanced or lowered relative biosorption in more than half the genes in a particular group of interest). The number of stars above or below each bar indicates the statistical significance of the measurement difference from quasi-wild-type: *: p-value < 0.05; **: p-value < 0.01; ***: p-value < 0.001. δ indicates a transposon insertion mutant, Δ indicates a clean deletion mutant. Error bars indicate standard deviation of three biological replicates. PS1 and 2 Polysaccharide Synthesis 1 and 2; MSHA MSHA Pilus Assembly; Pyr Pyrimidine Synthesis.

Similar articles

Cited by

References

    1. Dent PC. Rare earth elements and permanent magnets. J. Appl. Phys. 2012;111:07A721. doi: 10.1063/1.3676616. - DOI
    1. Lucas J, Lucas P, Le Mercier T, Rollat A, Davenport W. Rare Earths: Science, Technology, Production and Use. Elsevier Inc.; 2014.
    1. Schubert EF, Kim JK. Solid-state light sources getting smart. Science. 2005;308:1274–1278. doi: 10.1126/science.1108712. - DOI - PubMed
    1. Norman AF, Prangnell PB, McEwen RS. The solidification behaviour of dilute aluminium–scandium alloys. Acta Mater. 1998;46:5715–5732. doi: 10.1016/s1359-6454(98)00257-2. - DOI
    1. Adesina O, Anzai IA, Avalos JL, Barstow B. Embracing biological solutions to the sustainable energy challenge. Chemistry. 2017;2:20–51. doi: 10.1016/j.chempr.2016.12.009. - DOI

Publication types

Supplementary concepts