. 2023 Oct;25(10):1478-1494.
doi: 10.1038/s41556-023-01225-6. Epub 2023 Sep 25.

Iron drives anabolic metabolism through active histone demethylation and mTORC1

Affiliations

Iron drives anabolic metabolism through active histone demethylation and mTORC1

Jason S Shapiro et al. Nat Cell Biol. 2023 Oct.

Abstract

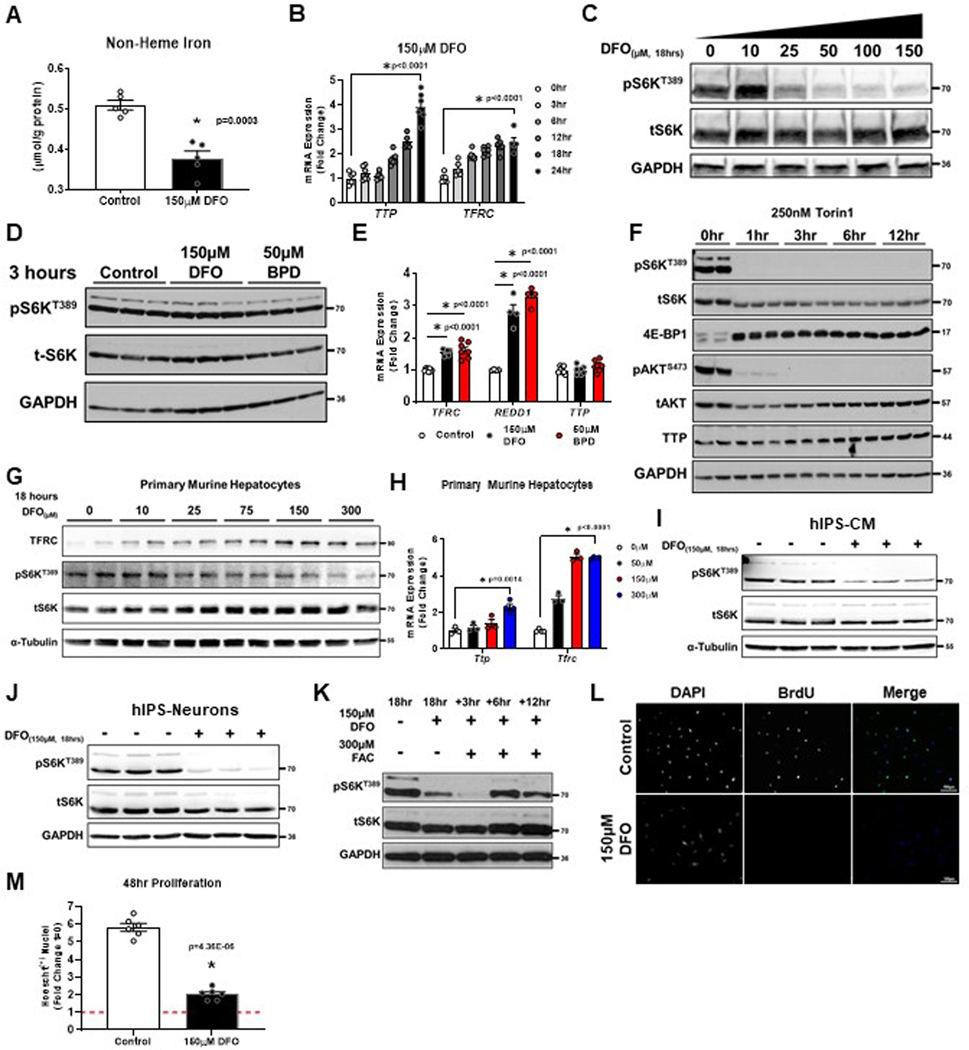
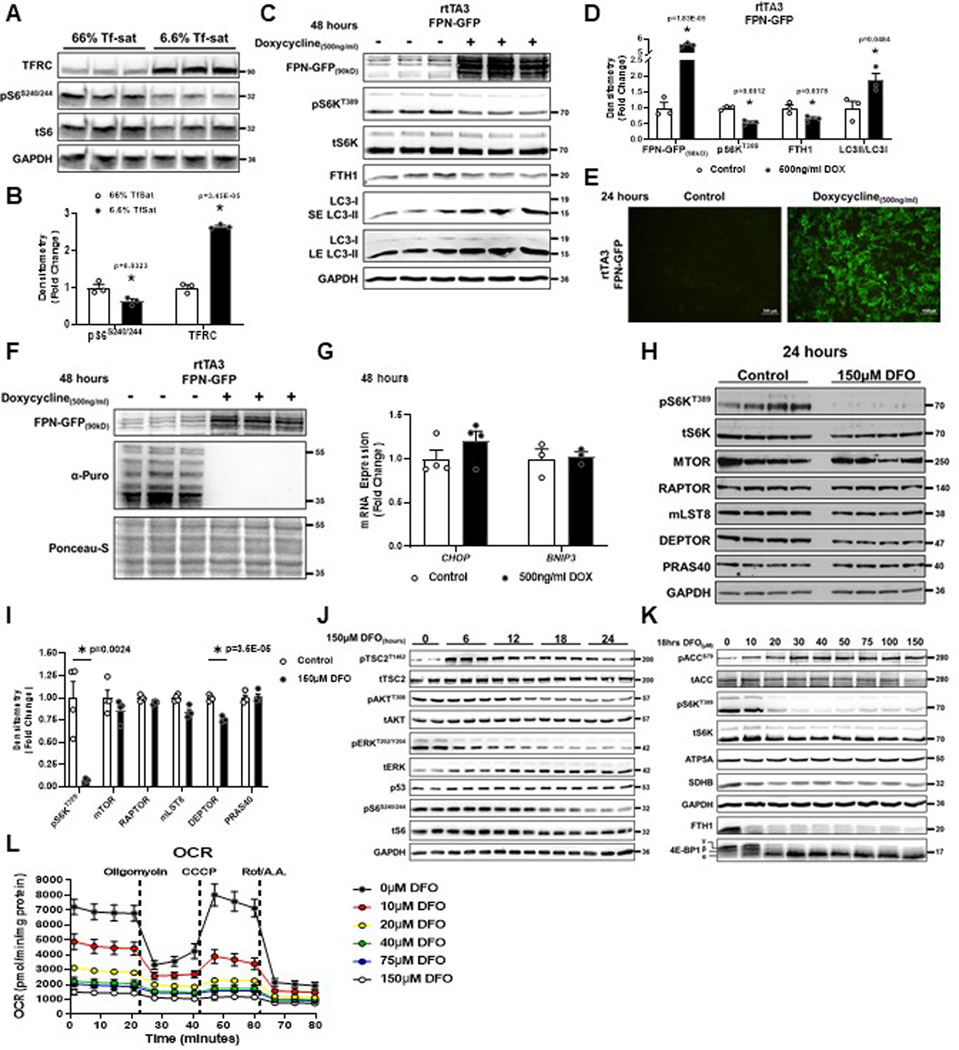
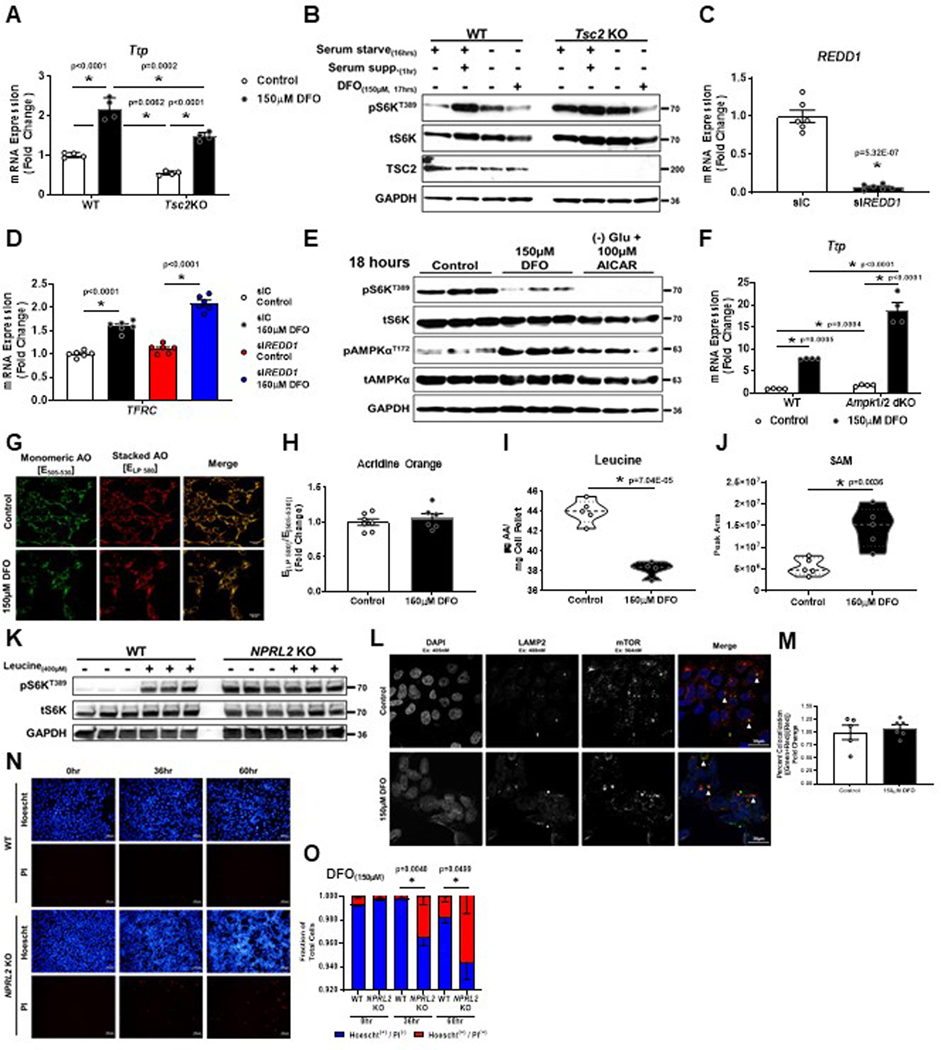
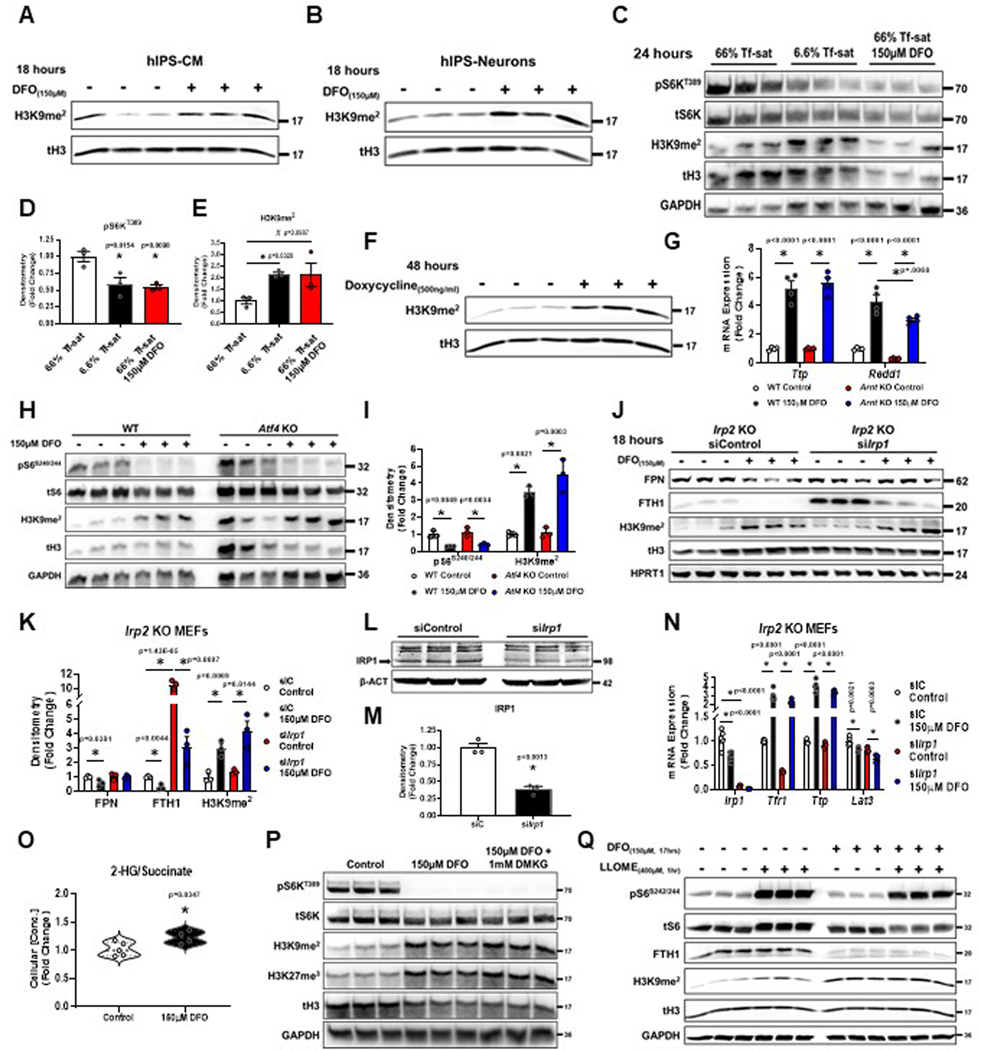
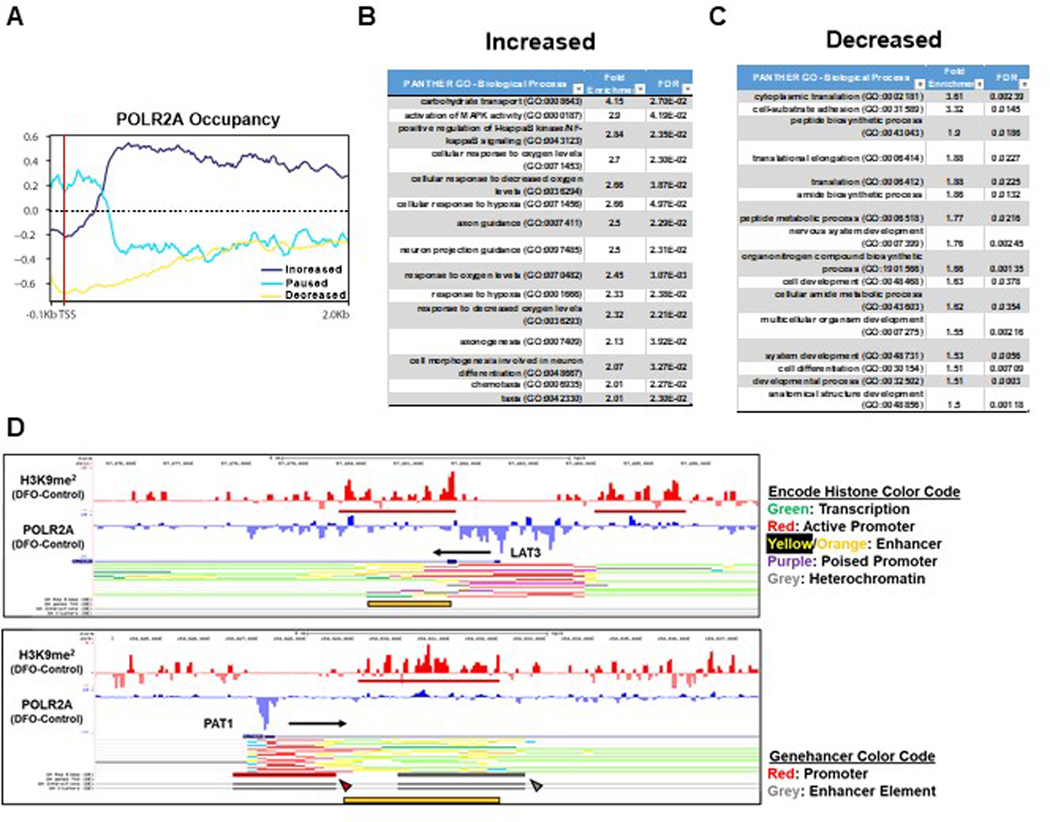
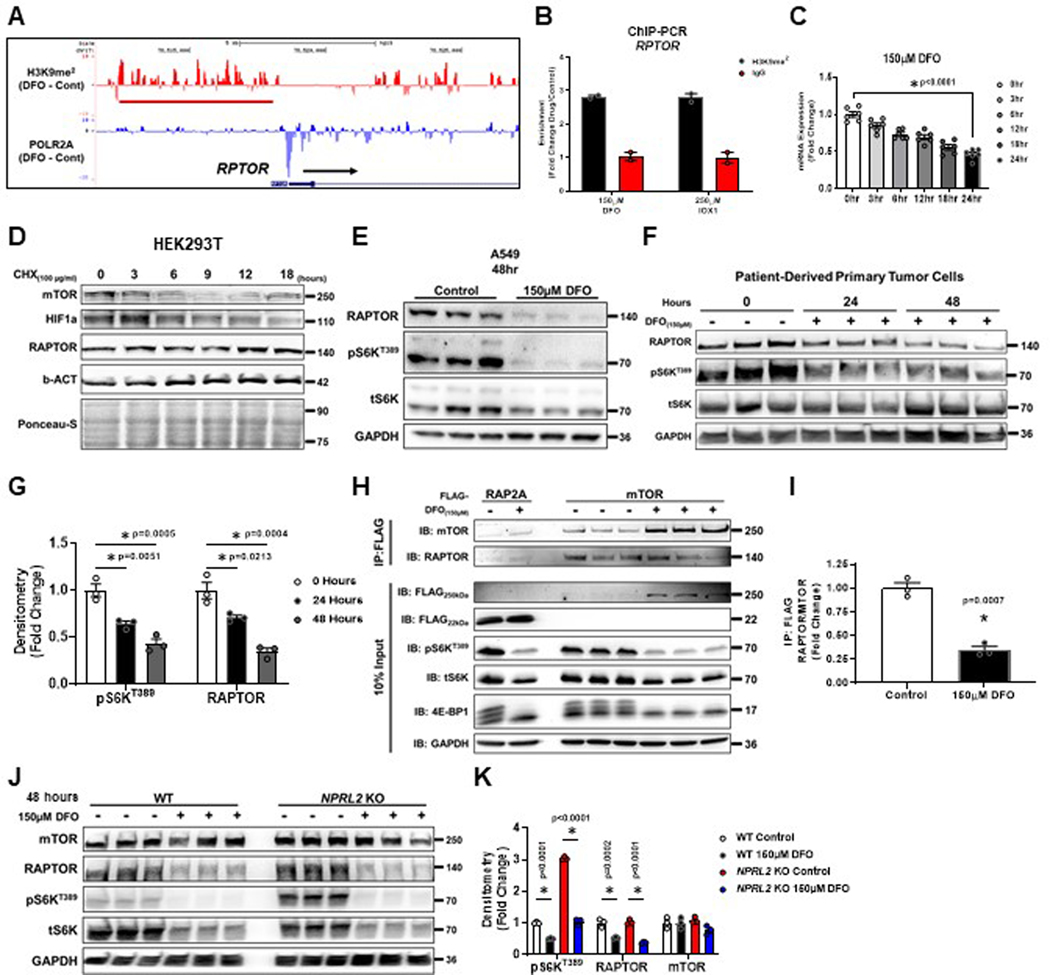
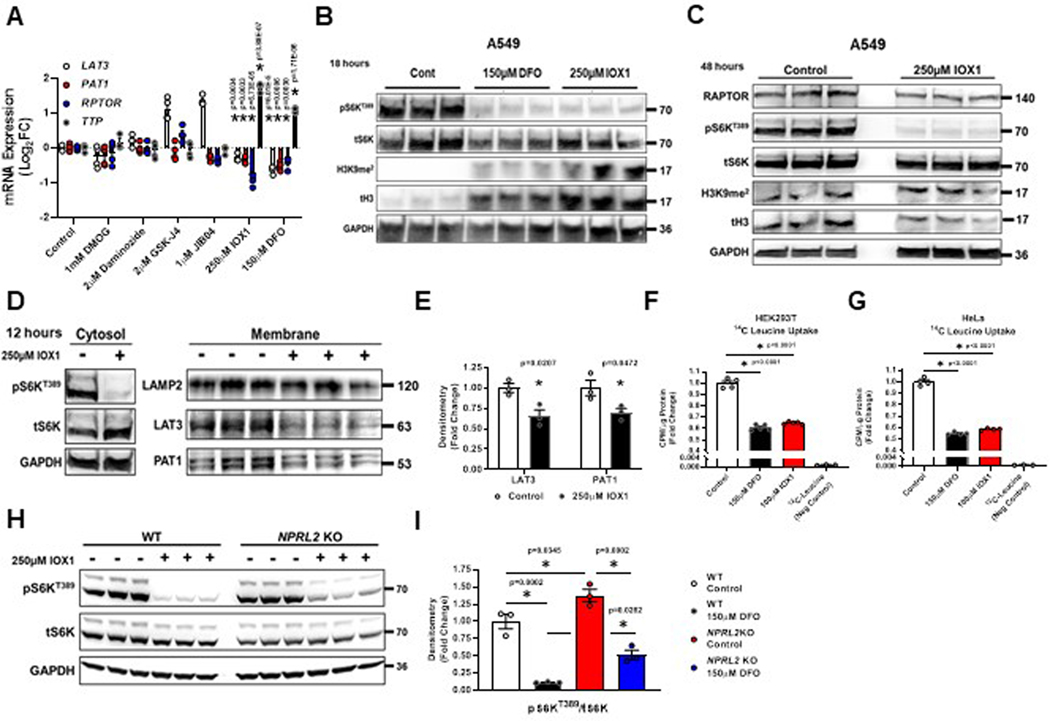
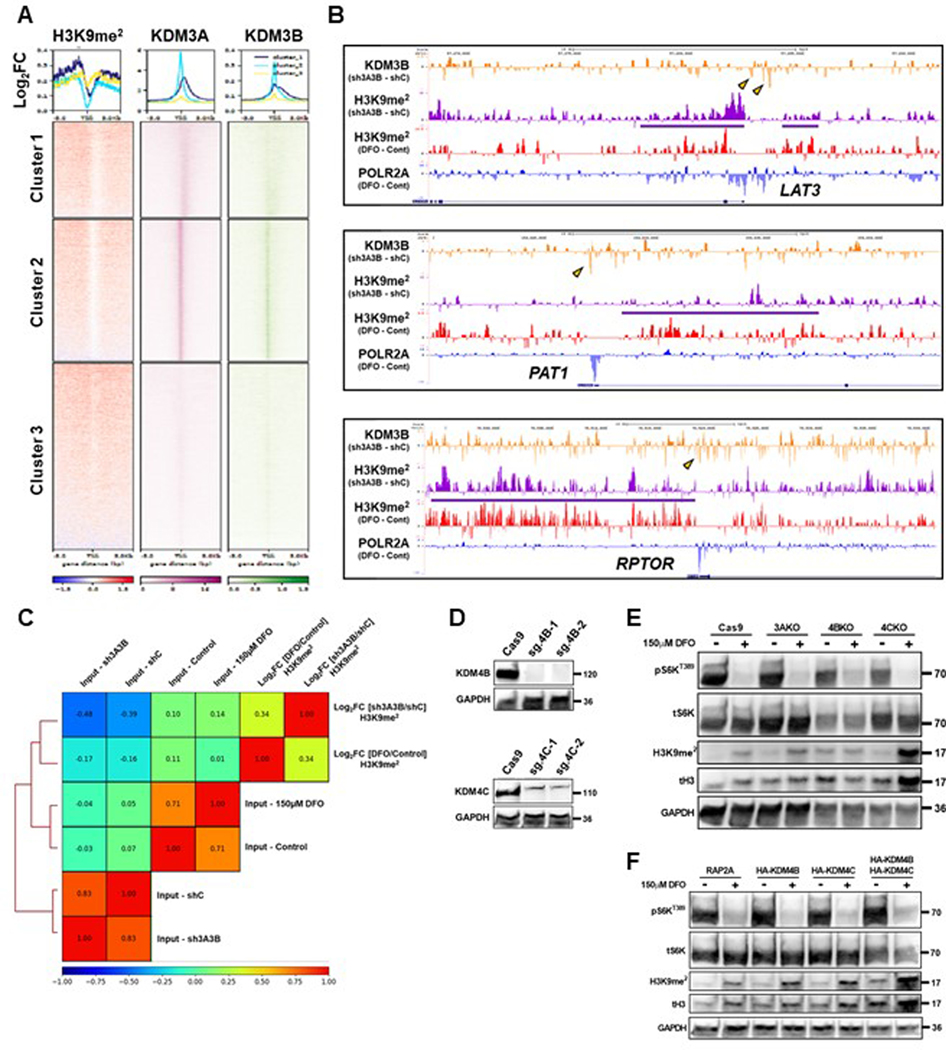
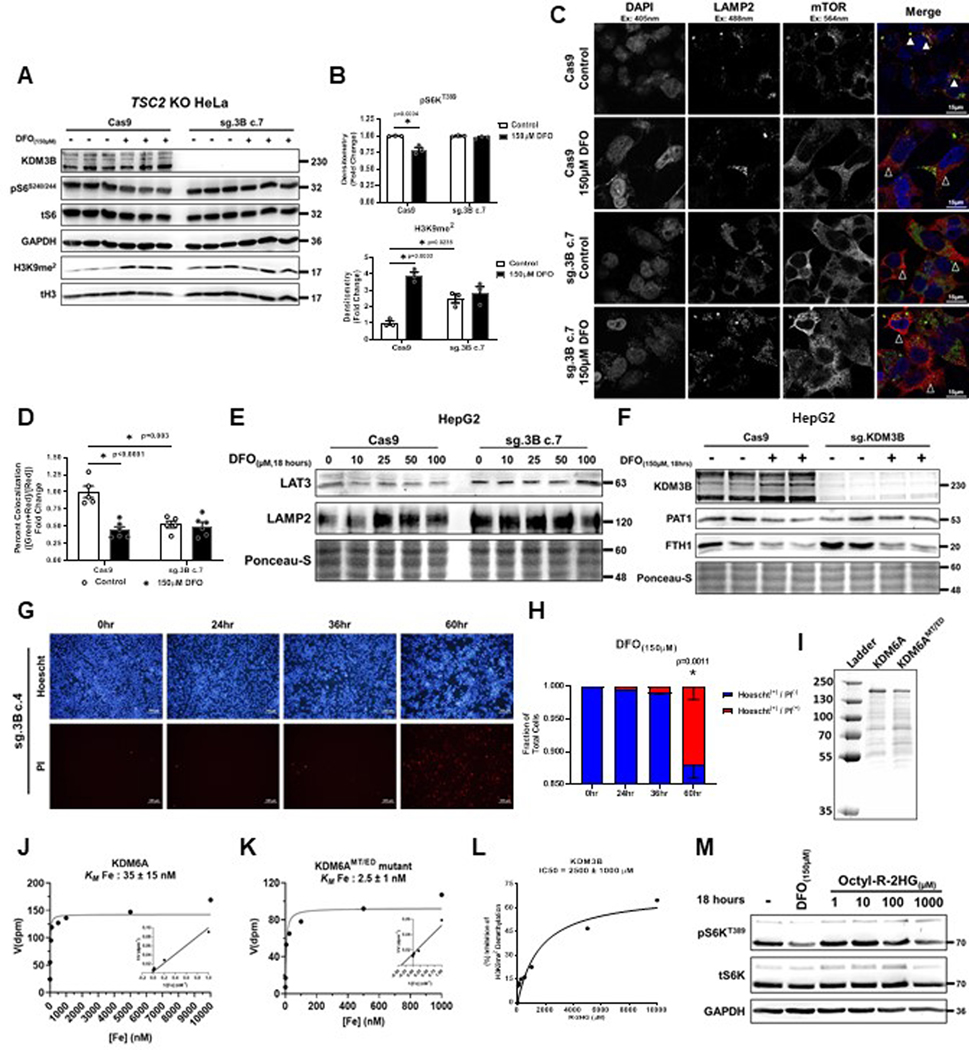
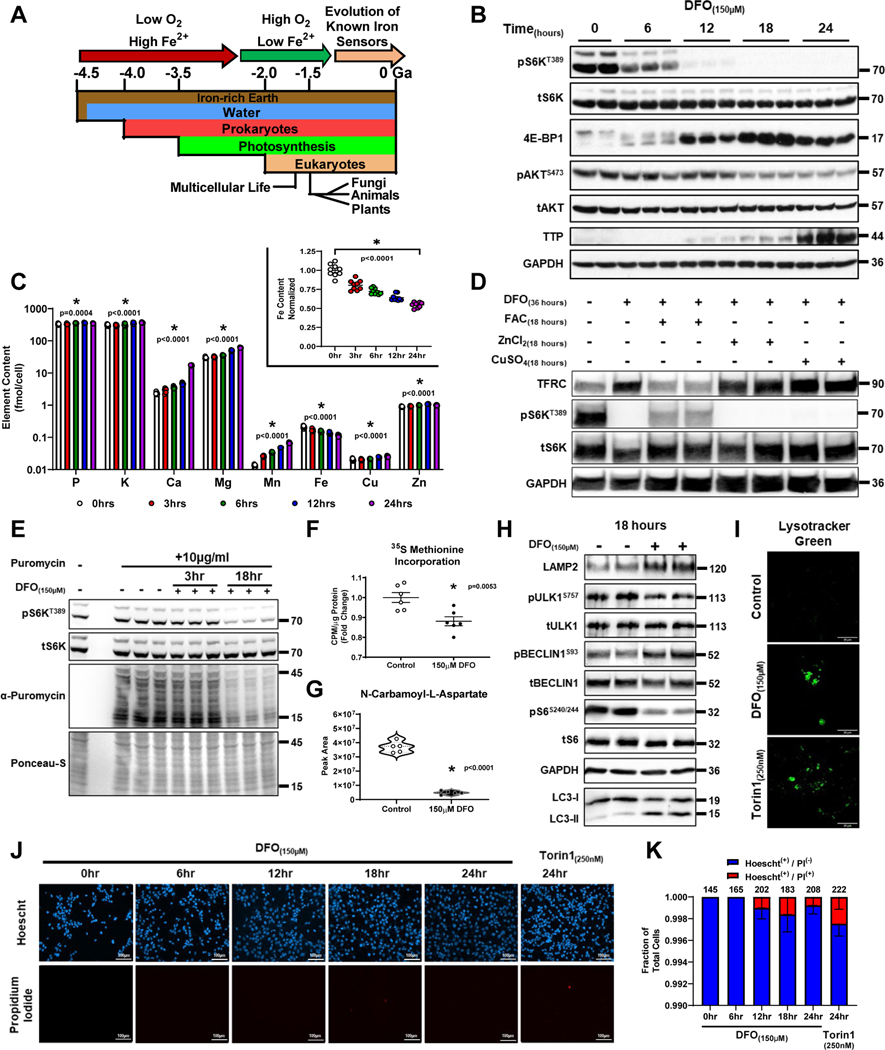
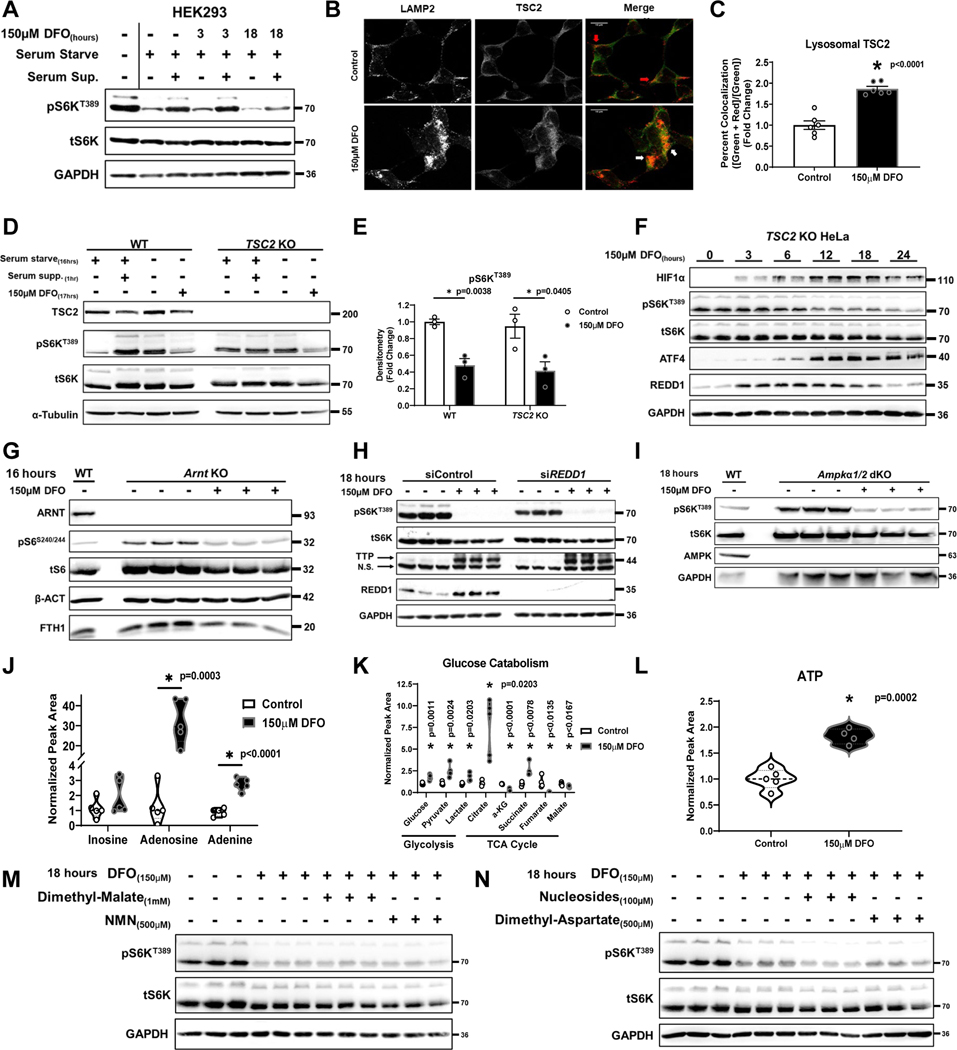
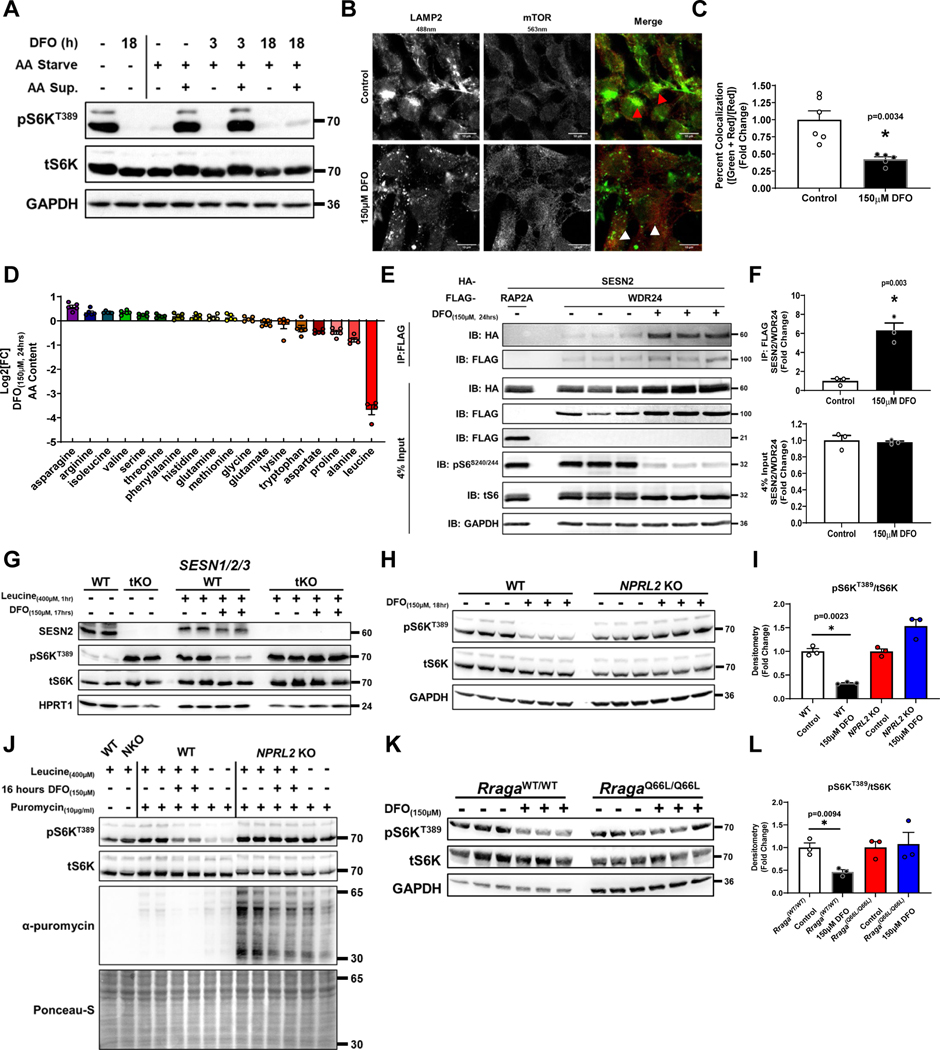
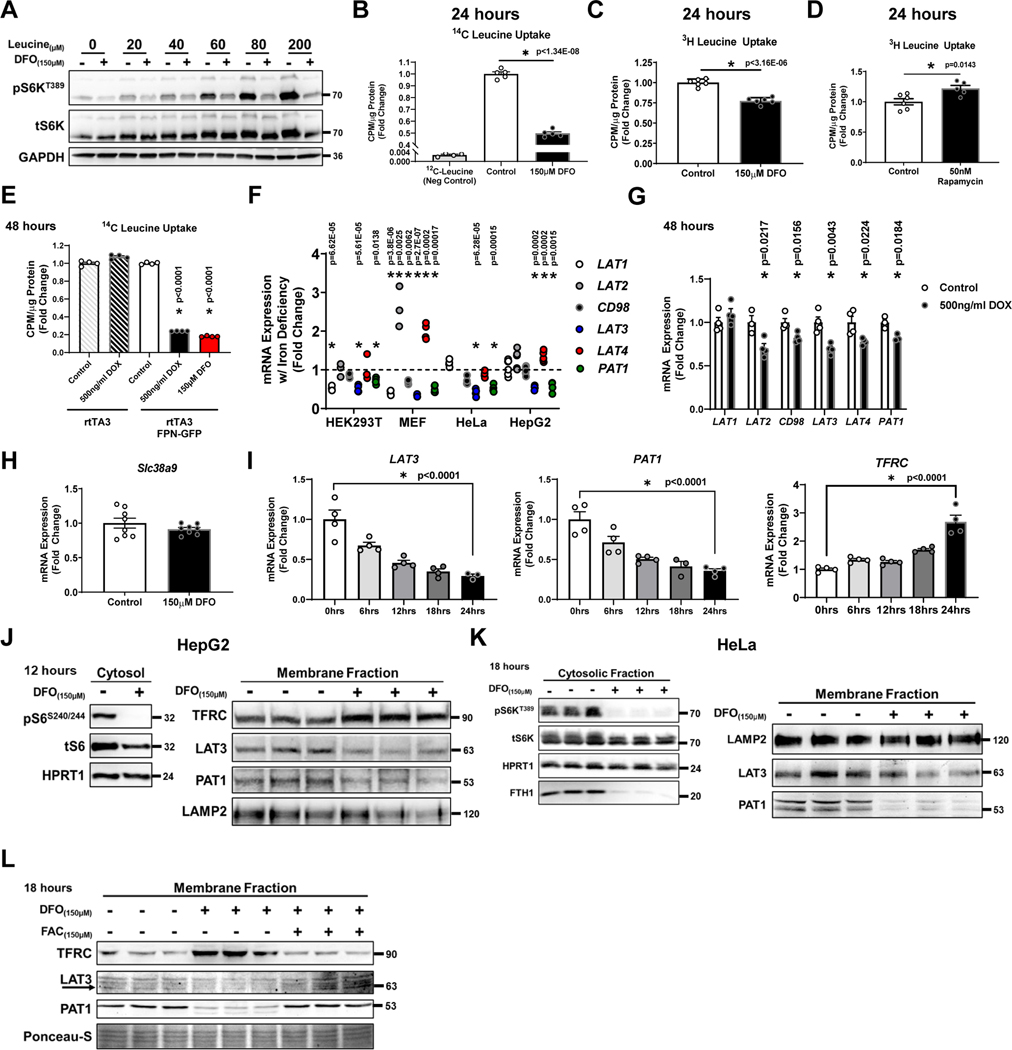
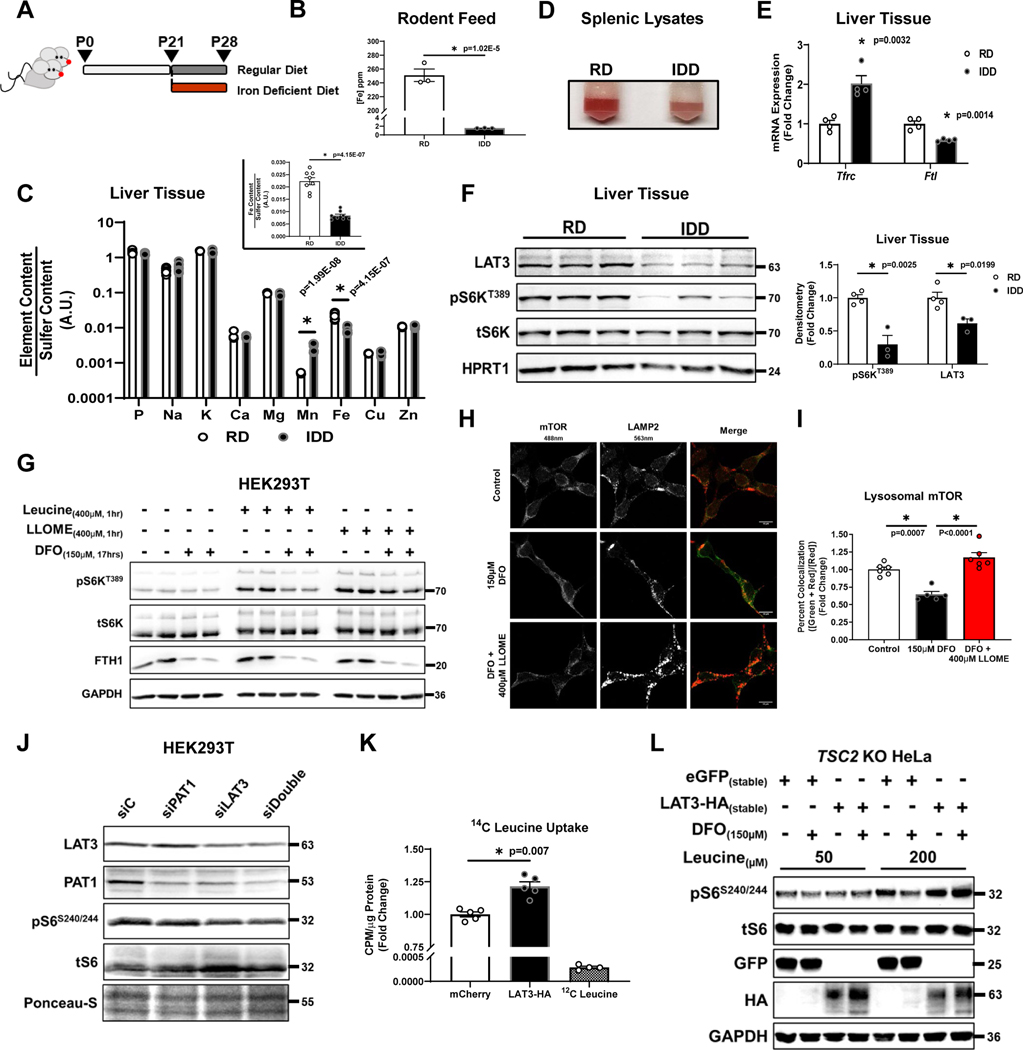
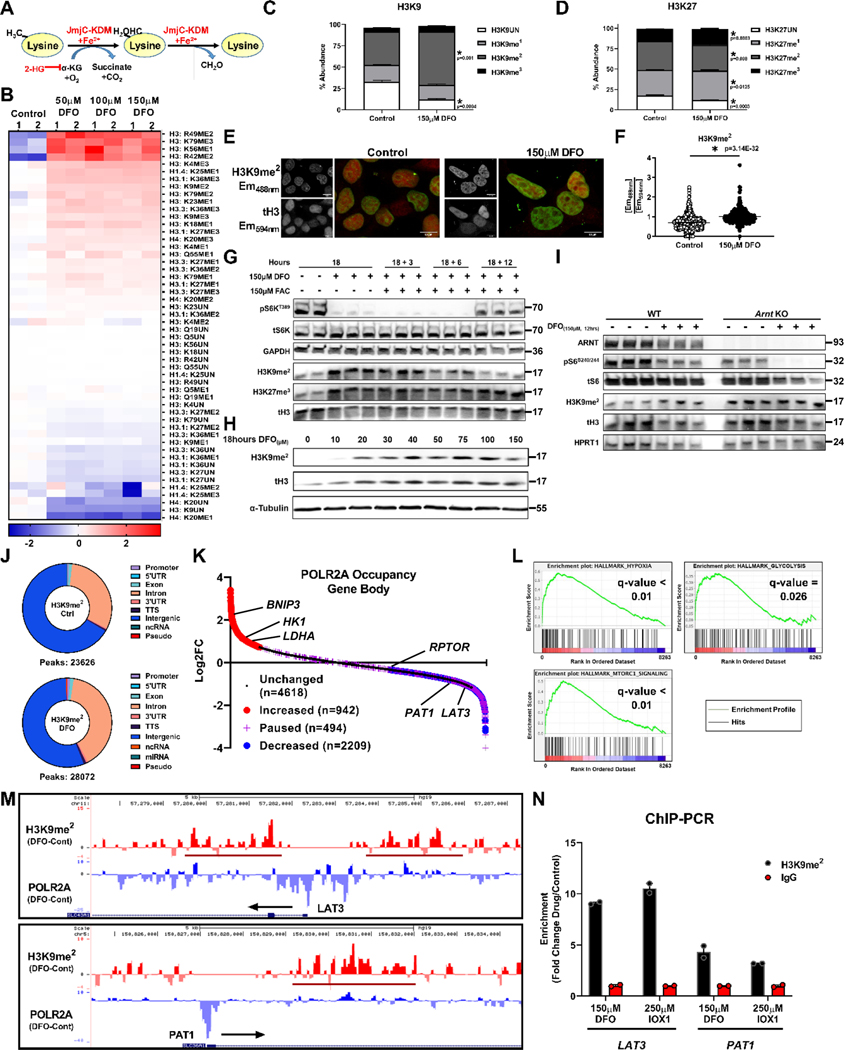
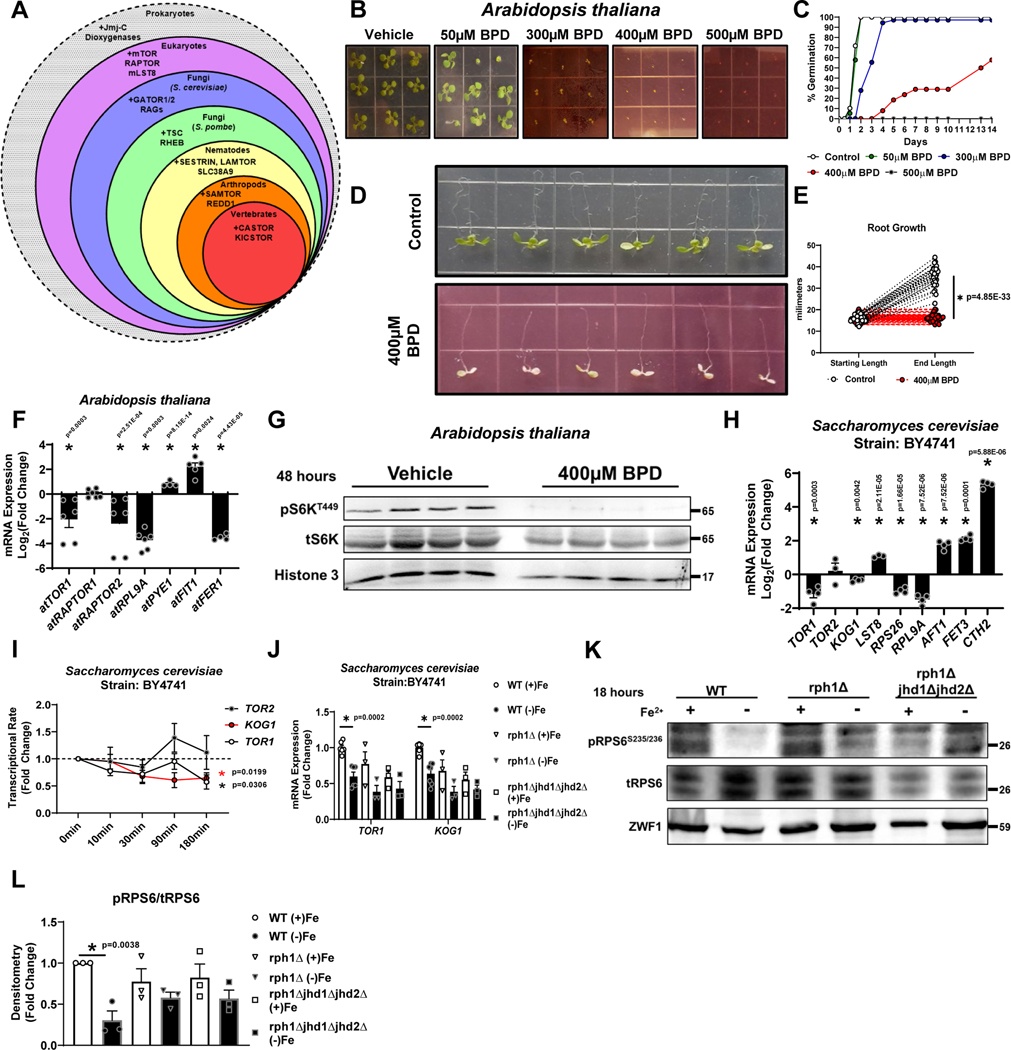
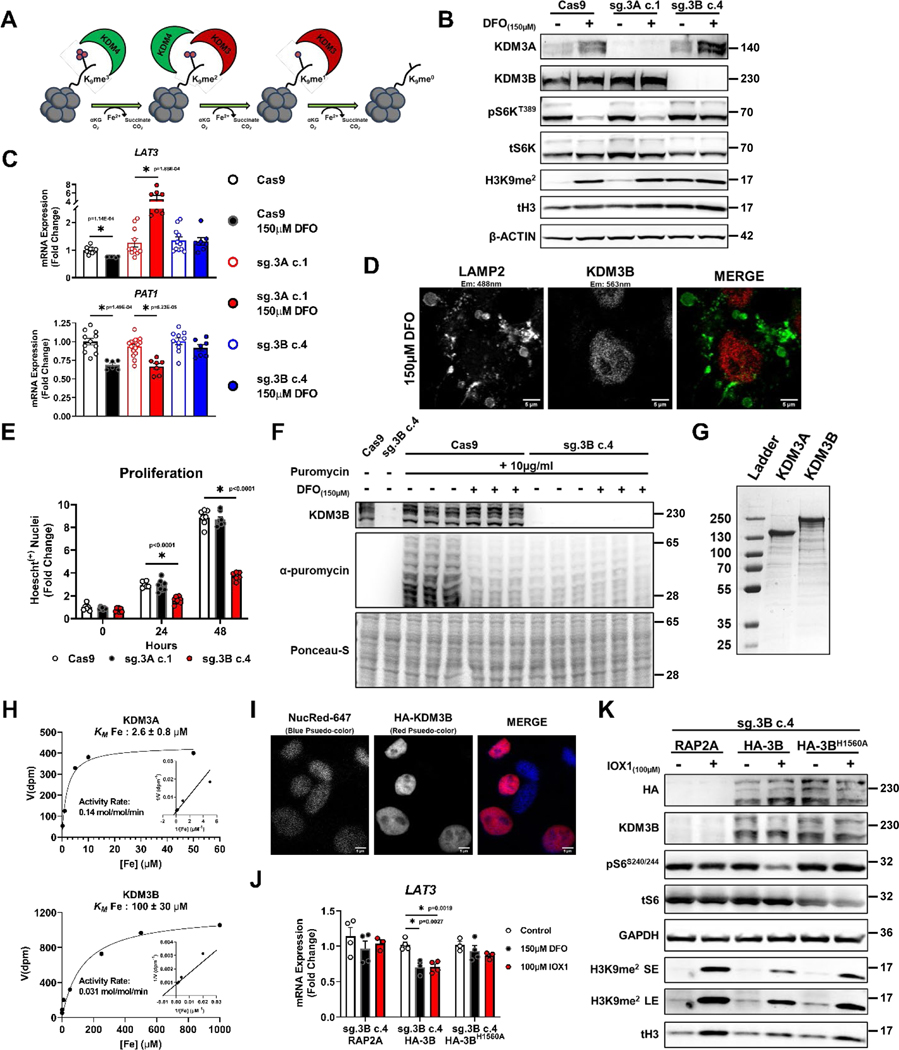
All eukaryotic cells require a minimal iron threshold to sustain anabolic metabolism. However, the mechanisms by which cells sense iron to regulate anabolic processes are unclear. Here we report a previously undescribed eukaryotic pathway for iron sensing in which molecular iron is required to sustain active histone demethylation and maintain the expression of critical components of the pro-anabolic mTORC1 pathway. Specifically, we identify the iron-binding histone-demethylase KDM3B as an intrinsic iron sensor that regulates mTORC1 activity by demethylating H3K9me2 at enhancers of a high-affinity leucine transporter, LAT3, and RPTOR. By directly suppressing leucine availability and RAPTOR levels, iron deficiency supersedes other nutrient inputs into mTORC1. This process occurs in vivo and is not an indirect effect by canonical iron-utilizing pathways. Because ancestral eukaryotes share homologues of KDMs and mTORC1 core components, this pathway probably pre-dated the emergence of the other kingdom-specific nutrient sensors for mTORC1.


Conflict of interest statement

Competing Interests:

The authors declare no competing interests.

Figures

Extended Data Figure 1.
Extended Data Figure 1.. Long-term ID inactivates mTORC1 in multiple cell types.
(A) Non-heme iron levels in HEK293T cells treated with 150μM DFO. (n=5 replicates, two-way unpaired t-test, mean ± SE). (B) mRNA levels of TTP and TFRC at indicated time points in HEK293T cells treated with 150μM DFO. Internal control: POLR2A (n=6 replicates per condition, one-way ANOVA and Tukey’s post-hoc test, mean ± SE). (C) Immunoblot of mTORC1 activity in HEK293T cells treated with indicated concentrations of DFO. Representative image of two independent experiments (D) Immunoblot of mTORC1 activity in HEK293T cells treated with 150μM DFO or 50μM BPD for 3 hours. Representative image of two independent experiments. (E) mRNA levels of indicated genes 3 hours after addition of 150μM DFO or 50μM BPD. Internal control: POLR2A (n=8 TFRC Control; n=7 TFRC 150μM DFO and 50μM BPD; n=4 REDD1; n=8 TTP replicates per condition, one-way ANOVA and Tukey’s post-hoc test, mean ± SE). (F) Immunoblot of mTORC1 activity in response to 250nM Torin1 at indicated time points. Representative image of two independent experiments. (G) Immunoblot of mTORC1 activity in primary murine hepatocytes treated with increasing concentrations of DFO. Representative image of two independent experiments (H) mRNA of Ttp and Tfrc in primary murine hepatocytes treated with indicated concentrations of DFO. Internal control: Polr2a (n=3 replicates per condition, one-way ANOVA and Tukey’s post-hoc test, mean ± SE). (I) Immunoblot of mTORC1 activity in hPS-CM treated with 150μM DFO. Representative image of one experiment (J) Immunoblot of mTORC1 activity in hiPS-neurons treated with 150μM DFO. Representative image of one experiment. (K) Immunoblot of HEK293T cells chelated for 18 hours followed by addition of ferric ammonium citrate (FAC) for indicated times. Representative image of two independent experiments. (L) BrdU incorporation in HEK293T cells treated with 150μM DFO. Representative image of six independent samples. (M) Quantification of cellular proliferation by Hoescht staining 48 hours after treatment with DFO (n=6 replicates, two-way unpaired t-test, mean ± SE). * indicates P value < 0.05 when noted for all panels. Source numerical data and unprocessed blots are available in source data files.
Extended Data Figure 2.
Extended Data Figure 2.. Non-pharmacologic means of inducing ID inactivates mTORC1.
(A) Immunoblot of mTORC1 activity in HEK293T cells treated with high Tf-sat (66%) or low Tf-sat (6.6%) media for 18 hours. Representative image of two independent experiments. (B) Summary of immunoblot in panel A (n=3 replicates, two-way unpaired t-test, mean ± SE). (C) Immunoblot of mTORC1 activity in HepG2 cells transfected with the FPN-GFP fusion protein and TET inducible rtTA3 plasmids in the presence and absence of 500ng/ml doxycycline for 48 hours. Representative image of two independent experiments. (D) Summary of immunoblot in panel C (n=3 replicates, two-way unpaired t-test, mean ± SE). (E) Fluorescent microscopy of cells transfected with FPN-GFP construct and treated with 500ng/ml doxycycline for 24 hours demonstrating appropriate expression and localization of the FPN-GFP fusion protein. Representative image of three independent samples. (F) Immunoblot of puromycin incorporation in rtTA3/FPN-GFP stable HEK293T cells in the presence and absence of 500ng/ml doxycycline for 48 hours. Representative image of one experiment. (G) mRNA expression of ER stress makers CHOP and BNIP3 in HepG2 cells transfected with rtTA3/FPN-GFP plasmids and treated with 500ng/ml doxycycline for 48 hours. Internal control: 18S (n=4 replicates, two-way unpaired t-test, mean ± SE). (H) Immunoblot of protein levels of the key components of the mTORC1 complex after 24 hours of 150μM DFO in HEK293T cells. Representative image of two independent experiments. (I) Summary of results shown in panel A (n=4 replicates, two-way unpaired t-test, mean ± SE). (J) Immunoblot of total and phosphorylated TSC2, AKT, ERK, GSK3β, and S6 proteins and total P53 at different time points after treatment with 150μM of DFO in HEK293T cells. Representative image of one experiment. (K) Immunoblot of mTORC1 activity and mitochondrial function in HepG2 cells treated with DFO for 18 hours at the indicated doses. Representative image of one experiment. (L) Oxygen Consumption Rate (OCR) measured by the Seahorse Assay in HepG2 cells treated for 24 hours of DFO at the indicated doses (n=10 replicates per group, mean ± SE). * indicates P value < 0.05 when noted for all panels.
Extended Data Figure 3.
Extended Data Figure 3.. Leucine sensing is required for mTORC1 inactivation by ID.
(A) Ttp mRNA in WT and Tsc2 KO MEFs treated with 150μM DFO. Internal control: Snrk (n=4 replicates per condition, one-way ANOVA and Tukey’s post-hoc test, mean ± SE). (B) Immunoblot of mTORC1 activity in WT and Tsc2 KO MEFs with indicated treatments. Representative image of three independent experiments. (C) REDD1 mRNA in HEK293T cells treated with siREDD1. Internal control: POL2RA (n=6 replicates per condition, two-way unpaired t-test, mean ± SE). (D) TFRC mRNA in HEK293T cells treated with siREDD1 and 150μM DFO. Internal control: POL2RA (n=6 replicates per condition, one-way ANOVA and Tukey’s post-hoc test, mean ± SE). (E) Immunoblot of mTORC1 and AMPK activity with indicated treatments. Representative image of one experiment (F) Ttp mRNA in WT and Ampkα1/2 dKO cells treated with 150μM DFO. Internal control: Polr2a (n=4 replicates per condition, one-way ANOVA and Tukey’s post-hoc test, mean ± SE). (G) Acridine orange staining in HEK293T cells treated with 150μM DFO. Representative image of six independent samples. (H) Summary of the results in Panel G (n=7 replicates control; n=6 150μM DFO, two-way unpaired t-test, mean ± SE). (I) Leucine levels in HEK293T cells treated with 150μM DFO (n=5 replicates control; n=4 150μM DFO two-way unpaired t-test, median ± quartiles). (J) SAM levels in HEK293T cells treated with 150μM DFO (n=5 replicates control; n=4 150μM DFO, two-way unpaired t-test, median ± quartiles). (K) Immunoblot of mTORC1 activity in WT and NPRL2 KO HEK293T cells with indicated treatments. Representative image of one experiment. (L) mTORC1 localization to lysosomes in NPRL2 KO cells treated with 150μM DFO. Representative image of six independent samples. (M) Quantification of images in panel L. (n=5 replicates control; n=6 150μM DFO, two-way unpaired t-test, mean ± SE) (N) Cell death using Hoescht and propidium iodide (PI) in WT and NPRL2 KO HEK293T cells treated with 150μM DFO for indicated times. Representative image of six independent samples. (O) Quantification of images in panel N. (n=6 replicates, two-way unpaired t-test, mean ± SE). * indicates P value < 0.05 when noted for all panels.
Extended Data Figure 4.
Extended Data Figure 4.. ID increases H3K9 di-methylation independent of ATF4, the IRP system, and 2-HG.
(A) Immunoblot of H3K9me2 in hiPS-CM treated with 150μM DFO. Representative image of one experiment. (B) Immunoblot of H3K9me2 in hiPS-Neurons treated with 150μM DFO. Representative image of one experiment. (C) Immunoblot of H3K9me2 levels in MEFs with indicated treatments. Representative image of two independent experiments. (D, E) Summary of immunoblot in panel C (n=3 replicates, one-way ANOVA and Tukey’s post-hoc test, mean ± SE). (F) Immunoblot of H3K9me2 in HepG2 cells expressing rtTA3/GFP-FPN with indicated treatments. Representative image of two independent experiments. (G) mRNA of indicated genes in WT and Arnt KO MEFs treated with 150μM DFO. Internal control: 18S (n=4 replicates per condition, one-way ANOVA and Tukey’s post-hoc test, mean ± SE). (H) Immunoblot of H3K9me2 levels in WT and Atf4 KO MEFs with indicated treatments. Representative image of one experiment. (I) Summary of immunoblot in panel H (n=3 replicates per condition, one-way ANOVA and Tukey’s post-hoc test, mean ± SE). (J) Immunoblot of H3K9me2 levels in WT and Irp1/2 KD/KO MEFs with indicated treatments. Representative image of two independent experiments. (K) Summary of immunoblot in panel J (n=3 replicates per condition, one-way ANOVA and Tukey’s post-hoc test, mean ± SE). (L) Immunoblot of IRP1 levels in Irp2 KO MEFs treated with indicated siRNA. Representative image of one experiment. (M) Summary of immunoblot in panel L (n=3 replicates per condition, two-way unpaired t-test, mean ± SE). (N) mRNA of indicated genes in WT and Irp1/2 KD/KO MEFs treated with 150μM DFO. Internal control: Snrk (n=6 replicates per condition, one-way ANOVA and Tukey’s post-hoc test, mean ± SE). (O) Ratio of 2-HG/succinate levels in HEK293T cells treated 150μM DFO (n=5 replicates control; n=4 150μM DFO, two-way unpaired t-test, median ± quartiles). (P) Immunoblot of H3K9me2 in HEK293T cells with indicated treatments. Representative image of one experiment. (Q) Immunoblot of H3K9me2 in HEK293T cells with indicated treatments. Representative image of one experiment. * indicates P value < 0.05 when noted for all panels.
Extended Data Figure 5.
Extended Data Figure 5.. ID alters occupancy of POLR2A at the promoters of genes involved in metabolic pathways.
(A) Fold change in POLR2A occupancy within predefined regions of the promoter and gene body to categorize genes defined by increased POLR2A binding, POLR2A loss, and promoter-pausing. (B) Gene-ontology (GO) terms of genes enriched in the increased POLR2A group after ID. (C) GO terms of genes that had decreased POLR2A after ID. (D) UCSC genome browser tracks for the LAT3 (top) and PAT1 (bottom) gene loci. POLR2A and H3K9me2 tracks from ChIP-seq analysis were loaded and represented as the difference in normalized reads between the DFO and control groups. Regions of H3K9me2 enrichment in the DFO group are underlined in red. Direction of transcription is indicated by a black arrow. Encode Histone (LAT3 and PAT1) and Genehancer (PAT1) browser tracks are displayed beneath and represent predicted enhancer regions which align with regions of increased H3K9me2 signal in response to DFO. Yellow bar, red and grey arrows indicate enhancer regions designated by Encode Histone and Genehancer browser tracks.
Extended Data Figure 6.
Extended Data Figure 6.. ID increases H3K9 di-methylation within the promoter of RPTOR and correlates with decreased RPTOR expression.
(A) H3K9me2 signal and POL2RA occupancy in the promoter for RPTOR from ChIP-Seq analysis. (B) ChIP-PCR of RPTOR in HEK293T cells. Cells treated with 150μM DFO or 250μM IOX1 for 12 hours and vehicle controls were followed by IP of lysates using an antibody against H3K9me2. IgG was used as a negative control for the IP (n=2 replicates). (C) RPTOR mRNA levels at indicated time points after the addition of 150μM DFO. Samples matched with Figure 4I. Internal control: POLR2A (n=4 replicates per condition, one-way ANOVA and Tukey’s post-hoc test, mean ± SE). (D) Immunoblot of RPTOR, mTOR and HIF1-α levels in HEK293T cells treated with 100 μg/ml cycloheximide (CHX) for indicated time points. HIF1-α, which is rapidly turned over under normoxic conditions via the actions of the EGLN and Von-Hippel Lindau (VHL) proteins, was used as a positive control. Representative image of one experiment. (E) Immunoblot of mTORC1 activity and complex member RAPTOR in A549 cells after treatment with 150μM DFO for 48 hours. Representative image of two independent experiments. (F) Immunoblot of mTORC1 activity and complex member RAPTOR in patient-derived primary tumor cell cultures treated with 150μM DFO. Representative image of one experiment. (G) Quantification of immunoblot in panel (F) (n=3 replicates, one-way ANOVA and Tukey’s post-hoc test, mean ± SE.) (H) Immunoblot of lysates from cells transfected with FLAG-RAP2A or FLAG-mTOR and treated with or without 150μM DFO for 48 hours. Immunoprecipitation was performed with anti-FLAG antibody. RAP2A = negative control. (I) Summary of IP studies from panel (H) (n=3 replicates, two-way unpaired t-test, mean ± SE). Representative image of two independent experiments (J) Immunoblot of mTORC1 activity in WT and NPRL2 KO HEK293T treated with and without 150μM DFO for 48 hours. Representative image of one experiment. (K) Quantification of immunoblot in panel (J) (n=3 replicates, one-way ANOVA and Tukey’s post-hoc test, mean ± SE). * indicates P value < 0.05 when noted for all panels.
Extended Data Figure 7.
Extended Data Figure 7.. The Jumonji-C KDM family inhibitor IOX1 mimics the actions of ID on mTORC1 activity.
(A) RT-PCR of AA transporters, RPTOR and TTP in HEK293T cells treated with various Jmj-C domain inhibitors for 12 hours. Internal control: POLR2A (n=4 replicates per condition; except n=3 TTP 1mM DMOG, two-way unpaired t-test, mean ± SE). (B) Immunoblot of mTORC1 activity and H3K9me2 levels in A549 cells treated with 150μM DFO or 250μM IOX1 for 18hrs. Representative image of two independent experiments. (C) Immunoblot of indicated proteins in A549 cells treated with 250μM IOX1 for 48 hours. Representative image of two independent experiments. (D) Immunoblot of cytosol and membrane fractions from HepG2 cells treated with 250μM IOX1 for 12 hours. Representative image of one experiment. (E) Densitometry summary of data in Panel D (n=3 replicates per condition, two-way unpaired t-test, mean ± SE). (F) 14[C]-leucine uptake into HEK293T cells treated with 150μM DFO or 100μM IOX1 for 18 hours (n=5 replicates per condition, one-way ANOVA and Tukey’s post-hoc test, mean ± SE). (G) 14[C]-leucine uptake into HeLa cells treated with 150μM DFO or 100μM IOX1 for 18 hours (n=4 replicates per condition, one-way ANOVA and Tukey’s post-hoc test, mean ± SE). (H) Immunoblot of mTORC1 activity WT and NPRL2 KO HEK293T cells treated with 250μM IOX1 for 18 hours. Representative image of two independent experiments (I) Quantification of immunoblot in panel H (n=3 replicates per group, one-way ANOVA with Tukey’s post-hoc test. mean ± SE). * indicates P value < 0.05 when noted for all panels.
Extended Data Figure 8.
Extended Data Figure 8.. H3K9 di-methyl ChIP-seq signal in iron chelated samples correlate with changes after loss of KDM3A and KDM3B.
(A) Heatmap of the log2FC in H3K9me2 signal between DFO treatment and control plotted against KDM3A and KDM3B occupancy. K-means cluster =3. (B) Browser tracks with KDM3B and H3K9me2 track data from HCT116 cells treated with control shRNA (shC) or shRNA targeting KDM3A and KDM3B (sh3A3B). Track data for KDM3A was downloaded from the GEO database accession GSE127624. Track data for KDM3B and H3K9me2 from HCT116 cells were downloaded from the GEO database accession GSE71885. (C) Hierarchical clustering and correlation analysis between indicated samples using deepTools plotCorrelation. Values indicate the Pearson correlation between the sample listed in the corresponding row and column. (D) Immunoblot showing deletion of KDM4A and 4B, using CRISPR-Cas technology in HEK293T cells. Representative image of one experiment. (E) Immunoblot of mTORC1 activity and H3K9me2 in Cas9 (WT) and KDM3A, KDM4B or KDM4C KO HEK293T cells in the presence and absence of 150μM DFO for 18 hours. Representative image of one experiment. (F) Immunoblot of mTORC1 activity and H3K9me2 in HEK293T cells with overexpression of HA-tagged KDM4A, KDM4B or combination of the two proteins treated with 150μM DFO for 18 hours. Representative image of one experiment.
Extended Data Figure 9.
Extended Data Figure 9.. KDM3B KO cells do not repress LAT3/PAT1 expression or mTORC1 activity, and have increased cell death during ID.
(A) Immunoblot of mTORC1 activity and H3K9me2 in Cas9 (WT) and sg.3B c.7 (KDM3B KO) TSC2 KO HeLa cells in the presence and absence of 150μM DFO for 18 hours. Representative image of one experiment. (B) Summary of immunoblot in panel A (n=3 replicates per group, one-way ANOVA with Tukey’s post-hoc test. Mean ± SE). (C) Assessment of mTORC1 on the lysosome in KDM3B KO HepG2 cells treated with 150μM DFO for 18 hours. Representative image of five independent samples. (D) Quantification of images in panel C. (n=5 replicates per condition, one-way ANOVA and Tukey’s post-hoc test, mean ± SE). (E) Immunoblot of LAT3 protein in KDM3B KO HepG2 cells treated with DFO for 18 hours. Representative image of one experiment. (F) Immunoblot of PAT1 protein in KDM3B KO HepG2 cells treated with DFO for 18 hours. Representative image of one experiment. (G) Fluorescent microscopy of cell death using Hoescht and propidium iodide (PI) double staining in KDM3B KO HEK293T cells treated with 150μM DFO for 0, 24, 36 and 60 hours. Representative image of six independent samples. (H) Quantification of images in panel G. (n=6 replicates, one-way ANOVA and Tukey’s post-hoc test, mean ± SE). (I) SDS-PAGE gel of purified N-terminal FLAG-tagged WT KDM6A and KDM6AMT/ED mutant expressed using a baculoviral overexpression system. Representative image of three independent experiments. (J, K) Enzyme kinetics of WT KDM6A (J) and KDM6AMT/ED (K) in the presence of increasing concentrations of iron. (L) Enzyme kinetics of KDM3B in the presence of increasing concentrations of R-2HG. (M) Immunoblot of mTORC1 activity in HEK293T cells after treatment with 150μM DFO or increasing concentrations of octyl-R-2HG. Representative image of one experiment. * indicates P value < 0.05 when noted for all panels.
Figure 1.
Figure 1.. Long-term ID inactivates mTORC1
(A) Schematic of the evolution of eukaryotic life on earth,. (B) Immunoblot of mTORC1 and mTORC2 activity in HEK293T cells treated with 150μM DFO for the indicated times. Representative image of two independent experiments. (C) ICP-MS-based measurement of cellular metal content plotted on Log10-scale in HEK293T cells treated with 150μM DFO for the indicated times. Insert graph depicts normalized changes in Fe content plotted on a linear scale. (n=3 independent samples measured in triplicate, one-way ANOVA and Tukey’s post-hoc test, mean ± SE). (D) Immunoblot of mTORC1 activity in HEK293T cells treated with 150μM DFO for 18 hours and then supplemented with equimolar concentrations of either Fe2+, Cu2+ or Zn2+ for an additional 18 hours. Representative image of two independent experiments. (E-F) Incorporation of puromycin (E) and 35S methionine (F) into elongating peptide chains in HEK293T cells after treatment with 150μM DFO for 18 hours. ((F) n=6 replicates per condition, two-tailed unpaired t-test, mean ± SE). (G) Cellular levels of N-carbomyl-L-aspartate after treatment with 150μM DFO for 18 hours measured by HPLC-MS (n=5 replicates per condition, two-tailed unpaired t-test, median ± quartiles). (H) Assessment of autophagy, as measured by ULK1 phosphorylation, LAMP2 levels and BECLIN1S93 phosphorylation, and conversion of LC3I to LC3II in HEK293T cells treated with 150μM DFO for 18 hours. Representative image of two independent experiments. (I) Fluorescent confocal microscopy of lysosomes stained with Lysotracker green in HEK293T cells treated with 150μM DFO for 18 hours or 250nM Torin1 for 6 hours. Representative image of five independent samples. (J) Fluorescent microscopy of cell death using Hoescht and propidium iodide (PI) double staining in HEK293T cells treated with 150μM DFO or 250nM Torin-1 at indicated times. Representative image of five independent samples. (K) Quantification of images in panel J. (n=6 replicates, one-way ANOVA and Tukey’s post-hoc test, mean ± SE). Source numerical data and unprocessed blots are available in source data files. * indicates P value < 0.05 when noted for all panels.
Figure 2.
Figure 2.. ID does not require TSC1/2 or AMPK signaling to inhibit mTORC1
(A) Immunoblot of mTORC1 activity in HEK293 cells that were serum starved overnight followed by the addition of serum for 1 hour in the presence or absence of 150μM DFO for the indicated times. Representative image of three independent experiments. (B) Recruitment of TSC2 to the lysosome in HEK293 cells treated with DFO for 24 hours. Representative image of five independent samples. (C) Summary of the results in panel C (n=6 replicates per condition, two-tailed unpaired t-test, mean ± SE). (D) Immunoblot of mTORC1 activity in WT and TSC2 KO HeLa cells that were serum starved overnight followed by the addition of serum for 1 hour in the presence or absence of 150μM DFO for 17 hours. Representative image of two independent experiments. (E) Summary graph of immunoblot in panel D (n=3 samples per condition, one-way ANOVA and Tukey’s post-hoc test, mean ± SE). (F) Immunoblot of mTORC1 activity and hypoxia regulated factors in TSC2 KO HeLa cells treated with 150μM DFO for the indicated times. Representative image of two independent experiments. (G) Immunoblot of mTORC1 activity in Arnt KO MEFs treated with 150μM DFO for 16 hours. Representative image of two independent experiments. (H) Immunoblot of mTORC1 activity in HEK293T cells treated with REDD1 siRNA in the presence and absence of 150μM DFO for 18 hours. Representative image of one experiment with 3 independent samples. (I) Immunoblot of mTORC1 activity in WT and Ampkα 1/2 dKO MEFs treated with 150μM DFO for 18 hours. Representative image of two independent experiments. (J) Cellular levels of the purines inosine, adenosine, and adenine in HEK293T cells after treatment with 150μM DFO for 18 hours measured by HPLC-MS (n=5 replicates per condition, two-tailed unpaired t-test, median ± quartiles). (K) Targeted metabolomics in HEK293T cells treated with 150μM DFO for 18 hours (n=4 replicates per condition, two-tailed unpaired t-test, median ± quartiles). (L) Total cellular ATP pools in HEK293T cells after 18 hours of treatment with 150μM DFO (n=4 replicates per condition, two-tailed unpaired t-test, median ± quartiles). (M) Immunoblot of mTORC1 activity in HEK293T cells in the presence and absence of 150μM DFO for 18 hours, supplemented with 1mM dimethyl malate or 500μM NMN. Representative image of one experiment with 3 independent samples. (N) Immunoblot of mTORC1 activity in HEK293T cells in the presence and absence of 150μM DFO for 18 hours, supplemented with 100μM nucleoside cocktail (Adenosine, Guanosine, Thymidine and Cytidine), or 500μM dimethyl aspartate. Representative image of one experiment with three independent samples. Source numerical data and unprocessed blots are available in source data files. * indicates P value < 0.05 when noted for all panels.
Figure 3.
Figure 3.. ID causes mTORC1 inhibition through leucine sensing
(A) Immunoblot of mTORC1 activity in HEK293T cells starved of AA for 3 hours followed by restimulation for 1 hour in the presence or absence of 150μM DFO for the indicated times. Representative image of three independent experiments. (B) Fluorescent confocal microscopy showing dissociation of mTOR from the lysosome in HEK293T cells treated with 150μM DFO for 18 hours. Representative image of five independent samples. (C) Summary graph of the images in panel B (n=6 replicates control; n=5 replicates 150μM DFO, two-tailed unpaired t-test, mean ± SE). (D) HPLC-MS based measurement of 16 amino acids in MEFs treated with 150μM DFO for 24 hours. (n=5 replicates, mean ± SE). (E) Co-IP of HA-SESTRIN2 and FLAG-WDR24 (a member of the GATOR2 complex) in HEK293T cells treated with 150μM DFO for 24 hours. Cell lysates were subjected to immunoprecipitation with anti-FLAG antibody and analyzed by immunoblotting. RAP2A = negative control. Representative image of three independent experiments. (F) Summary of co-IP studies in panel E (n=3 replicates per condition, unpaired t-test, mean ± SE). (G) Immunoblot of mTORC1 activity in WT and SESN1/2/3 tKO HEK293T cells starved overnight of leucine followed by the addition of 400μM leucine for 1 hour in the presence or absence of 150μM DFO. Representative image of two independent experiments. (H) Immunoblot of mTORC1 activity in WT and NPRL2 KO HEK293T in the presence or absences of 150μM DFO for 18 hours. Representative image of two independent experiments. (I) Summary graph of immunoblot in panel H (n=3 samples per condition, one-way ANOVA and Tukey’s post-hoc test, mean ± SE). (J) Incorporation of puromycin into elongating peptide chains in WT and NPRL2 KO 293T cells in the presence and absence of 150μM DFO and 400μM leucine for 16 hours. Representative image of two independent experiments. (K) Immunoblot of mTORC1 activity in Rraga+/+ (WT) and RragaQ66L/Q66L (KI) MEFs treated with 150μM DFO for 18 hours. Representative image of two independent experiments. (L) Summary graph of immunoblot in panel K. (n=3 replicates per condition, one-way ANOVA and Tukey’s post-hoc test, mean ± SE). Source numerical data and unprocessed blots are available in source data files. * indicates P value < 0.05 when noted for all panels.
Figure 4.
Figure 4.. ID prevents leucine uptake
(A) Immunoblot of mTORC1 activity in cells treated with 150μM DFO and cultured in leucine-free media for 15 hours. At t=15 hours, cells were supplemented with increasing concentrations of leucine for 3 hours. Representative image of two independent experiments (B) 14C-Leucine uptake in HEK293T cells with and without 150μM DFO treatment for 18 hours (n=5 replicates per condition, two-tailed unpaired t-test, mean ± SE). (C) 3H-leucine uptake into MEFs treated with 150μM DFO for 24 hours (n=6 replicates per, two-tailed unpaired t-test, mean ± SE). (D) 3H-Leucine uptake into MEF cells treated with 50nM rapamycin for 24 hours (n=6 replicates control; n=5 replicates 50nM Rapamycin, two-tailed unpaired t-test, mean ± SE). (E) 14C-Leucine uptake into HEK293T cells transfected with rtTA3/FPN-GFP or rtTA3/eGFP control and in the presence and absence of 500ng/ml doxycycline treatment for 48 hours or 150μM of DFO for 18 hours (n=4 replicates per condition, one-way ANOVA and Tukey’s post-hoc test, mean ± SE). (F) mRNA levels of the cell surface leucine transporters LAT1–4 and the lysosomal leucine regulator PAT1 in indicated cell types and tissues. Internal controls: POLR2A (HEK, HeLa), 18S (HepG2), Snrk (MEF) (n=4 replicates HEK293T LAT1; n=3 HEK293T LAT2; n=3 HEK293T CD98; n=4 HEK293T LAT3; n=3 HEK293T LAT4; n=4 HEK293T PAT1; n=4 MEF LAT1; n=4 MEF LAT2; n=4 MEF CD98; n=4 MEF LAT3; n=4 MEF LAT4; n=5 MEF PAT1; n=4 HeLa LAT1; n=4 HeLa CD98; n=4 HeLa LAT3; n=4 HeLa LAT4; n=4 HeLa PAT1; n=6 HepG2 LAT1; n=6 HepG2 LAT2; n=6 HepG2 CD98; n=6 HepG2 LAT3; n=6 HepG2 LAT4; n=5 HepG2 PAT1, two-tailed unpaired t-test, mean ± SE). (G) mRNA of various leucine transporters in HepG2 cells transfected with rtTA3/FPN-GFP plasmids in and treated with 500ng/ml doxycycline for 48 hours. Internal control: 18S (n=4 replicates per condition for all conditions except; n=3 LAT2 control; n=3 PAT1 control; n=3 PAT1 500ng/ml DOX, unpaired t-test, mean ± SE). (H) Slc38a9 mRNA levels in MEFs treated with DFO for 24 hours. Internal control: Polr2a (n=8 replicates per condition, two-tailed unpaired t-test, mean ± SE). (I) mRNA levels of LAT3, PAT1 and TFRC1 at indicated time points in HeLa cells treated with150μM DFO: Internal control: POLR2A (n=4 replicates per time point except; n=3 LAT3 24hrs; n=3 PAT1 18hrs, one-way ANOVA and Tukey’s post-hoc test, mean ± SE). (J) Immunoblotting of cytosolic and membrane fractions isolated from HepG2 cells treated with 150μM DFO for 12 hours. Immunoblot of mTORC1 activity demonstrating the effectiveness of DFO in the cytoplasmic fraction is shown on the left. Representative image of two independent experiments. (K) Immunoblot of mTORC1 activity in cytosolic fraction and LAT3 and PAT1 in the membrane fraction of HeLa cells treated with 150μM DFO for 18 hours. Representative image of two independent experiments. (L) Immunoblot of LAT3 and PAT1 in iron deficient-HEK293T cells supplemented with FAC. Representative image from one experiment with three independent samples. Source numerical data and unprocessed blots are available in source data files. * indicates P value < 0.05 when noted for all panels.
Figure 5.
Figure 5.. ID inhibits mTORC1 through LAT3
(A) Schematic depicting our in vivo ID protocol. (B) ICP-MS-based measurement of iron content in ppm from regular and iron deficient rodent diets. (n=3 replicates per group, two-tailed unpaired t-test, mean ± SE). (C) ICP-MS-based measurement of cellular metal content plotted on Log10-scale in livers from mice fed 7 days of IDD. Insert graph depicts normalized changes in Fe content plotted on a linear scale. (n=8 replicates per group, two-tailed unpaired t-test, mean ± SE). (D) Image of splenic lysates from mice treated with regular and ID diet. Representative image from five independent samples. (E) mRNA levels of Tfrc1 and Ftl in mice treated with regular and ID diet. Internal control: Polr2a (n=4 mice per group, two-tailed unpaired t-test, mean ± SE). (F) Immunoblot of mTORC1 activity and LAT3 in the liver of mice treated with iron deficient diet. Summary graph of immunoblot is shown to the right (n=4 samples RD; n=3 IDD, two-tailed unpaired t-test, mean ± SE). Representative image of two independent experiments. (G) Immunoblot of mTORC1 activity in cells treated with 150μM DFO and cultured in leucine-free media for 16 hours. At t=16 hours, cells were supplemented with 400μM L-leucine or Leucyl-Leucine-O-Methyl-Ester (LLOME) for 1 hour. Representative image of three independent experiments. (H) Recruitment of mTORC1 to the lysosome in HEK293T cells treated with 150μM DFO for 18 hours and supplemented with 400μM LLMOE for 1 hour. Representative image of six independent samples. (I) Summary of the results in panel E (n=6 replicates per condition, one-way ANOVA and Tukey’s post-hoc test, mean ± SE). (J) Immunoblot of mTORC1 activity and LAT3 and PAT1 levels in HEK293 cells treated with Lat3 or Pat1 siRNA or with both siRNAs. Representative image of one experiment (K) 14C-Leucine uptake into HEK293T cells transfected with mCherry control or LAT3-HA for 48 hours (n=5 replicates per condition, two-tailed unpaired t-test, mean ± SE). (J) Immunoblot of mTORC1 activity in TSC2 KO HeLa cells stably expressing eGFP or HA-tagged LAT3 and treated with DFO for 18 hours. Representative image of one experiment. Source numerical data and unprocessed blots are available in source data files. * indicates P value < 0.05 when noted for all panels.
Figure 6.
Figure 6.. ID increases global histone methylation
(A) Schematic of lysine demethylation catalyzed by Jmj-C KDMs in the presence of Fe2+, O2, and αKG. (B) Heatmap of results from histone-mass spectrometry (histone-MS) in HEK293T cells treated with DFO at indicated concentrations for 12 hours. (Two representative samples of n=3 independent samples measured in triplicate.) (C, D) Percentage of H3K9 (C) and H3K27 (D) methylation in HEK293T cells in the presence of 150μM DFO from histone-MS experiment in panel B. (n=3 independent samples measured in triplicate, two-tailed unpaired t-test, mean ± SE). (E) Fluorescent confocal microscopy of H3K9me2 immunostaining in HEK293T cells treated with 150μM DFO for 12 hours. Representative image from 5 independent samples. (F) Summary graph of the images shown in panel E (n=667 (control) and n=298 (150μM DFO) cells per group, two-tailed unpaired t-test, mean ± SE). (G) Immunoblot of mTORC1 activity and H3 methylation in HEK293T cells treated with 150μM DFO for 18 hours and supplemented with Fe2+ (delivered as FAC) for the indicated times. Representative image of two independent experiments. (H) Immunoblot of H3K9me2 levels in HepG2 cells treated with DFO for 18 hours at the indicated doses. Data paired with Extended Data Fig. 2K. Representative image of two independent experiments. (I) Immunoblot of mTORC1 activity and H3K9me2 in WT and Arnt KO MEFs treated with 150μM DFO for 12 hours. Representative image of two independent experiments. (J) Donut charts depicting distribution of called H3K9me2 peaks from ChIP-seq performed on HEK293T cells treated with 150μM DFO for 12 hours. (K) Ranking of POLR2A occupancy within gene bodies based on log2FC after treatment with 150μM DFO. (L) Enrichment plots from Gene Set Enrichment Analysis (GSEA) performed on the ranked POLR2A list from panel K. FDR(q) values below 0.25 were considered statistically significant. (M) UCSC genome browser tracks for the LAT3 (top) and PAT1 (bottom) gene loci. POLR2A and H3K9me2 tracks from ChIP-seq analysis were loaded and represented as the difference in normalized reads between the DFO and control groups. Regions of H3K9me2 enrichment in the DFO group are underlined in red. Direction of transcription is indicated by a black arrow. (N) ChIP-PCR of LAT3 and PAT1 in HEK293T cells. Cells treated with 150μM DFO or 250μM IOX1 for 12 hours and vehicle controls were followed by IP of lysates using an antibody against H3K9me2. IgG was used as a negative control for the IP (n=2 replicates per condition). Source numerical data and unprocessed blots are available in source data files. * indicates P value < 0.05 when noted for all panels.
Figure 7.
Figure 7.. ID leads to epigenetic repression of core mTORC1 genes in Arabidopsis thaliana and Saccharomyces cerevisiae
(A) Schematic of conservation of mTOR components and its regulatory proteins among various species. (B) Representative images of post-germination growth of A. thaliana seeds germinating on MS medium containing indicated concentrations of BPD (14 days after stratification) from three independent experiments. (C) Summary graph of seed germination rates in panel B. Representative data from three independent experiments. (D) A. thaliana root growth on MS medium containing 0 (Control) or 400μM BPD for 4 days. Seedlings were transferred 5 days after stratification on BPD-free MS medium. (E) Summary bar graph of root length in panel (D) (n=30 replicates control; n=24 BPD, two-tailed unpaired t-test, mean ± SE). (F) mRNA expression of indicated TOR components and markers of ID and TOR activity in A. thaliana seedlings after treatment with 400μM BPD. Internal control: At ACTIN2 (n=6 replicates for all groups except n=4 for atPYE1 and atFER1, unpaired t-test, mean ± SE). A. thaliana seedlings were transferred at 5 days after stratification on MS medium to MS medium supplemented with or without BPD. Samples were collected 4 days post-transfer. (G) Immunoblot of A. thaliana TOR activity in seedlings treated with 400μM BPD for 48 hours. Representative image of one experiment. (H) mRNA expression of indicated TOR components and markers of ID in S. cerevisiae cells cultured in Fe dropout media containing 100μM BPS for 18 hours. Internal control: ScACT1 (n=4 replicates for all groups except n=3 for TOR2 and LST8, two-tailed unpaired t-test, mean ± SE). (I) Transcriptional rate of TOR1, TOR2 and KOG1 within 180 minutes of iron chelation in S. cerevisiae (n=3 replicates per condition, one-way ANOVA and Tukey’s post-hoc test, mean ± SE, (black *) = P < 0.05 for TOR1, (red *) = P < 0.05 for KOG1). (J) mRNA expression of TOR1 and KOG1 in WT, ΔRph1 and ΔRph1/ΔJhd1/ΔJhd2 S. cerevisiae cells cultured in Fe dropout media containing 100μM BPS for 18 hours. Internal control: Sc ACT1 (n=6 replicates per condition for WT; n=3 ΔRph1 and n=3 ΔRph1/ΔJhd1/ΔJhd2, one-way ANOVA and Tukey’s post-hoc test, mean ± SE). (J) Immunoblot of TOR activity in WT, Δrph1, and Δrph1Δjhd1Δjhd2 cells cultured in Fe dropout media containing 100μM BPS for 18 hours. Representative image of three independent experiments. (L) Summary bar graph of image in panel K (n=3 replicates per condition, one-way ANOVA and Tukey’s post-hoc test, mean ± SE). Source numerical data and unprocessed blots are available in source data files. * indicates P value < 0.05 when noted for all panels.
Figure 8.
Figure 8.. Regulation of mTORC1 activity by ID is mediated through KDM3B.
(A) Schematic presentation of the role of KDM3 and KDM4 family proteins in demethylating histone H3. (B) Immunoblot depicting successful editing of KDM3A and KDM3B in HEK293T cells transfected with CRISPR/Cas9 and indicated sgRNA followed by clonal selection. The experiments were performed in the presence and absence of 150μM DFO for 18 hours. Representative image of two independent experiments. (C) mRNA levels of LAT3 and PAT1 in HEK293 cell controls (Cas9), with KDM3A deletion (sg.3A c.1) and KDM3B deletion (sg.3B c.4) in the presence and absence of 150μM DFO for 18 hours. Internal control: 18S (LAT3: n=11 Cas9 control; n=6 Cas9 150μM DFO; n=11 sg.3A c.1 control; n=7 sg.3A c.1 150μM DFO; n=11 sg.3B c.4 control; n=8 sg.3B c.4 150μM DFO, PAT1: n=11 Cas9 control; n=6 Cas9 150μM DFO; n=16 sg.3A c.1 control; n=7 sg.3A c.1 150μM DFO; n=10 sg.3B c.4 control; n=7 sg.3B c.4 150μM DFO replicates, one-way ANOVA and Tukey’s post-hoc test, mean ± SE). (D) HEK293T cells stained with antibodies against LAMP2 and KDM3B in the presence of 150μM DFO for 18 hours, demonstrating the nuclear localization of KDM3B in ID. Representative image of five independent samples. (E) Quantification of viable WT, KDM3A KO, and KDM3B KO 293T cells over a 48-hour period, (n=7 replicates WT 0hr; n=8 KDM3A KO 0hr; n=8 KDM3B KO 0hr; n=6 WT 24hrs; n=8 KDM3A KO 24hrs; n=8 KDM3B KO 24hrs; n=7 replicates WT 48hrs; n=8 KDM3A KO 48hrs; n=6 KDM3B KO 48hrs;, one-way ANOVA and Tukey’s post-hoc test, mean ± SE). (F) Incorporation of puromycin into elongating peptide chains in HEK293T cells with and without KDM3B deletion and after treatment with 150μM DFO for 18 hours. Representative image of one experiment (G) SDS-PAGE gel of purified N-terminal FLAG-tagged murine KDM3A and human full-length KDM3B overexpressed using a baculoviral overexpression system. Representative image of three independent experiments (H) Enzyme kinetics of KDM3A and KDM3B in the presence of increasing concentrations of iron. (I) Nuclei staining of HEK293T cells with overexpression of HA-KDM3B to demonstrate proper nuclear localization of the protein. Representative image of five independent samples. (J) mRNA levels of LAT3 in response to 150μM DFO and 100μM IOX1 in KDM3B KO HEK293T cells with overexpression of RAP2A, WT KDM3B, and an iron-binding deficient mutant of KDM3B (KDM3BH1560A) Internal control: SNRK (n=4 replicates control RAP2A; n=4 150μM DFO RAP2A; n=3 100μM IOX1 RAP2A; n=4 replicates control HA-3B; n=3 150μM DFO HA-3B; n=4 100μM IOX1 HA-3B; n=3 replicates control HA-3BH1560A; n=4 150μM DFO HA-3BH1560A; n=3 100μM IOX1 HA-3BH1560A, one-way ANOVA and Tukey’s post-hoc test, mean ± SE). (K) Immunoblot of mTORC1 activity in KDM3B KO HEK293T cells with overexpression of WT KDM3B and KDM3BH1560A treated with 100μM IOX1 for 18 hours. Representative image of one experiment. Source numerical data and unprocessed blots are available in source data files. * indicates P value < 0.05 when noted for all panels.

Comment in

References

    1. Efeyan A, Comb WC & Sabatini DM Nutrient-sensing mechanisms and pathways. Nature 517, 302–310, doi:10.1038/nature14190 (2015). - DOI - PMC - PubMed
    1. Lyons TW, Reinhard CT & Planavsky NJ The rise of oxygen in Earth’s early ocean and atmosphere. Nature 506, 307–315, doi:10.1038/nature13068 (2014). - DOI - PubMed
    1. Hedges SB, Blair JE, Venturi ML & Shoe JL A molecular timescale of eukaryote evolution and the rise of complex multicellular life. BMC Evol Biol 4, 2, doi:10.1186/1471-2148-4-2 (2004). - DOI - PMC - PubMed
    1. Hentze MW, Muckenthaler MU, Galy B & Camaschella C Two to tango: regulation of Mammalian iron metabolism. Cell 142, 24–38, doi:10.1016/j.cell.2010.06.028 (2010). - DOI - PubMed
    1. Coffey R & Ganz T Iron homeostasis: An anthropocentric perspective. J Biol Chem 292, 12727–12734, doi:10.1074/jbc.R117.781823 (2017). - DOI - PMC - PubMed

Methods-Only References

    1. Bayeva M et al. mTOR regulates cellular iron homeostasis through tristetraprolin. Cell Metab 16, 645–657, doi:10.1016/j.cmet.2012.10.001 (2012). - DOI - PMC - PubMed
    1. Zhang Y et al. Rapid single-step induction of functional neurons from human pluripotent stem cells. Neuron 78, 785–798, doi:10.1016/j.neuron.2013.05.029 (2013). - DOI - PMC - PubMed
    1. Nehme R et al. Combining NGN2 Programming with Developmental Patterning Generates Human Excitatory Neurons with NMDAR-Mediated Synaptic Transmission. Cell Rep 23, 2509–2523, doi:10.1016/j.celrep.2018.04.066 (2018). - DOI - PMC - PubMed
    1. Simkin D et al. Dyshomeostatic modulation of Ca(2+)-activated K(+) channels in a human neuronal model of KCNQ2 encephalopathy. Elife 10, e64434, doi:10.7554/eLife.64434 (2021). - DOI - PMC - PubMed
    1. Chambers SM et al. Highly efficient neural conversion of human ES and iPS cells by dual inhibition of SMAD signaling. Nat Biotechnol 27, 275–280, doi:10.1038/nbt.1529 (2009). - DOI - PMC - PubMed

Publication types

MeSH terms