. 2023 Oct;15(10):1340-1349.
doi: 10.1038/s41557-023-01289-9. Epub 2023 Sep 25.

The interface of condensates of the hnRNPA1 low-complexity domain promotes formation of amyloid fibrils

Affiliations

The interface of condensates of the hnRNPA1 low-complexity domain promotes formation of amyloid fibrils

Miriam Linsenmeier et al. Nat Chem. 2023 Oct.

Abstract

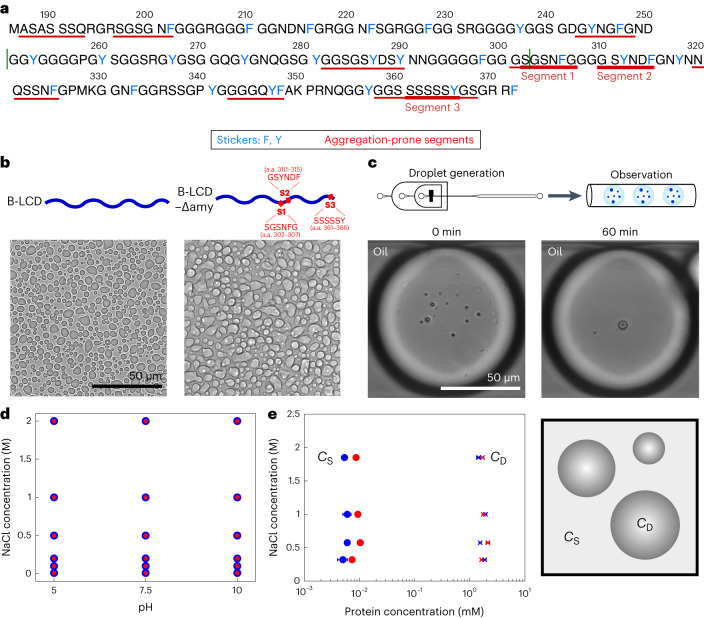
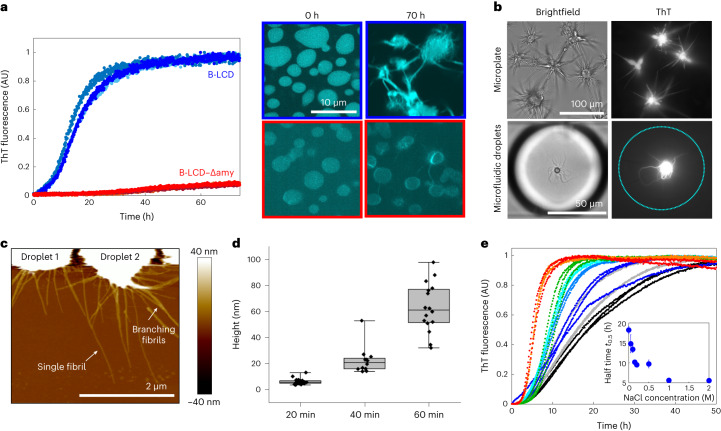
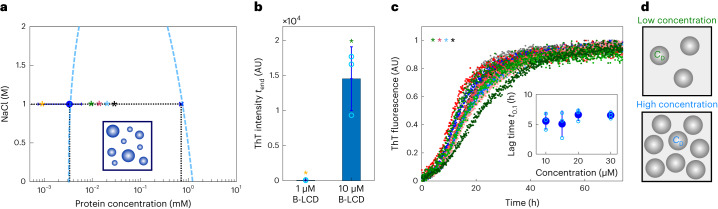
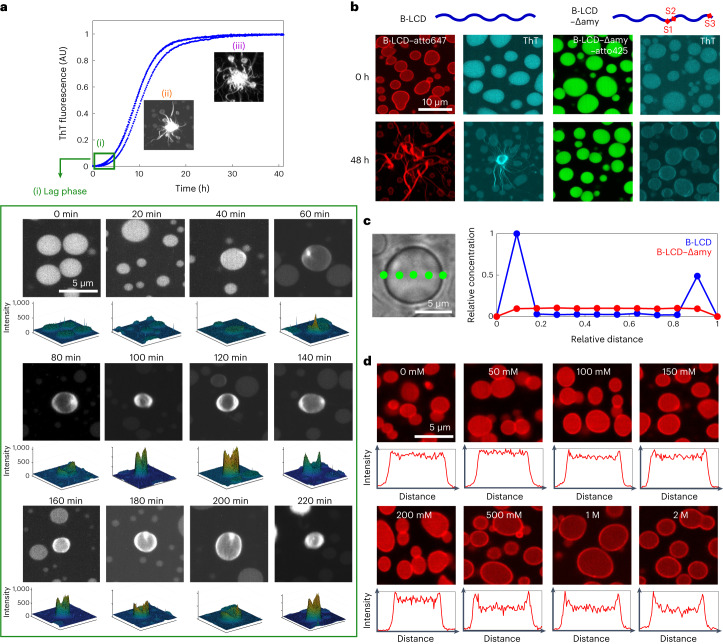
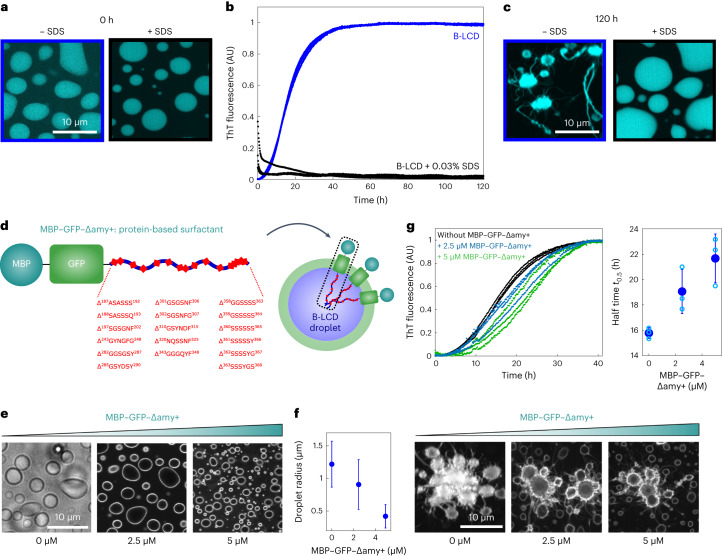
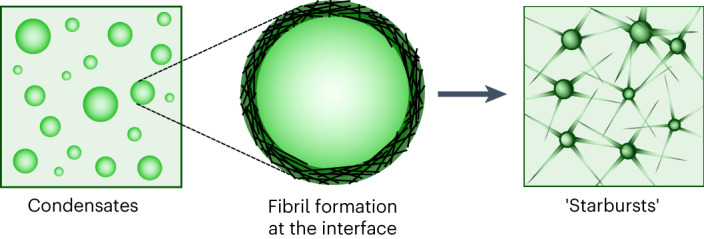
The maturation of liquid-like protein condensates into amyloid fibrils has been associated with several neurodegenerative diseases. However, the molecular mechanisms underlying this liquid-to-solid transition have remained largely unclear. Here we analyse the amyloid formation mediated by condensation of the low-complexity domain of hnRNPA1, a protein involved in amyotrophic lateral sclerosis. We show that phase separation and fibrillization are connected but distinct processes that are modulated by different regions of the protein sequence. By monitoring the spatial and temporal evolution of amyloid formation we demonstrate that the formation of fibrils does not occur homogeneously inside the droplets but is promoted at the interface of the condensates. We further show that coating the interface of the droplets with surfactant molecules inhibits fibril formation. Our results reveal that the interface of biomolecular condensates of hnRNPA1 promotes fibril formation, therefore suggesting interfaces as a potential novel therapeutic target against the formation of aberrant amyloids mediated by condensation.


Conflict of interest statement

The authors declare no competing interests.

Figures

Fig. 1
Fig. 1. LLPS of B-LCD and variant B-LCD–Δamy.
a, Sequence of the LCD of hnRNPA1-B (B-LCD). LCD of hnRNPA1-A (A-LCD) comprises amino acids (a.a.) 186–250 and 303–372 (borders indicated by green lines). Aromatic amino acids involved in LLPS are indicated in blue, while fibril-forming segments are underlined in red. b, Brightfield microscopy images of droplets formed by 30 µM B-LCD and 30 µM B-LCD–Δamy lacking three fibril-forming segments (ΔSGSNFG, ΔGSYNDF and ΔSSSSSY) in 50 mM Tris at pH 7.5 with 200 mM NaCl and 2 mM β-mercaptoethanol. Phase separation of B-LCD and B-LCD–Δamy was repeated independently at least three times with similar results. c, B-LCD droplets are liquid-like and merge in microfluidic water-in-oil droplet compartments until one single condensate is formed within 60 min. Microfluidic experiments have been repeated independently twice yielding similar results. d, Both 30 µM B-LCD (blue circles) and B-LCD–Δamy (red circles) undergo LLPS under a broad range of ionic strength and pH values. Circles indicate presence of LLPS. e, Protein concentrations inside (CD) and outside (CS) the droplets at different ionic strengths are similar for 30 µM B-LCD (blue) and B-LCD–Δamy (red). Error bars represent the standard deviation of the average protein concentration inside and outside the droplets, obtained by measuring three different droplets (for CD) using Raman spectroscopy and three independent samples (for CS) using centrifugation and UV absorbance (280 nm) at each NaCl concentration. When not visible, the error bars are smaller than the symbol. Source data
Fig. 2
Fig. 2. Liquid–amyloid transition of B-LCD is governed by fibril-forming segments.
a, Fluorescence ThT signal over time for B-LCD (blue) and B-LCD–Δamy (red). Re-scan confocal microscopy images at time zero and after 70 h of incubation for the two constructs. Each curve represents the normalized ThT fluorescence of one independent sample. b, ThT-stainable star-shaped aggregates formed by B-LCD in microplates and in microfluidic water-in-oil droplets imaged in brightfield and by widefield fluorescence microscopy after 6 days of incubation. Starburst formation of B-LCD has been repeated at least five times in microplates and twice in a microfluidic set-up with similar results. c, AFM of star-shaped aggregates formed by B-LCD after 20 min. d, Increase of fibril height over 60 min after formation, extracted from AFM images. Box plots include the median fibril height, the interquartile range and the upper and lower quartile whiskers. For each timepoint, the height of 11–28 fibrils of 3–4 droplets was extracted. e, Acceleration of amyloid formation in 30 µM B-LCD sample with increasing NaCl (0 mM NaCl, black; 50 mM NaCl, grey; 100 mM NaCl, blue; 150 mM NaCl, light blue; 200 mM NaCl, cyan; 500 mM NaCl, green; 1 M NaCl, orange; 2 M NaCl, red). Inset: average half time t0.5 values as a function of NaCl concentration. Error bars represent the standard deviation of three independent samples. Source data
Fig. 3
Fig. 3. Condensation of B-LCD accelerates amyloid formation.
a, Protein concentration inside (CD, blue cross) and outside (CS, blue circle) the condensates, measured as in Fig. 1. Asterisks indicate initial protein concentration in kinetic experiments in b and c: 1 µM (yellow), 10 µM (green), 15 µM (red), 20 µM (blue) and 30 µM (black). Error bars represent the standard deviation of the average protein concentration inside and outside the droplets, obtained by measuring three different droplets (for CD) and three independent samples (for CS) at each C0. The blue dashed line represents a guide to the eyes and indicates approximated upper and lower phase boundaries considering the total concentration of salt as a proxy for the intermolecular interaction parameter. b, Average ThT fluorescence intensity value of three replicates of 1 µM and 10 µM B-LCD solutions after 7 days incubation respectively below and above the critical concentration of LLPS (Cc = 2.5 µM). Error bars represent the standard deviation of the three replicates. c, Normalized ThT kinetic profiles corresponding to the initial protein concentrations C0 in a. The inset shows the average lag times t0.1 at various initial protein concentrations C0. Error bars represent standard deviation of three independent samples. d, Droplets formed at low and high initial B-LCD concentration exhibit similar internal protein concentration (CD) but increase in number when the initial protein concentration is increased. Source data
Fig. 4
Fig. 4. Formation of a ThT-positive protein-rich rim at the condensate interface precedes amyloid formation.
a, Re-scan confocal fluorescence microscopy images collected along the ThT profile. During the initial lag phase (0–40 min) we observed the formation of the droplets and the uptake of ThT in their interior (i). Over time (60–220 min), a ThT-positive rim appeared on the droplet surface. Three-dimensional intensity profiles are depicted below each image, showing higher ThT intensity value at the droplet edge. During the growth phase, star-shaped aggregates were formed from the droplets (ii, iii). Micrographs in i–iii are representative images taken at each timepoint. b, Re-scan confocal fluorescence microscopy images of B-LCD labelled with atto647 at time 0 and after 48 h incubation. The rim at time 0 is not visible by ThT staining, while after 48 h the high ThT signal at the interface indicates the presence of β-sheet-rich structures. By contrast, droplets formed by B-LCD–Δamy did not exhibit accumulation of molecules or fibrils at the droplet interface. c, Representative protein concentration profile along the cross-section of one individual B-LCD droplet and one individual B-LCD–Δamy droplet as measured by Raman spectroscopy, confirming the increase in protein concentration at the droplet surface. d, Re-scan confocal fluorescence microscopy images of samples in a after 3 h of incubation. The rim is more evident for samples at higher NaCl concentrations, which exhibit faster kinetics of amyloid formation (Fig. 2e). The intensity profiles show the normalized droplet intensity as a function of the normalized droplet edge-to-edge distance for one representative droplet. Labelling and imaging of B-LCD and B-LCD–Δamy was performed three times yielding similar results. Source data
Fig. 5
Fig. 5. Targeting the surface of condensates inhibits amyloid formation.
ac, The addition of 0.03% SDS to a 30 µM B-LCD solution did not affect LLPS (a) but prevented the increase of ThT signal over time (b) as well as the formation of ThT-positive rims and star-shaped aggregates after 120 h, as shown by re-scan confocal microscopy images (c). Analysis of B-LCD droplets and starbursts in absence and presence of SDS was repeated three times yielding similar results. d, Design of a protein-based surfactant (MBP–GFP–Δamy+) consisting of soluble MBP, GFP and a B-LCD variant lacking all predicted steric zippers (Δamy+). e, Re-scan confocal fluorescence microscopy images showing accumulation of the protein-based surfactant molecules at the droplet surface. The fluorescent signal is originating from the GFP domain of the protein surfactant. Images were acquired at time 0. Experiments were independently repeated three times with similar results. f, Decrease of the average droplet size with increasing MBP–GFP–Δamy+ concentration. Error bars represent the standard deviation of sizes of 1,128 (0 µM MBP–GFP–Δamy+), 1,561 (2.5 µM MBP–GFP–Δamy+) and 1,020 (5 µM MBP–GFP–Δamy+) droplets from three independent samples. g, In addition to changing the size of the condensates, increasing concentrations of the protein-based surfactant delays amyloid formation inside condensates. Average half times t0.5 were extracted from the ThT profiles as a function of the MBP–GFP–Δamy+ protein surfactant. Black, 0 µM MBP–GFP–Δamy+; blue, 2.5 µM MBP–GFP–Δamy+; green, 5 µM MBP–GFP–Δamy+. Error bars represent the standard deviation of three independent samples. Re-scan confocal fluorescence microscopy images of samples after 40 h of incubation with increasing protein surfactant concentration. Source data
Fig. 6
Fig. 6. Promotion of amyloid formation at the interface of condensates.
Schematic illustration of amyloid formation promoted at the interface of condensates of the LCD of hnRNPA1.

Similar articles

Cited by

References

    1. Banani SF, Lee HO, Hyman AA, Rosen MK. Biomolecular condensates: organizers of cellular biochemistry. Nat. Rev. Mol. Cell Biol. 2017;18:285–298. doi: 10.1038/nrm.2017.7. - DOI - PMC - PubMed
    1. Wheeler RJ, Hyman AA. Controlling compartmentalization by non-membrane-bound organelles. Philos. Trans. R. Soc. B. 2018;26:373. - PMC - PubMed
    1. Schmit JD, Feric M, Dundr M. How hierarchical interactions make membraneless organelles tick like clockwork. Trends Biochem. Sci. 2021;46:525–534. doi: 10.1016/j.tibs.2020.12.011. - DOI - PMC - PubMed
    1. Alshareedah I, Moosa MM, Pham M, Potoyan DA, Banerjee PR. Programmable viscoelasticity in protein–RNA condensates with disordered sticker-spacer polypeptides. Nat. Commun. 2021;12:6620. doi: 10.1038/s41467-021-26733-7. - DOI - PMC - PubMed
    1. Elbaum-Garfinkle S, et al. The disordered P granule protein LAF-1 drives phase separation into droplets with tunable viscosity and dynamics. Proc. Natl Acad. Sci. USA. 2015;112:7189–7194. doi: 10.1073/pnas.1504822112. - DOI - PMC - PubMed