

Geometrically frustrated interactions drive structural complexity in amorphous calcium carbonate
- PMID: 37749235
- PMCID: PMC10774122
- DOI: 10.1038/s41557-023-01339-2
Geometrically frustrated interactions drive structural complexity in amorphous calcium carbonate
Abstract
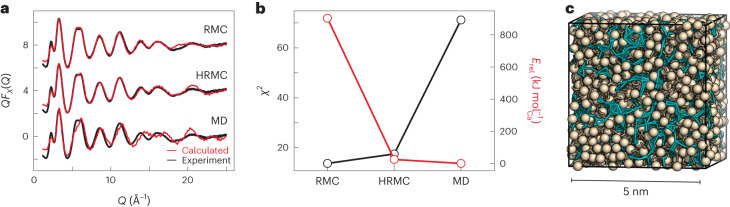
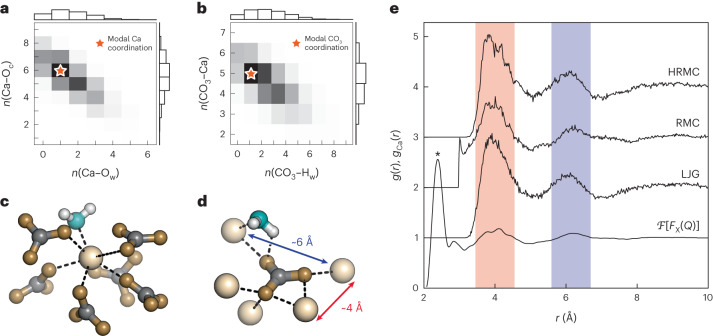
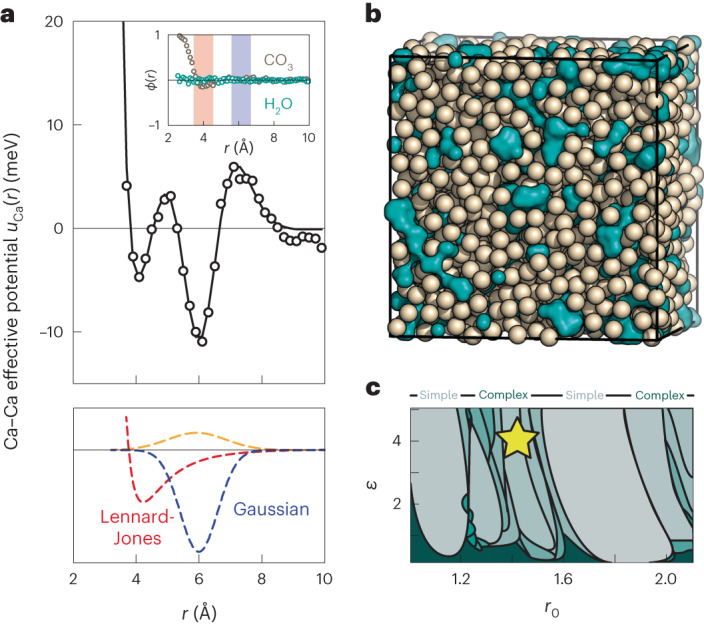
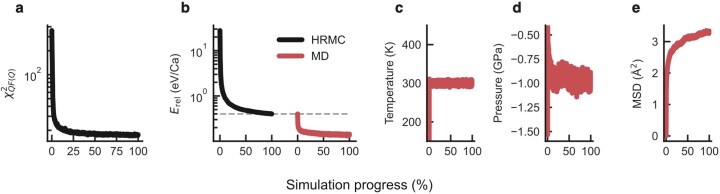
Amorphous calcium carbonate is an important precursor for biomineralization in marine organisms. Key outstanding problems include understanding the structure of amorphous calcium carbonate and rationalizing its metastability as an amorphous phase. Here we report high-quality atomistic models of amorphous calcium carbonate generated using state-of-the-art interatomic potentials to help guide fits to X-ray total scattering data. Exploiting a recently developed inversion approach, we extract from these models the effective Ca⋯Ca interaction potential governing the structure. This potential contains minima at two competing distances, corresponding to the two different ways that carbonate ions bridge Ca2+-ion pairs. We reveal an unexpected mapping to the Lennard-Jones-Gauss model normally studied in the context of computational soft matter. The empirical model parameters for amorphous calcium carbonate take values known to promote structural complexity. We thus show that both the complex structure and its resilience to crystallization are actually encoded in the geometrically frustrated effective interactions between Ca2+ ions.
© 2023. The Author(s).
Conflict of interest statement
The authors declare no competing interests.
Figures
Similar articles
-
Structure of an amorphous calcium carbonate phase involved in the formation of Pinctada margaritifera shells.Proc Natl Acad Sci U S A. 2022 Nov 8;119(45):e2212616119. doi: 10.1073/pnas.2212616119. Epub 2022 Nov 2. Proc Natl Acad Sci U S A. 2022. PMID: 36322756 Free PMC article.
-
Non-stoichiometry Governs the Pathway from Amorphous to Crystalline Calcium Carbonate.J Am Chem Soc. 2025 May 21;147(20):17181-17189. doi: 10.1021/jacs.5c02800. Epub 2025 May 8. J Am Chem Soc. 2025. PMID: 40338206
-
Structural characterization of amorphous calcium carbonate-binding protein: an insight into the mechanism of amorphous calcium carbonate formation.Biochem J. 2013 Jul 15;453(2):179-86. doi: 10.1042/BJ20130285. Biochem J. 2013. PMID: 23646881
-
Calcium carbonate polyamorphism and its role in biomineralization: how many amorphous calcium carbonates are there?Angew Chem Int Ed Engl. 2012 Nov 26;51(48):11960-70. doi: 10.1002/anie.201203125. Epub 2012 Nov 4. Angew Chem Int Ed Engl. 2012. PMID: 23124964 Review.
-
Biologically formed amorphous calcium carbonate.Connect Tissue Res. 2003;44 Suppl 1:214-8. Connect Tissue Res. 2003. PMID: 12952200 Review.
Cited by
-
Investigating the metastability of amorphous calcium carbonate by droplet microfluidics experiments using machine learning.Sci Rep. 2025 Jun 20;15(1):20178. doi: 10.1038/s41598-025-05984-0. Sci Rep. 2025. PMID: 40542055 Free PMC article.
-
Material-Driven Therapeutics: Functional Nanomaterial Design Paradigms Revolutionizing Osteosarcoma Treatment.J Funct Biomater. 2025 Jun 5;16(6):213. doi: 10.3390/jfb16060213. J Funct Biomater. 2025. PMID: 40558899 Free PMC article. Review.
-
Amorphous aggregates with a very wide size distribution play a central role in crystal nucleation.Chem Sci. 2024 Jul 4;15(31):12420-12430. doi: 10.1039/d4sc00452c. eCollection 2024 Aug 7. Chem Sci. 2024. PMID: 39118639 Free PMC article.
-
When can we trust structural models derived from pair distribution function measurements?Faraday Discuss. 2025 Jan 8;255(0):311-324. doi: 10.1039/d4fd00106k. Faraday Discuss. 2025. PMID: 39258486 Free PMC article.
-
Experiment-Driven Atomistic Materials Modeling: A Case Study Combining X-Ray Photoelectron Spectroscopy and Machine Learning Potentials to Infer the Structure of Oxygen-Rich Amorphous Carbon.J Am Chem Soc. 2024 May 29;146(21):14645-14659. doi: 10.1021/jacs.4c01897. Epub 2024 May 15. J Am Chem Soc. 2024. PMID: 38749497 Free PMC article.
References
-
- Gebauer D, Völkel A, Cölfen H. Stable prenucleation calcium carbonate clusters. Science. 2008;322:1819–1822. - PubMed
-
- Aizenberg J, Lambert G, Weiner S, Addadi L. Factors involved in the formation of amorphous and crystalline calcium carbonate: a study of an ascidian skeleton. J. Am. Chem. Soc. 2002;124:32–39. - PubMed
-
- Raz S, Hamilton PC, Wilt FH, Weiner S, Addadi L. The transient phase of amorphous calcium carbonate in sea urchin larval spicules: the involvement of proteins and magnesium ions in its formation and stabilization. Adv. Funct. Mater. 2003;13:480–486.
-
- Aizenberg J. Crystallization in patterns: a bio-inspired approach. Adv. Mater. 2004;16:1295–1302.
-
- Addadi L, Raz S, Weiner S. Taking advantage of disorder: amorphous calcium carbonate and its roles in biomineralization. Adv. Mater. 2003;15:959–970.
Grants and funding
LinkOut - more resources
Full Text Sources
Miscellaneous
