. 2023 Oct;26(10):1701-1712.
doi: 10.1038/s41593-023-01435-z. Epub 2023 Sep 25.

IL-12 sensing in neurons induces neuroprotective CNS tissue adaptation and attenuates neuroinflammation in mice

Affiliations

IL-12 sensing in neurons induces neuroprotective CNS tissue adaptation and attenuates neuroinflammation in mice

Myrto Andreadou et al. Nat Neurosci. 2023 Oct.

Abstract

Interleukin-12 (IL-12) is a potent driver of type 1 immunity. Paradoxically, in autoimmune conditions, including of the CNS, IL-12 reduces inflammation. The underlying mechanism behind these opposing properties and the involved cellular players remain elusive. Here we map IL-12 receptor (IL-12R) expression to NK and T cells as well as neurons and oligodendrocytes. Conditionally ablating the IL-12R across these cell types in adult mice and assessing their susceptibility to experimental autoimmune encephalomyelitis revealed that the neuroprotective role of IL-12 is mediated by neuroectoderm-derived cells, specifically neurons, and not immune cells. In human brain tissue from donors with multiple sclerosis, we observe an IL-12R distribution comparable to mice, suggesting similar mechanisms in mice and humans. Combining flow cytometry, bulk and single-nucleus RNA sequencing, we reveal an IL-12-induced neuroprotective tissue adaption preventing early neurodegeneration and sustaining trophic factor release during neuroinflammation, thereby maintaining CNS integrity in mice.


Conflict of interest statement

The authors declare no competing interests.

Figures

Fig. 1
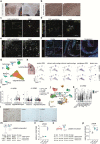
Fig. 1. Leukocytes are dispensable for IL-12-mediated tissue protection in experimental autoimmune encephalomyelitis.
a, Schematic illustrating Il12rb2del/del and Il12rb2fl/fl control mice. b,c, EAE course (b) and maximum EAE scores (c) in Il12rb2del/del (n = 33, m/f) and Il12rb2fl/fl mice (n = 25, m/f). Data were pooled from four experiments. Mixed-effects model, Sidak’s post hoc test (**P = 0.0063, ****P ≤ 0.0001, left to right) in b; two-tailed Mann–Whitney test (***P = 0.0001) in c. d, Schematic illustrating Cd4Cre/+Il12rb2fl/fl and Il12rb2fl/fl control mice. e,f, EAE course (e) and maximal EAE scores (f) in Cd4Cre/+Il12rb2fl/fl (n = 12, m/f) and littermate controls (n = 11, m/f). Data were pooled from two experiments. Mixed-effects model, Bonferroni post hoc test (P > 0.9999) in e; two-tailed Mann–Whitney test (P = 0.6514) in f. g, Il12rb2 mRNA relative expression in FACS-isolated CNS NK cells and CD3+ T cells of Cd4Cre/+Il12rb2fl/fl (n = 4; f), littermate control Il12rb2fl/fl (n = 4; f) and Il12rb2del/del (n = 3; f) mice at 18 d.p.i. Data represent one experiment (unpaired two-tailed t-test, P = 0.9131; ***P = 0.002; ***P = 0.0006; **P = 0.0023, left to right). h,i, EAE course (h) and maximum EAE score (i) in bone marrow chimeras 6 weeks after immune reconstitution. Data were pooled from two experiments; Il12rb2fl/fl → Il12rb2fl/fl (n = 9, m/f), Il12rb2del/del → Il12rb2fl/fl (n = 11, m/f), Il12rb2fl/fl → Il12rb2del/del (n = 14, m/f) and Il12rb2del/del → Il12rb2del/del (n = 10, m/f). Two-way ANOVA, Bonferroni post hoc test (*P = 0.0234; **P = 0.0017, ***P ≤ 0.0005) in h; two-tailed Mann–Whitney test (*P = 0.0293; **P = 0.0011, *P = 0.0277; **P = 0.0023; P = 0.1855, left to right) in i. j, Absolute numbers of CNS CD45+CD44+CX3CR1Ly6GTCRβ+CD8CD4+ T cells and CD45+CD44+CX3CR1LY6GTCRβNK1.1SiglecFLy6C+CD11b+MHCII+ MdCs at 23 d.p.i. as measured by FC. Data are representative for two experiments; Il12rb2fl/fl → Il12rb2fl/fl (n = 5, m/f), Il12rb2del/del → Il12rb2fl/fl (n = 6, m/f), Il12rb2fl/fl → Il12rb2del/del (n = 8, m/f) and Il12rb2del/del → Il12rb2del/del (n = 5, m/f). Left graph: unpaired two-tailed t-test, *P = 0.0299; **P = 0.0049, ****P ≤ 0.0001; **P = 0.009, left to right; right graph: unpaired two-tailed t-test, *P = 0.0293; *P = 0.0261; *P = 0.0221; P = 0.4688; left to right. k, Schematic illustrating Vav1Cre/+Il12rb2fl/fl and Il12rb2fl/fl control mice. l,m, EAE course (l) and maximal EAE scores (m) in Vav1Cre/+Il12rb2fl/fl (n = 5, m/f) and littermate controls (n = 9, m/f). Data were pooled from two experiments. Mixed-effects model, Bonferroni post hoc test (P > 0.9999) in l; two-tailed Mann–Whitney test (P = 0.6349) in m. n, Il12rb2 mRNA expression of FACS-isolated CNS NK cells and CD3+ T cells of Vav1Cre/+Il12rb2fl/fl (n = 3; m) mice and littermate controls (n = 3; m) at 19 d.p.i. (unpaired two-tailed t-test, *P = 0.0370; *P = 0.0224, left to right). Each symbol represents one animal. Data are shown as mean ± s.e.m. NS, not significant; m, male; f, female. Source data
Fig. 2
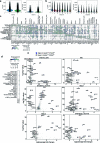
Fig. 2. Neurons and oligodendrocytes are molecularly equipped to sense IL-12.
a, Schematic of the mouse cerebellum showing the region represented by the following images. bd, Immunostaining of β-gal+Calbindin+ and β-gal+NeuN+ cells in the steady-state cerebellum of Il12rb2LacZ/LacZ reporter mice (n = 6 mice, m/f; data are representative for one of three experiments) and β-galNeuN+ cells in control C57BL/6 mice. e, Schematic of the mouse hippocampus showing region represented by the following images. fh, Immunostaining of β-gal+NeuN+, βgalGFAP+ and β-gal+ CC1+ cells in the hippocampal and cortical region of steady-state Il12rb2LacZ/LacZ reporter mice (n = 5 mice, m/f; data are representative for one of three experiments) and β-galNeuN+ cells in control C57BL/6 mice. In bd and fh, scale bars indicate 50 μm or 100 μm. Insets are enlargements of outlined regions in the original images. i, Schematic of the mouse cerebrum showing the region represented by the following images. j, Multiplexed single-molecule RNA fluorescence in situ hybridization (RNAscope) in steady-state C57BL/6 mouse cerebral tissue showing Il12rb2 gene coexpression in Map2+Rbfox3+ neurons and Il12rb1 coexpression in Sox10+ oligodendrocytes. Scale bars, 25 μm. k, Il12rb1 and Il12rb2 mRNA expression of CD45CD11bO4ACSA-2+astrocytes, CD45loCD44loCD11b+CX3CR1+ microglia, CD45CD11bACSA-2 O4+ oligodendrocytes, NK cells and CD3+ T cells isolated by FACS from the CNS of C57BL/6 mice at peak EAE (n = 4–10, m/f; number of dots represents the number of biologically independent replicates per sample; 14 d.p.i.). Data are shown as the mean ± s.e.m. Kruskal–Wallis test, corrected Dunn’s test (**P = 0.0012; ** P = 0.0016; ***P = 0.0009; *P = 0.0391; **P = 0.0052, left to right). l, Il12rb1 and Il12rb2 mRNA expression of Hoechst+ Olig2+ oligodendrocyte nuclei and Hoechst+ NeuN+ neuronal nuclei isolated by FANS from the CNS of C57BL/6 mice (n = 5–7; number of dots represents the number of biologically independent replicates per sample) at peak EAE (14 d.p.i.). Data are shown as mean ± s.e.m. (unpaired two-tailed Mann–Whitney test, **P = 0.0293, P = 0.1282, left to right). m, Schematic of human MS brain lesions (created with BioRender.com). n, Representative immunofluorescence of IL-12Rβ2-expressing MAP2+ neurons in brain tissue samples from individuals with MS (n = 3; data representative for one of three experiments). Scale bars, 20 μm and 100 μm. Lower images depict enlargements of outlined regions in the original (top) images. Gcl, granule cell layer; ml, molecular layer; pcl, Purkinje cell layer; sg (DG-sg), dentate gyrus, granule cell layer; po (DG-po), dentate gyrus, polymorph layer; mo (DG-mo), dentate gyrus, molecular layer; m, male; f, female. Source data
Fig. 3
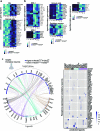
Fig. 3. Neuroectodermal IL-12-sensing attenuates CNS immunopathology.
a, Schematic of NestinCre/+Il12rb2fl/fl and Il12rb2fl/fl control mice. b, Il12rb2 expression in FANS-isolated Hoechst+Olig2+ oligodendrocyte and Hoechst+NeuN+ neuronal nuclei from NestinCre/+Il12rb2fl/fl (n = 7, m/f) and Il12rb2fl/fl control mice (n = 7, m/f) at peak EAE (13 d.p.i.). Data are pooled from two experiments (two-tailed Mann–Whitney test, ***P = 0.0006; ***P = 0.0006, left to right). c,d, EAE course (c) and maximal EAE scores (d) of NestinCre/+Il12rb2fl/fl (n = 8, m/f), Il12rb2fl/fl littermate controls (n = 10, m/f), Il12rb2del/del (n = 7, m/f) and NestinCre/+Il12rb2+/+ (n = 9, m/f) mice. Data were pooled from two experiments. Mixed-effects model with Bonferroni post hoc test between Il12rb2fl/fl and NestinCre/+Il12rb2fl/fl mice (*P = 0.0209; **P = 0.0045; *P = 0.0288; **P = 0.0046; ***P = 0.0005; **P = 0.0092; *P = 0.0221; **P = 0.0014; *P = 0.0131; left to right) in c and two-tailed Mann–Whitney test (P > 0.9999; ****P < 0.0001; **P = 0.0022, left to right) in d. e, UMAP of 60,000 cells normalized to sample size and proportional to the absolute cell number per group of NestinCre/+Il12rb2fl/fl (n = 11, m/f), Il12rb2fl/fl (n = 7, m/f), Il12rb2del/del (n = 9, m/f) at peak EAE (13 d.p.i.). f, Heatmap depicting median marker expression per cluster. g, Cell counts of CNS CD4+ T cells and MdCs corresponding to e. Data were pooled from two experiments (unpaired two-tailed t-test; *P = 0.03681; **P = 0.00203; *P = 0.02085; **P = 0.00151, left to right). h, Dot plot depicting fold change expression and P value of the indicated markers per population. i, Cohen’s d effect size for the expression of the indicated activation molecules in microglia from NestinCre/+Il12rb2fl/fl and Il12rb2fl/fl mice. j, Representative WM staining with FluoroMyelin Green dye (top, thoracic; bottom, lumbar) and the percentage of myelin loss quantification in axial spinal cord sections at 19 d.p.i. in NestinCre/+Il12rb2fl/fl and control mice (n = 4 mice per group). Insets highlight active, demyelinating inflammatory lesions with accumulation of DAPI+Iba1+ phagocytes. Individual lesions are pointed out by arrowheads. Scale bars, 50 μm and 200 μm. Unpaired two-tailed t-test, ****P < 0.0001). k, Kinetics of IL-12 (IL-12/23p40) concentration (ELISA) in the brain and spinal cord in C57BL/6 mice n = 2–5 per time point in EAE, m/f; number of dots represents the number of biologically independent replicates per sample. l,m, Il12a (l) and Il12b (m) mRNA expression in FACS-isolated CNS CD45+CD44+CD11b+Ly6GLy6C+ MdCs (n = 7) and CD45loCD44loCD11b+CX3CR1+ microglia (n = 4) of C57BL/6 mice (m/f) at disease onset (10 d.p.i.). Unpaired two-tailed t-test, P = 0.053; *P = 0.0137, left to right. n,o, IL-12 protein in brain and spinal cord lysates (n) and clinical score of NestinCre/+Il12rb2fl/fl (n = 4, m) and littermate control mice (n = 4; m) at 10 d.p.i. (o). Two-tailed Mann–Whitney test, P = 0.1335; P = 0.5916; P = 0.7429; left to right). Each symbol represents one animal. Data are shown as the mean ± s.e.m.; m, male; f, female. Source data
Fig. 4
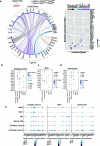
Fig. 4. IL-12 signaling promotes neuronal survival, homeostasis and trophic support to oligodendrocytes in the inflamed murine CNS.
Nuclei were isolated from pooled cerebellum, brainstem (dissected from one brain hemisphere) and cervical spinal cord from Il12rb2fl/fl and NestinCre/+Il12rb2fl/fl male mice (n = 4 per genotype) at the onset of EAE (10 d.p.i.). Nuclei were lysed, purified by FANS selecting for the Hoechst+ fraction and used for snRNA-seq. a, snRNA-seq clustering of 133,151 nuclei by cell type labeled on the basis of known lineage markers and visualized as a UMAP. Each dot corresponds to a single nucleus and each color to a cell-type cluster. bd, Mean frequencies of cell clusters (b), average fold change of cluster abundance (c) and number of DEGs per cluster (d) between NestinCre/+Il12rb2fl/fl and Il12rb2fl/fl mice. e,f, Dot plots showing differential expression of hallmark genes across neurons and oligodendrocytes. Dot size indicates significance and color indicates log fold change between NestinCre/+Il12rb2fl/fl and Il12rb2fl/fl mice in the respective cell types. g,h, Average fold change of manually selected gene signatures for hyperinflammation and neuroprotection (Supplementary Table 2) between NestinCre/+Il12rb2fl/fl and Il12rb2fl/fl mice across cell types. i, Schematic of the receptor–ligand interaction analysis (NicheNet; created with BioRender.com). Senders were defined by their ability to sense IL-12 (expression of Il12rb1 and/or Il12rb2 transcripts) and the magnitude of their differential gene expression (cutoff > 35 DEGs). Both autocrine and paracrine ligand–receptor interactions were considered. j, Circos plots showing links between unique ligands from senders (ribbon color indicates subcluster of origin for each ligand; multiple sender cells are indicated by black ribbon) and predicted associated DEGs in granule cells. Transparency indicates interaction strength, and the ribbon thickness is proportional to the ligand’s regulatory potential. Heatmap (right) displaying potential receptors expressed in granule cells associated with each predicted ligand. Differential gene expression in eh was tested using a two-sided Wilcoxon rank-sum test and applying a Benjamini–Hochberg correction and is presented in Supplementary Table 1. OPC, oligodendrocyte progenitor cell; VLMC, vascular and leptomeningeal cell. UBC, unipolar brush cells.
Fig. 5
Fig. 5. IL-12 engagement in neurons, but not in oligodendrocytes, elicits CNS tissue-protective features during neuroinflammation.
a, Schematic of Plp1CreER/+Il12rb2fl/fl and Il12rb2fl/fl control mice. b, Il12rb2 mRNA expression of CD45CD11bACSA-2CD140aGalC+ oligodendrocytes and CD45CD11bACSA-2+ astrocytes isolated by FACS from the CNS of Plp1CreER/+ Il12rb2fl/fl (n = 6, m/f) and littermate controls (n = 6, m/f) at 16 d.p.i. Data show the mean ± s.e.m. (data are representative for one of two experiments; unpaired two-tailed t-test, ****P ≤ 0.0001; P = 0.5967, left to right). c, Il12rb2 mRNA expression of Hoechst+Olig2+ oligodendrocyte nuclei and Hoechst+NeuN+ neuronal nuclei isolated by FANS from the CNS of Plp1CreER/+Il12rb2fl/fl (n = 4, f) and littermates (n = 5; f) at late-stage EAE (16 d.p.i.). Data show the mean ± s.e.m. (data are representative for one of two experiments; two-tailed Mann–Whitney test, *P = 0.0159; P = 0.9048, left to right). d,e, Clinical disease course (d) and individual maximal EAE scores (e) of MOG emulsified in complete Freund’s adjuvant (CFA) induced EAE in Plp1CreER/+Il12rb2fl/fl (n = 10; m/f), their littermate controls (n = 12, m/f; pink group treated with tamoxifen), NestinCre/+Il12rb2fl/fl (n = 8, m/f) and littermate Il12rb2fl/fl control mice (n = 10, m/f; gray group not treated with tamoxifen). Data were pooled from two independent experiments shown as the mean ± s.e.m. Mixed-effects model with Bonferroni post hoc test between Plp1CreER/+Il12rb2fl/fl and NestinCre/+Il12rb2fl/fl mice (*P = 0.044; *P = 0.0324; *P = 0.0462; *P = 0.0793; *P = 0.0193; *P = 0.0457; P = 0.3357, left to right) in d and unpaired two-tailed Mann–Whitney test (P = 0.632; P = 0.1927; ****P ≤ 0.0001; left to right) in e. f, Primary neuronal cultures were incubated with IL-12 (30 ng ml−1 and 100 ng ml−1) for 18 h and subjected to bulk RNAseq (n = 5 replicates per group). g, PCA of bulk RNAseq data shows a dose-dependent effect of IL-12 on neurons. h, Heatmap depicting DEGs (FDR < 0.05) between untreated and IL-12-treated neurons. i, Modular differential gene coexpression analysis. Shown is module activity across condition and global gene interaction network of module 2 (neuroprotective module) depicting the most connected genes (hubs). j, Overrepresentation analysis depicting the biological components of the neuroprotective module. Overrepresentation was tested using a hypergeometric test and applying a Benjamini–Hochberg correction; m, male; f, female. Source data
Extended Data Fig. 1
Extended Data Fig. 1. Loss of IL-12 signalling in leukocytes does not affect EAE outcome.
(a) Cumulative EAE score/day in Il12rb2del/del (n = 33, m/f) and Il12rb2fl/fl mice (n = 25, m/f). Data are pooled from 4 experiments (unpaired two –tailed t- test, ***P = 0.0004). (b) % pSTAT4+ CD4+ splenocytes from steady-state CD4Cre/+Il12rb2fl/fl and littermate controls (n = 3; m/f) determined by FC. Data are from one experiment (two-way ANOVA, Bonferroni post hoc test, P > 0.9999; P > 0.9999; **P = 0.0011, left to right). (c) Cumulative EAE score/day in CD4Cre/+Il12rb2fl/fl (n = 12, m/f) and littermate controls (n = 11, m/f). Data are pooled from 2 experiments (unpaired two-tailed t-test, P = 0.3786). (d) Schematic for Ncr1Cre/+Il12rb2fl/fl strain (e) EAE course in Ncr1Cre/+ (n = 5, f), Nkp46Cre/+Il12rb2fl/wt (n = 7, f) and Ncr1Cre/+Il12rb2fl/fl mice (n = 5, f). Data are pooled from two experiments (Mixed-effects model, Bonferroni post hoc test, P > 0.9999). (f) Il12rb2 mRNA expression of FACS isolated NK cells and CD3+ splenocytes of Ncr1Cre/+ Il12rb2fl/fl (n = 4), littermate Ncr1Cre/+ Il12rb2fl/wt controls (n = 4) and Il12rb2del/del (n = 3) mice at 17 dpi. Data represent one experiment (unpaired two-tailed t-test, ***P = 0.0005; **P = 0.0092; P = 0.6154; **P = 0.0011, left to right). (g) Cumulative EAE score/day (Unpaired two –tailed t- test (P = 0.9492; P = 0.606; P = 0.698, left to right)) and (h) maximal EAE score (two-tailed Mann-Whitney test (P = 0.8864; P = 0.0952; P = 0.8232, left to right) corresponding to (e). (i) C57BL/6 mice were treated with anti-NK1.1 depleting antibody or PBS at 0, 2, 8 and 14 dpi. (j) CNS and splenic NK cell depletion was assessed by FC at day 15 p.i. Shown is % live CD4CD8CD3B220Ly6GCD44+CXCR1CD49b+ NK cells in (n = 8, m/f) anti-NK1.1 and (n = 7, m/f) PBS-treated mice. Data represent one experiment (unpaired two –tailed t-test, **P = 0.0039; ****P < 0.0001, left to right). (k) Clinical EAE course, (l) cumulative EAE score/day and (m) maximal EAE score in anti-NK1.1- (n = 15, m/f) and PBS-treated mice (n = 16, m/f). Data are pooled from 2 experiments (Mixed-effects model, Bonferroni post hoc test (P > 0.9999) in (k); unpaired two-tailed t-test (P = 0.8076) in (l); two-tailed Mann-Whitney test (P = 0.8362) in (m). (n) %pSTAT4+ CD45+cells upon IL-12 stimulation of splenocytes from steady-state Vav1Cre/+Il12rb2fl/fl and littermate controls determined by FC. Data represent one experiment (n = 3 per group) (two-way ANOVA, Bonferroni post hoc test, P > 0.9999; P > 0.9999; ****P < 0.0001, left to right). (o) Cumulative EAE score/day of Vav1Cre/+Il12rb2fl/fl (n = 5, m/f) and littermate controls (n = 9, m/f). The data are pooled from 2 experiments (unpaired two–tailed t-test, P = 0.7473). Each symbol represents one animal. Data are shown as mean ± s.e.m. ns=not significant; m=male, f=female.
Extended Data Fig. 2
Extended Data Fig. 2. Murine and human neuroectodermal cells express Il12rb2.
(a-b) Representative IHC for IL-12Rβ2+and NeuN+ cells in the steady-state C57BL/6 mouse brain (m/f; data are representative for 1 out of 3 experiments); scale bar= 200 μm. (c-e) Representative RNAscope® images of EAE C57BL/6 mouse brain. Cell markers were co-stained with probes for Il12rb1 and Il12rb2, as highlighted by arrowheads. Scale bars = 25 μm (insets) or 50 μm. (f) Immunostaining of β-gal+Olig2+ and β-gal+NeuN+ cells in EAE Il12rb2LacZ/LacZ reporter mice (n = 4, m/f; data are representative for 1 out of 3 experiments). Scale bars = 50 μm or 100 μm. Insets are enlargements of outlined regions in the original images. GCL, granule cell layer; PCL, Purkinje cell layer; sg (DG-sg), dentate gyrus, granule cell layer; po (DG-po), dentate gyrus, polymorph layer; mo (DG-mo), dentate gyrus, molecular layer. (g) snRNA-seq of n = 66,432 nuclei from white matter (WM) areas of five patients with progressive MS and three age- and sex-matched non affected, non-dementia controls (accessed at GSE180759 (ref. ). UMAP displaying identified cell clusters, sorted by cell type (OPCs: oligodendrocyte progenitor cells). (h) Schematic illustration of MS lesion (left). IL12RB1- and IL12RB2-expression overlayed on UMAP, sorted by pathological condition (right). (i) Violin plots displaying IL12RB1 and IL12RB2 transcripts in neurons and oligodendrocytes, split by pathological condition (violin plots depict the number of counts per cell across type/site of lesions ; Wilcoxon rank sum test). (j) snRNAseq of n = 39,579 nuclei from whole MS tissue sections (n = 12) and control brain tissue (n = 9) (accessed at PRJNA544731 (ref. ). UMAP with identified cell clusters, sorted by cell type (EN: excitatory neurons; IN: interneurons; PVALB: parvalbumin; L: layer). (k) Violin plots depicting neuronal IL12RB2 transcripts, split by pathological condition (see above; Wilcoxon rank sum test). (l) Brain sections from MS patients were stained for IL-12Rβ2 or total rabbit IgG for IHC (n = 3; data are representative for 1 out of 3 experiments); scale bar= 200 μm [normal appearing grey matter (NAGM), normal appearing WM (NAWM)]. (m) Whole cell protein lysates were prepared from dissociated mouse cerebellar neurons at DIV 14 following 5-, 10- and 15-min stimulation with IL-12 (100 ng/mL), followed by western blot for total Stat4 and pStat4 (Tyr693) (loading control: actin) (n = 3 per group per time point). (n) Fold change in pSTAT4 (relative to total Stat4) protein expression. (o) Whole cell protein lysates were prepared from mouse primary oligodendrocyte cultures at DIV 4 following 5-, 10- and 15-min stimulation with IL-12 (100 ng/mL); western blot analysis was performed as in (m) (n = 3 per group per time point). (p) Quantification of pSTAT4 (relative to total Stat4). In (n) and (p) data are shown as mean ± SD and are representative for 1 out of 3 experiments. Statistical significance was evaluated by one-way ANOVA with Bonferroni multiple comparison post-hoc test (****P < 0.0001; *P = 0.0157; *P = 0.0371, left to right). Source data
Extended Data Fig. 3
Extended Data Fig. 3. IL-12 engagement in neuroectodermal cells protects against neuroinflammation.
(a) Il12rb2 mRNA expression in NK cells and CD3+ T cells isolated by FACS from the CNS of MOG/CFA immunized NestinCre/+Il12rb2fl/fl (n = 5, m/f) and littermate controls (n = 6, m/f) at 17 dpi. Pooled data from two independent experiments shown as mean ± s.e.m. (unpaired two –tailed t- test, P = 0.9009; P = 0.8027, left to right). (b) Frequency of pSTAT4+ CD4+cells upon IL-12 stimulation of splenocytes from steady-state NestinCre/+Il12rb2fl/fl (n = 3, m) mice and littermate controls (n = 3, m). Data represent one experiment shown as mean ± s.e.m. (two-way ANOVA, Bonferroni’s post hoc test, P > 0.9999; P = 0.8631; P > 0.9999, left to right). (c) Il12rb2 mRNA expression in NK cells and CD3+ T cells isolated by FACS from the spleen of NestinCre/+Il12rb2fl/fl and littermate controls at late stage EAE (n = 4 per group, m/f). Data represent one experiment shown as mean ± s.e.m. unpaired two –tailed t- test, P = 0.5251; P = 0.1749, left to right). (d) Maximum disease scores and (e) cumulative clinical score/day of MOG-CFA immunized NestinCre/+Il12rb2fl/fl (n = 26, m/f), littermate Il12rb2fl/fl control (n = 30, m/f) and Il12rb2del/del (n = 24, m/f) mice. Data are pooled from 6 independent experiments and represent mean ± s.e.m. Two-tailed Mann-Whitney test (****P < 0.0001; ***P = 0.0003; P = 0.4211, left to right) in (d); unpaired two –tailed t- test (**P = 0.0018; **P = 0.0054; P = 0.9615, left to right) in (e). (f) Marker expression overlaid onto UMAP of CNS leukocytes from NestinCre/+Il12rb2fl/fl (n = 11, m/f), Il12rb2fl/fl (n = 7, m/f), Il12rb2del/del (n = 9, m/f) (related to Fig. 3e). ns= not significant. m, male; f, female.
Extended Data Fig. 4
Extended Data Fig. 4. Direct IL-12 engagement of neuronal cells mediates neuroprotection.
(a-b) Nuclei were isolated from the CNS of Il12rb2fl/fl and NestinCre/+Il12rb2fl/fl male mice (n = 4 per genotype) at the onset of EAE (10 dpi). The Hoechst+ fraction was FANS-selected and used for single-nucleus RNA sequencing. Violin plots depicting the distribution of (a) number of unique genes and total UMI counts per nuclei for each batch and (b) number of unique genes and total UMI counts detected in each sample linked to Fig. 4a. (c) Dot plot depicting the top 5 differentially expressed genes (DEGs) for each cluster and associated cluster labelling. Dot size corresponds to the percentage of nuclei expressing marker genes across all clusters and the colour shows the average expression level. (d) Dot plots depicting the expression of Il12rb1 and Il12rb2 for each cluster and associated cluster labelling. Dot size corresponds to the percentage of nuclei expressing the gene in each cluster, and the colour represents the average expression level. (e) Volcano plots displaying genes that are up- (blue) or downregulated (grey) in the inflamed NestinCre/+Il12rb2fl/fl CNS for the highlighted neuronal or oligodendrocyte clusters. Dashed lines indicate significance thresholds (adjusted p-value < 0.05) used when identifying DEGs. Differential gene expression in (e) was tested using a two-sided Wilcoxon rank sum test and applying a Benjamini-Hochberg correction and is presented in Supplementary Table 1.
Extended Data Fig. 5
Extended Data Fig. 5. IL-12 induces CNS essential and suppresses hyperinflammatory gene signatures.
Nuclei were isolated from the CNS of Il12rb2fl/fl and NestinCre/+Il12rb2fl/fl male mice (n = 4 per genotype, 8-12 weeks old) at the onset of EAE (10 dpi). (a) and (b) Heatmaps showing the mean gene expression aggregated per mouse for genes of a (a) CNS essential gene signature in MLI and granule cells (b) Hyperinflammatory gene signature in MOL1 and MOL2, Granule cells, excitatory neurons and MLI. (c) Circos plots showing links between unique ligands from senders (ribbon colour indicates subcluster of origin for each ligand; multiple sender cells: ribbon colour black) and predicted associated DE genes in excitatory neurons. Transparency indicates interaction strength, and the ribbon thickness is proportional to the ligand’s regulatory potential. Heatmap (right) displaying potential receptors expressed in excitatory neurons associated with each predicted ligand. Differential gene expression in (a) and (b) was tested using pseudo-bulking and consecutive DEseq2 analysis and is presented in Supplementary Table 3.
Extended Data Fig. 6
Extended Data Fig. 6. IL-12 sustains trophic factor environment for oligodendrocytes.
(a) Circos plots showing links between unique ligands from senders (ribbon colour indicates subcluster of origin for each ligand; multiple sender cells: ribbon colour black) and predicted associated DE genes in MOL1. Transparency indicates interaction strength, and the ribbon thickness is proportional to the ligand’s regulatory potential. Heatmap (right) displaying potential receptors expressed in MOL1 associated with each predicted ligand. (b), (c) and (d) Dot plots showing differential gene expression for differentially expressed ligands in (b) excitatory neurons (c) MOL1 and (d) Granule cells. Dot size indicates significance and color indicates log fold change between NestinCre/+Il12rb2fl/fl and Il12rb2fl/fl mice in the respective cell types. (e) Dot plots depicting the expression of the predicted ligands (in sender) for the following recipient clusters: excitatory neurons, MOL1 and Granule cells (left to right). Dot size corresponds to the percentage of nuclei expressing the gene in each cluster, and the color represents the average expression level. Differential gene expression in (b), (c) and (d) was tested using a two-sided Wilcoxon rank sum test and applying a Benjamini-Hochberg correction and is presented in Supplementary Table 1.
Extended Data Fig. 7
Extended Data Fig. 7. Oligodendrocytes are redundant for the tissue-protective features of IL-12 in EAE.
(a) Il12rb2 mRNA relative expression level in NK cells and CD3+ T cells isolated by FACS from the spleens of Plp1CreERIl12rb2fl/fl (n = 7, m/f) mice and littermate controls (n = 6, m/f) at 16 dpi. Data pooled from two independent experiments and depicted as mean ± s.e.m. (unpaired two –tailed t- test, P = 0.9941; P = 0.8905; left to right). (b) Cumulative clinical scores/day of MOG-CFA induced EAE in Plp1CreERIl12rb2fl/fl (n = 10, m/f), their littermate controls (n = 12, m/f; pink group treated with tamoxifen), NestinCre/+Il12rb2fl/fl (n = 8, m/f) and littermate Il12rb2fl/fl control mice (n = 10, m/f; grey group not treated with tamoxifen). Data are pooled from two independent experiments shown as mean ± s.e.m. (unpaired two –tailed t- test, P = 0.8088; P = 0.8927; ****P ≤ 0.0001, left to right). (c) Primary neuronal cultures derived from neonatal Il12rb2fl/fl (wt) and Il12rb2del/del (ko) mice (pooled litters) were activated with IL-12 (100 ng/ml) for 18 h and subjected to RT-qPCR analysis. (d) Gene expression analysis of selected DEGs (Fig. 5h) (n = 8 wt and n = 6-8 ko; number of dots represents the number of replicates) and (e) selected genes from module M2 (Fig. 5i) in cultured neonatal neurons (n = 8 wt and n = 6 ko replicates). Gapdh was used as an internal reference gene. All data are normalized to their respective unstimulated controls and are representative for 1 out of 2 experiments. Mean ± s.e.m. Two-way ANOVA with Bonferroni post hoc test (d: ****P ≤ 0.0001, P > 0.9999; ****P ≤ 0.0001, P = 0.2511; ***P = 0.0006, P = 0.9967; ****P ≤ 0.0001, P > 0.9999; ****P ≤ 0.0001, P > 0.9999; **P = 0.0045, P = 0.4946; ****P ≤ 0.0001, *P = 0.0145, left to right and e: ****P ≤ 0.0001, P = 0.2033; **P = 0.0016, P = 0.2172, left to right; ns= not significant).
Extended Data Fig. 8
Extended Data Fig. 8. Experimental workflow and working model on IL-12 induced CNS tissue protection during neuroinflammation.
Top: We combined bone marrow (BM) chimerism and conditional gene targeting of Il12rb2 with experimental autoimmune encephalomyelitis (EAE) in mice to unravel the protective role of IL-12 in the CNS neuroectoderm (left). Additionally, we performed snRNAseq coupled with differentially expressed gene (DEG) and NicheNet analysis of the murine CNS at the onset of EAE which revealed the underlying mechanisms of IL-12 induced tissue protection in neurons (middle). We confirmed similar expression of the IL-12R machinery in human MS patients by IHC and snRNAseq data mining (right), suggesting similar mechanisms apply in mice and humans. Bottom: Monocyte derived cells (MdCs) invade the CNS during neuroinflammation and produce IL-12 upon entry. IL-12 can be sensed by neuronal cells which react by (a) intrinsic neuroprotection, (b) trophic factor support to oligodendrocytes and (c) blocking chemoattraction of other leukocytes.

Similar articles

Cited by

References

    1. Attfield KE, Jensen LT, Kaufmann M, Friese MA, Fugger L. The immunology of multiple sclerosis. Nat. Rev. Immunol. 2022;22:734–750. doi: 10.1038/s41577-022-00718-z. - DOI - PubMed
    1. Dendrou CA, Fugger L, Friese MA. Immunopathology of multiple sclerosis. Nat. Rev. Immunol. 2015;15:545–558. doi: 10.1038/nri3871. - DOI - PubMed
    1. Trinchieri G. Interleukin-12: a proinflammatory cytokine with immunoregulatory functions that bridge innate resistance and antigen-specific adaptive immunity. Annu. Rev. Immunol. 1995;13:251–276. doi: 10.1146/annurev.iy.13.040195.001343. - DOI - PubMed
    1. Oppmann B, et al. Novel p19 protein engages IL-12p40 to form a cytokine, IL-23, with biological activities similar as well as distinct from IL-12. Immunity. 2000;13:715–725. doi: 10.1016/S1074-7613(00)00070-4. - DOI - PubMed
    1. Becher, B., Durell, B. G. & Noelle, R. J. Experimental autoimmune encephalitis and inflammation in the absence of interleukin-12. J. Clin. Invest. 10.1172/JCI200215751 (2002). - PMC - PubMed

Publication types