. 2024 Aug;42(8):1218-1223.
doi: 10.1038/s41587-023-01948-9. Epub 2023 Sep 25.

Dissecting key regulators of transcriptome kinetics through scalable single-cell RNA profiling of pooled CRISPR screens

Affiliations

Dissecting key regulators of transcriptome kinetics through scalable single-cell RNA profiling of pooled CRISPR screens

Zihan Xu et al. Nat Biotechnol. 2024 Aug.

Abstract

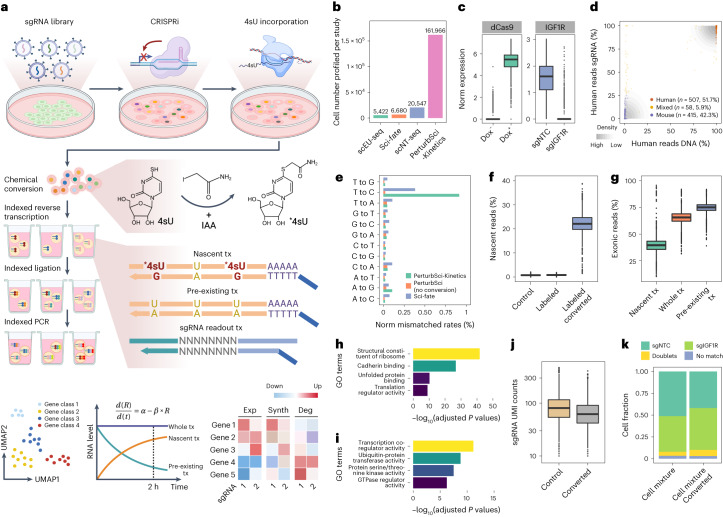
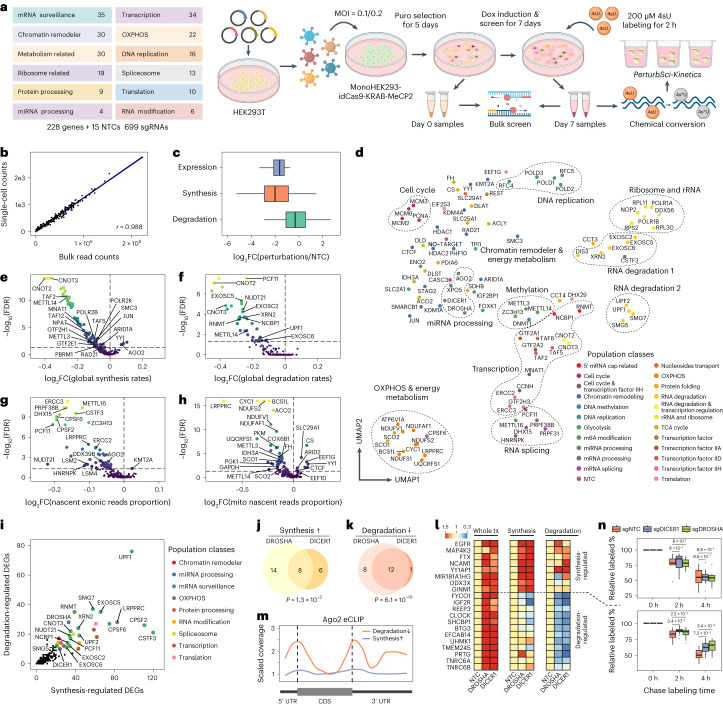
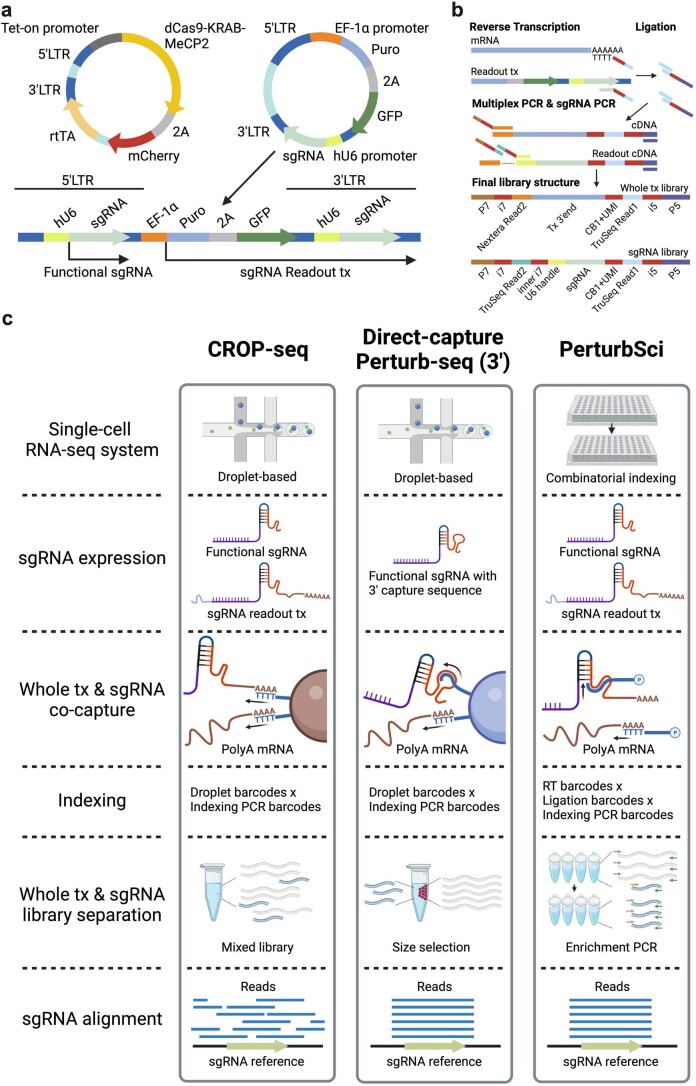
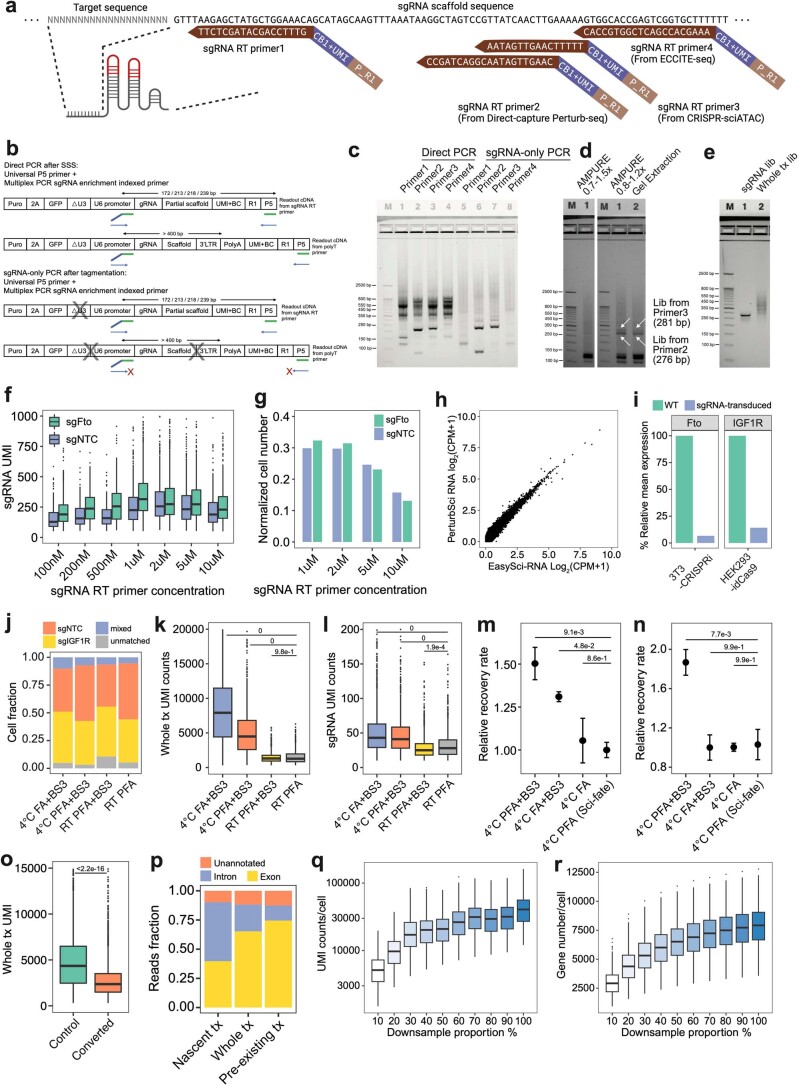
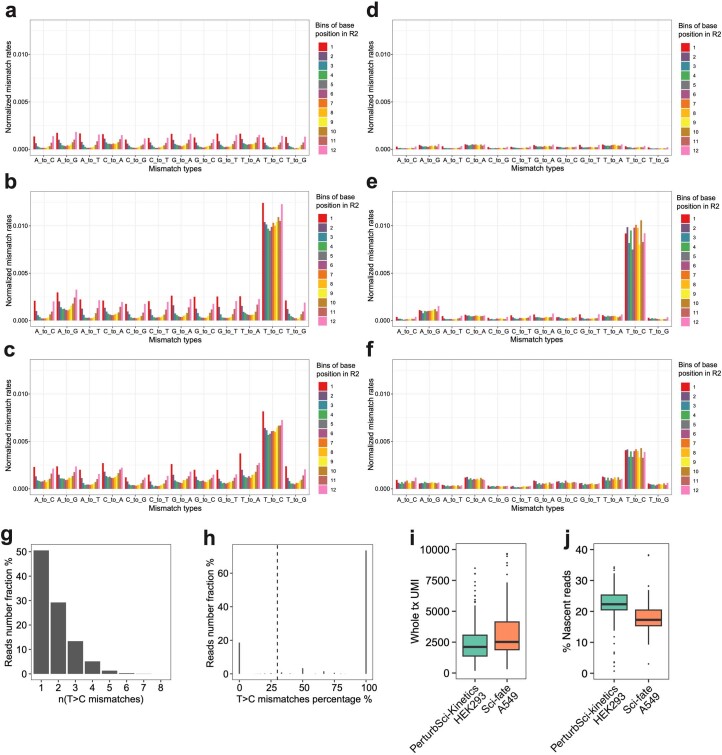
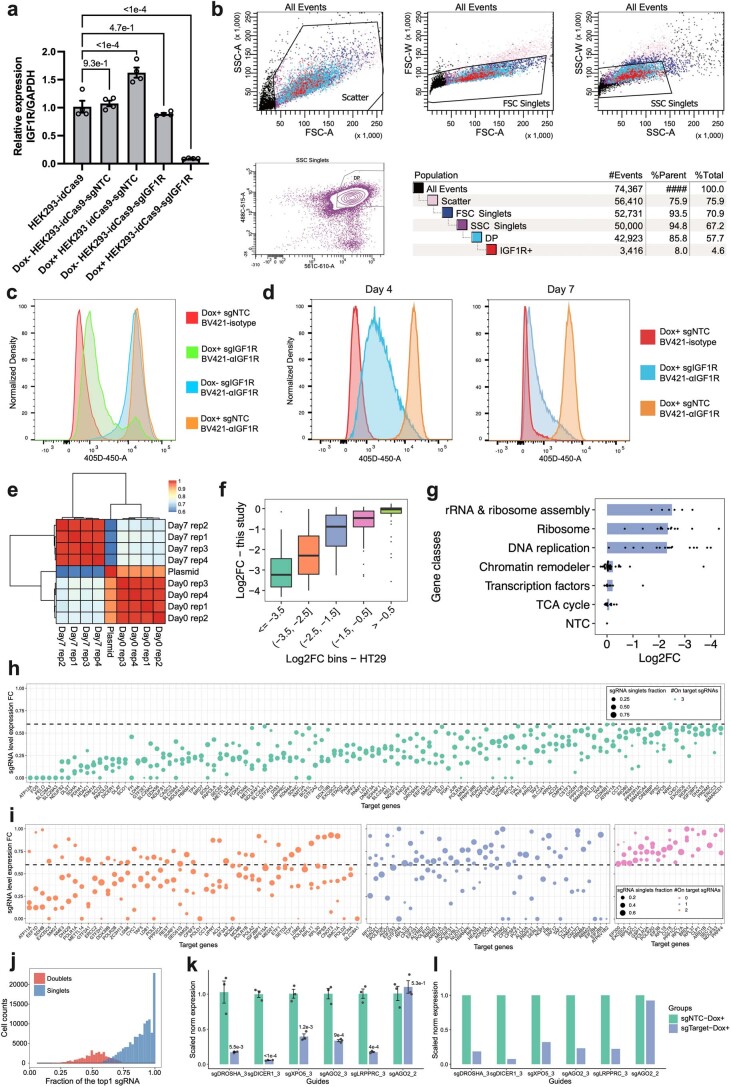
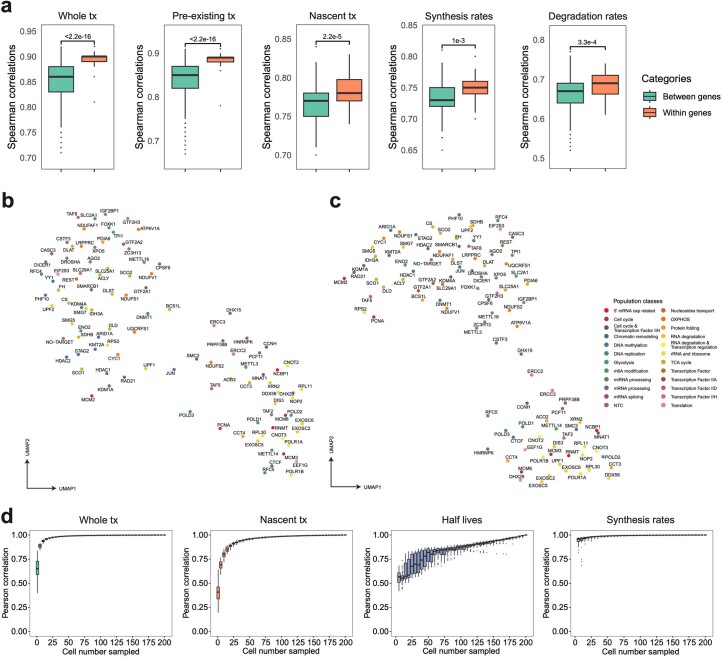
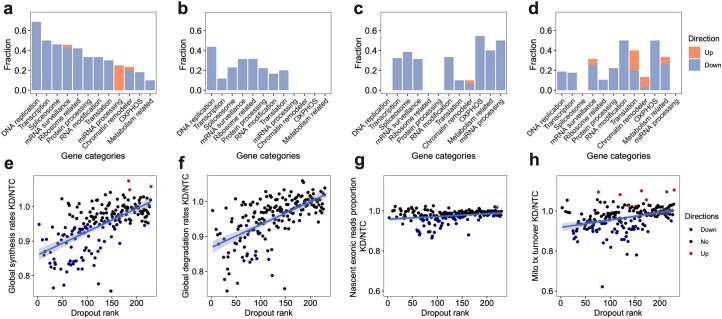
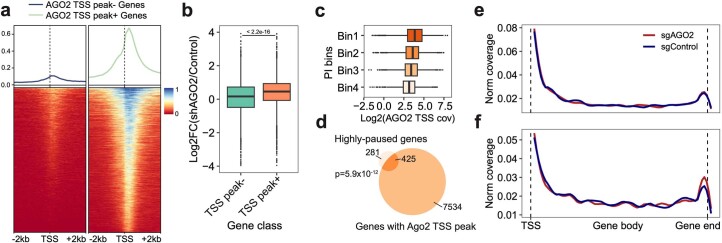
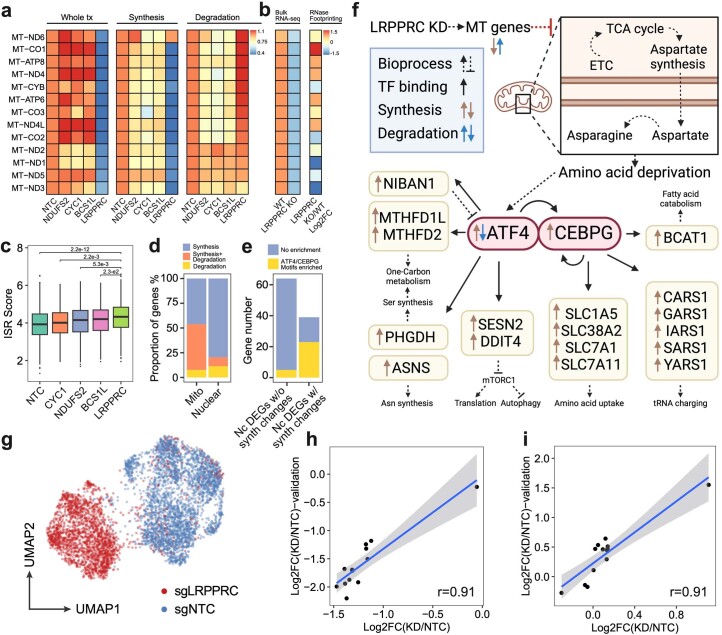
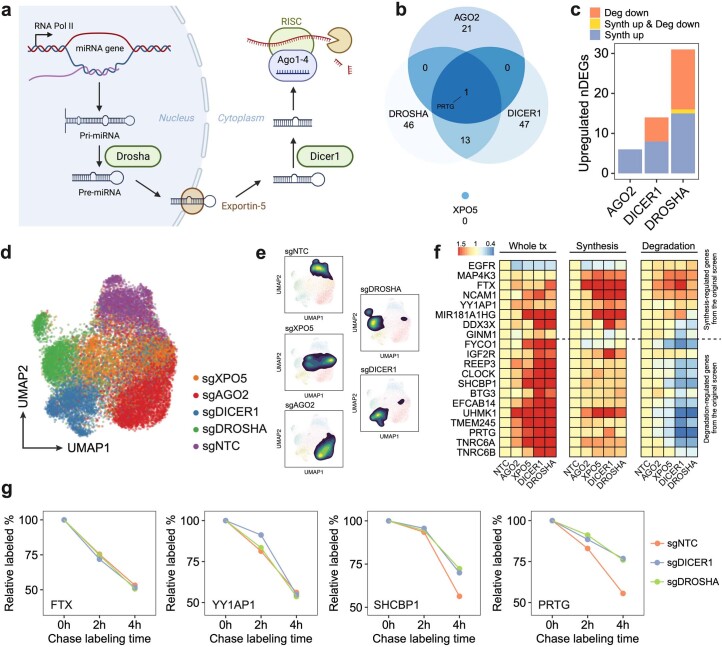
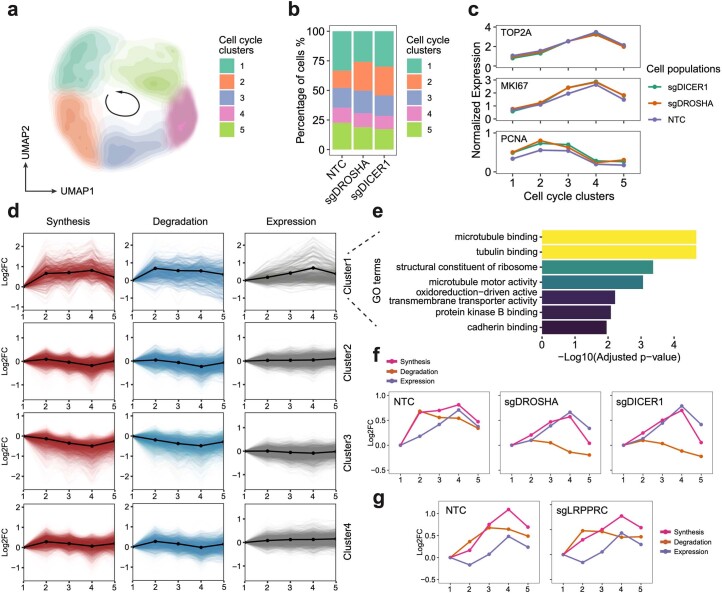
We present a combinatorial indexing method, PerturbSci-Kinetics, for capturing whole transcriptomes, nascent transcriptomes and single guide RNA (sgRNA) identities across hundreds of genetic perturbations at the single-cell level. Profiling a pooled CRISPR screen targeting various biological processes, we show the gene expression regulation during RNA synthesis, processing and degradation, miRNA biogenesis and mitochondrial mRNA processing, systematically decoding the genome-wide regulatory network that underlies RNA temporal dynamics at scale.


Conflict of interest statement

J.C., W.Z. and Z.X. are listed as inventors on a patent related to PerturbSci-Kinetics (US provisional patent application 63/385,479). Other authors declare no competing interests.

Figures

Fig. 1
Fig. 1. PerturbSci-Kinetics enables joint profiling of transcriptome dynamics and high-throughput gene perturbations.
a, Scheme of PerturbSci-Kinetics. *4sU, chemically modified 4sU; α and Synth, RNA synthesis rate; β and Deg, RNA degradation rate; R and Exp, steady-state expression; tx, transcripts. b, Bar plot showing the cell numbers profiled in this study and those from published single-cell RNA-seq coupled with metabolic labeling. c, Left, the log-transformed normalized expression of dCas9-KRAB-MeCP2 in untreated (n = 3,344 cells) or dox-induced (n = 1,419 cells) HEK293-idCas9 cells. Right, the normalized expression of IGF1R in dox-induced HEK293-idCas9 cells transduced with sgNTC (n = 688 cells) or sgIGF1R (n = 820 cells). Norm, normalized. d, An equal number of induced HEK293-idCas9-sgIGF1R cells and 3T3-CRISPRi-sgFto cells were mixed and were profiled using PerturbSci. Scatter plot showed the concordance between percentage of transcriptome and sgRNA reads mapping to human and mouse genomes and human and mouse sgRNA, respectively, for each cell. e, Bar plot showing the sequencing-depth-normalized percentages of single-base mismatches in reads from sci-fate and PerturbSci-Kinetics on chemically converted or unconverted cells. f, Box plot showing the fraction of nascent reads recovered from single cells without 4sU labeling and chemical conversion (n = 1,498 cells), 4sU-labeled cells without chemical conversion (n = 1,008 cells) and 4sU-labeled/converted cells (n = 2,568 cells). g, Box plot showing the proportion of nascent, pre-existing and whole-transcriptome reads mapped to exons of the genome across single cells (n = 4,115 cells). h,i, Bar plots showing the enriched GO terms in genes with low (h) or high (i) nascent reads fractions. One-sided Fisher’s exact tests were conducted with the alternative hypothesis that the true odds ratio is greater than 1. j, Box plot showing the sgRNA UMI counts per cell in cells with (n = 2,568 cells) or without (n = 2,506 cells) the chemical conversion. k, Stacked bar plot showing the fraction of converted/unconverted cells identified as sgNTC/sgIGF1R singlets, doublets and cells with no sgRNA detected. Boxes in box plots indicate the median and interquartile range (IQR), with whiskers indicating 1.5× IQR.
Fig. 2
Fig. 2. Characterizing the impact of genetic perturbations on gene-specific transcriptional and degradation dynamics with PerturbSci-Kinetics.
a, Scheme of the experimental design. b, Scatter plot shows the correlation between perturbation-associated cell count from PerturbSci-Kinetics and sgRNA read counts from bulk screen libraries. c, Box plot showing the log2-transformed FCs of gene expression, synthesis rates and degradation rates of sgRNA-targeted genes (n = 203 genes) in perturbed cells expressing the corresponding sgRNA compared to NTC. d, UMAP visualization of perturbed pseudobulk whole transcriptomes profiled by PerturbSci-Kinetics. We aggregated single-cell transcriptomes in each perturbation, followed by dimension reduction using PCA and visualization using UMAP. Population classes: the functional categories of genes targeted in different perturbations. eh, Scatter plots showing the extent and the significance of changes on the distributions of global synthesis (e), degradation (f), proportions of exonic reads in the nascent transcriptome (g) and proportions of mitochondrial nascent reads (h) upon perturbations compared to NTC cells. The FCs were calculated by dividing the median values of each perturbation with that of NTC cells and were log2 transformed. Dashed lines indicate the statistical thresholds that were used (horizontal line, −log10(0.05); vertical line, 0). i, Scatter plot showing the number of synthesis/degradation-regulated DEGs from different perturbations. nDEGs, number of DEGs. j,k, Venn diagrams showing the number of merged DEGs with significantly enhanced synthesis (j) or impaired degradation (k) between DROSHA and DICER1. One-sided Fisher’s exact tests were conducted with the alternative hypothesis that the true odds ratio is greater than 1. l, Heat maps showing the steady-state expression, synthesis and degradation rate changes of genes included in jk. Tiles of each row are colored by FCs of values of perturbations relative to NTC. tx, transcriptome. m, Line plot showing the AGO2 binding patterns on transcripts of protein-coding genes in jk revealed by eCLIP signal intensity. Data were obtained from a previous study. Dashed lines indicate the position of the beginning of CDS (left) and the beginning of 3′ UTR (right). n, Box plots showing the relative proportion of labeled mRNA of transcription-regulated genes (n = 8) and degradation-regulated genes (n = 12) after chase labeling for different times in HEK293-idCas9-sgNTC, sgDROSHA and sgDICER1 cells. Two-sided Studentʼs t-tests were performed between knockdown groups and the NTC group. Boxes in box plots indicate the median and interquartile range (IQR), with whiskers indicating 1.5× IQR. OXPHOS, oxidative phosphorylation; Puro, puromycin.
Extended Data Fig. 1
Extended Data Fig. 1. Scheme of plasmids and experiment procedures of PerturbSci.
a. The vector system used in PerturbSci for dCas9 and sgRNA expression. The expression of the enhanced CRISPRi silencer dCas9-KRAB-MeCP2 (ref. ) was controlled by the tetracycline responsive (Tet-on) promoter. A GFP sequence was added to the original CROP-seq-opti plasmid as an indicator of successful sgRNA transduction and for the lentivirus titer measurement. The CROP-seq vector utilizes the self-replication mechanism of lentivirus during the integration for amplifying the sgRNA expression cassette. In this lentiviral plasmid, the sgRNA expression cassette replaced the U3 region of the 3′LTR. During the lentiviral integration, the shortened 5′LTR of reverse-transcribed lentiviral genomic DNA was extended by using its 3′LTR as a template, and the sgRNA expression cassette is self-replicated to the 5′LTR. The self-replicated sgRNA expression cassette at 5′LTR generates functional sgRNA for guiding dCas9, and the original expression cassette at 3′LTR is transcribed as a part of the Puro-GFP fusion transcript driven by the EF-1α promoter. b. The library preparation scheme and the final library structures of PerturbSci, including a scalable combinatorial indexing strategy with direct sgRNA capture and enrichment that reduced the library preparation cost, enhanced the sensitivity of the sgRNA capture compared to the original CROP-seq, and avoided the extensive barcodes swapping detected in Perturb-seq. c. A schematic comparison of chemistries between PerturbSci, CROP-seq, and Direct-capture Perturb-seq.
Extended Data Fig. 2
Extended Data Fig. 2. Representative optimizations of PerturbSci.
a. sgRNA primers of different designs were mixed with polyT primers respectively for RT. CB, cell barcode. P_R1, partial TruSeq read1 sequence. b-c. After RT, the capture efficiency of sgRNA by different RT primers was evaluated by ‘Direct PCR’, and the efficiency of by-product removal was examined by ‘sgRNA-only PCR’. 3 independent experiments were conducted. d. Different post-multiplex PCR purification strategies were tested. 3 independent experiments were conducted. e. A representative gel image of libraries of PerturbSci. 5 independent experiments were conducted. f-g. Boxplots showing sgRNA UMI counts (f) and the cell number recovered (g) from different sgRNA primer concentrations (n = 230, 181, 149, 529, 512, 445, 299 cells from 100nM to 10uM groups for sgNTC cells, n = 499, 399, 246, 1237, 1215, 904, 537 cells from 100nM to 10uM groups for sgFto cells). h. Scatterplot showing the correlation between log2-transformed counts per million (CPM) profiled by PerturbSci and EasySci in the 3T3L1-CRISPRi cell line. i. Barplots showing effective knockdown in mouse 3T3-CRISPRi-sgFto cells and human HEK293-idCas9-sgIGF1R cells computationally assigned in the species-mixing experiment (Fig. 1d). j–l. Barplots showing the cell identities fraction (j), whole transcriptome (k) and sgRNA UMI counts (l) detected per cell in different fixation conditions (n = 1508, 1132, 1247, 1084 cells for conditions from the left to the right). Tukey’s tests after one-way ANOVA were performed. m-n. Dotplots showing the relative recovery rate (n = 4, mean ± SEM) of HEK293-idCas9 cells in different fixation conditions following HCl permeabilization (m) and chemical conversion (n). Dunnett’s test after one-way ANOVA was performed. o. Boxplot showing the effect of chemical conversion on whole transcriptome UMI counts under 4 °C PFA + BS3 fixation condition (n = 1988 cells in the control group, n = 4831 cells in the converted group). Two-sided Wilcoxon rank sum test was performed. p. Mapping statistics of reads from PerturbSci-Kinetics. q-r. Boxplots showing single-cell whole transcriptome UMI counts (q) and gene counts (r) under different sequencing depth (n = 500 cells in each subsampling group). Boxes in boxplots indicate the median and IQR with whiskers indicating 1.5× IQR. Source data
Extended Data Fig. 3
Extended Data Fig. 3. Optimization and benchmarking of the computational pipeline for nascent reads calling.
a–c. Barplots showing the normalized mismatch rates of all 12 mismatch types detected in unconverted cells (a), converted cells (b), and the original sci-fate A549 dataset (c) at different positions of the reads using the original sci-fate mutation calling pipeline. d–f. Barplots showing the normalized mismatch rates of all 12 mismatch types detected in unconverted cells (d), converted cells (e), and the original sci-fate A549 dataset (f) at different positions of the reads using the updated mutation calling pipeline. Considering the different sequencing lengths between the present dataset and sci-fate, the Read2 from sci-fate were trimmed to the same length as the present dataset before processing. Compared to the original pipeline, the updated pipeline further filtered the mismatch based on the CIGAR string and only mismatches with ‘CIGAR = M’ were kept. Normalized mismatch rates in each bin, the percentage of each type of mismatch in all sequencing bases within the bin. g, h. Statistics of T > C mutations in PerturbSci-Kinetics reads. Histogram showing the number of T > C mutations on reads that were identified to be from newly synthesized transcripts (g). For each read with high-quality mismatches identified, the fraction of mismatches from T > C mutations was calculated, which clearly separated the reads with background mutations and mutants introduced by 4sU in the plot (h). 30% was set as the cutoff to assign nascent reads as sci-fate. i, j. Downsampling comparison between sci-fate and PerturbSci-Kinetics. A subset of raw reads in sci-fate A549 dataset were randomly selected to generate a downsampled dataset with the same single-cell raw reads number distribution with PerturbSci-Kinetics, and both datasets were processed using the same pipeline (n = 200 cells for each dataset). The single-cell whole transcriptome UMI counts (i) and the nascent reads proportions (j) between two datasets were compared. Boxes in boxplots indicate the median and IQR with whiskers indicating 1.5× IQR.
Extended Data Fig. 4
Extended Data Fig. 4. Validation of the performance of CRISPRi and quality control of bulk and single-cell PerturbSci-Kinetics libraries.
a–d. Inducible IGF1R mRNA and protein knockdown were further validated by RT-qPCR (a) after 3-day Dox induction (n = 4 biologically independent samples, data are presented as mean ± SEM. Dunnett’s test after one-way ANOVA was performed.) and by flow cytometry (b-d). The representative gating strategy for flow cytometry is shown in (b). Cells were treated with Dox+/Dox- media for 7 days before the flow-cytometry assay (c). To find the minimal time of Dox induction with stable knockdown, sgIGF1R and sgNTC cells were induced for either 4 days or 7 days and the IGF1R abundance was examined. Isotype, isotype control. αIGFIR, anti-IGF1R. e. Heatmap showing the Pearson correlations of normalized sgRNA read counts between the plasmid library and bulk screen replicates. f. Boxplot showing the reproducible trends of deletion upon CRISPRi between the present study and a prior report (n = 10, 57, 45, 49, 68 genes in each bin from left to right). g. Barplot showing the knockdown of genes with higher essentiality resulted in stronger cell growth arrest. h–i. Dotplots showing the expression fold changes of target genes upon CRISPRi induction compared to NTC in the single-cell PerturbSci-Kinetics dataset. Each dot represents a sgRNA. Fold change < 0.6 was used for sgRNA filtering, and genes with 3, 2, 1, 0 on-target sgRNA(s) were visualized in b-e, respectively. FC, fold change. j. Histogram showing the distribution of the fraction of the most abundant sgRNA in singlets (78%) and doublet cells (22%). k, l. The accuracy of sgRNA targeting efficiency in PerturbSci-Kinetics was further confirmed by RT-qPCR. Individual HEK293-idCas9 clones expressing 5 sgRNAs with high efficiency and 1 off-target sgRNA were established. RT-qPCR was conducted after 3-day Dox induction (n = 3 biologically independent samples). Data are presented as mean ± SEM, and two-sided Student′s t-test were performed (k). Mean expressions of target genes in NTC and corresponding cells in the original PerturbSci-Kinetics dataset were exhibited (l). Boxes in boxplots indicate the median and IQR with whiskers indicating 1.5 × IQR.
Extended Data Fig. 5
Extended Data Fig. 5. PerturbSci-Kinetics captures multi-layer transcriptome and RNA kinetics information upon perturbations with high fidelity.
a. Boxplots showing the pairwise correlation coefficients of sgRNAs targeting the same/different genes, computed using aggregated whole transcriptomes, pre-existing transcriptomes, nascent transcriptomes, gene-specific synthesis rates and degradation rates. Considering the data sparsity and different cell numbers across perturbations, 150 cells per sgRNA were assembled into one pseudobulk for downstream analysis. Spearman correlation coefficients were calculated using DEGs between perturbations and NTC in the pooled screen. Two-sided Welch′s t-tests were performed. b, c. UMAP of pseudobulk perturbations by inferred synthesis rates (b) and degradation rates (c). DEGs between all perturbations-NTC pairs were combined, and their synthesis and degradation rates were calculated for each perturbation. Only genes with calculable synthesis or degradation rate in at least 75% of pseudobulk perturbations were used for dimension reduction. The top 12 and 15 principal components from the synthesis and degradation rates matrix were used for UMAP visualization, respectively. These UMAPs showed meaningful patterns. For example, RNA exosome genes (for example, EXOSC2, EXOSC5, EXOSC6), nonsense-mediated mRNA decay pathway members (for example, SMG5, SMG7), ribosomal biogenesis genes (for example, NOP2, RPL30, RPL11, POLR1A, POLR1B), miRNA biogenesis pathway members (for example, DICER1, DROSHA, XPO5, and AGO2) were in relative proximity in both UMAPs. Chromatin remodelers (for example, HDAC1, HDAC2, STAG2, RAD21, KMT2A, KDM1A, ARID1A) were closely clustered in synthesis rates-derived UMAP, while m6A regulators (for example, METTL3, METTL16, ZC3H13, IGF2BP1) and polyadenylation factors (for example, CPSF6, CSTF3) were closer to each other in degradation rates-derived UMAP. d. Boxplots showing effects of cell number on the estimation of the pseudobulk whole/nascent transcriptome expression, gene-specific half-life, and synthesis rate. We conducted 50 random samplings for each cell number on sgDROSHA cells, then we aggregated profiles of sampled cells and retrieved pseudobulk expression levels and estimated RNA dynamics rates. We calculated the Pearson correlation coefficients between each downsampled pseudobulk group and unsampled pseudobulk sample. Boxes in boxplots indicate the median and IQR with whiskers indicating 1.5× IQR.
Extended Data Fig. 6
Extended Data Fig. 6. A systematic view of the effects of perturbations on global synthesis rates, global degradation rates, exonic reads ratio, and mitochondrial turnover rates.
a–d. For each gene category, we calculated the fraction of genetic perturbations associated with significant changes in global synthesis rates (a), global degradation rates (b), proportions of exonic reads in the nascent transcriptome (c), and proportions of mitochondrial nascent reads (d). Overall global transcription could be affected by more genes than degradation. Perturbation on essential genes, such as DNA replication genes, could affect both global synthesis and degradation. Perturbations on chromatin remodelers only specifically impaired the global synthesis rates but not the degradation rates, supporting the established theory that gene expression is regulated by chromatin folding. In addition to the enrichment of genes in transcription, spliceosome and mRNA surveillance, perturbation on OXPHOS genes and metabolism-related genes also affected the RNA processing, consistent with the fact that 5′ capping, 3′ polyadenylation, and RNA splicing are highly energy-dependent processes. That knockdown of OXPHOS genes and metabolism-related genes could reduce the mitochondrial transcriptome dynamics and also supported the complex feedback mechanisms between energy metabolism and mitochondrial transcription. e–h. Scatterplots showing the relationships between dropout effects and global synthesis rates (e), global degradation rates (f), proportions of exonic reads in the nascent transcriptome (g), and mitochondrial RNA turnover (h). A linear regression line was fitted and ±95% confidence intervals are visualized for each metric. Dropout rank, the ascending rank of gene-level sgRNA counts log2FC from the bulk screen. Directions were assigned as shown in Fig. 2e–h. Both global synthesis and degradation rates showed strong negative correlations with dropout, indicating knocking out essential genes generally resulted in impaired global RNA synthesis and degradation. In contrast, proportions of exonic reads in the nascent transcriptome were much more stable across perturbations, and were only specifically affected by genes functioning in RNA processing. Proportions of mitochondrial nascent reads were also prone to be affected by genetic perturbation, but directions of changes depend more on the functions of perturbed genes than the essentiality of genes.
Extended Data Fig. 7
Extended Data Fig. 7. AGO2 functions as a transcriptional repressor by arresting transcription at the pausing status.
a. The density plot (top) and heatmap (bottom) show the density of AGO2 ChIP-seq reads around TSS of genes with or without enriched AGO2 TSS binding peaks. b. Boxplot showing the log2FC of gene expression between AGO2-silenced and control groups of genes with (n = 7315 genes) or without AGO2 TSS binding peaks (n = 3615 genes). Two-sided Wilcoxon rank sum test was performed. c. Boxplot displaying the positive correlation between PI of genes and normalized AGO2 ChIP-seq coverage within corresponding TSS regions. c, d. Genes were separated into 4 bins based on the average ranks of PI in two replicates (Methods). The Venn diagram highlights the significant association between AGO2 TSS binding and the strong pausing status of genes. One-sided Fisher′s Exact Test was conducted with the alternative hypothesis that the true odds ratio is greater than 1. Highly-paused genes, genes with top 10% of average PI ranks. e, f. Highly-paused genes were split into two groups, 1) significantly-upregulated genes upon AGO2 knockdown or 2) genes without significant expression changes. We then calculated the nascent RNA coverage of these two groups of genes in sgNTC and sgAGO2 cells. Notably, only genes in group 1 displayed increased 3′ end enrichment upon AGO2 knockdown (f). Boxes in boxplots indicate the median and IQR with whiskers indicating 1.5× IQR.
Extended Data Fig. 8
Extended Data Fig. 8. PerturbSci-kinetics identified LRPPRC as the master regulator of mitochondrial RNA dynamics.
a. Heatmap showing the relative FC of gene expression, synthesis and degradation rates of mitochondrial protein-coding genes upon NDUFS2, CYC1, BCS1L and LRPPRC knockdown compared to NTC cells. b. The heatmap (left) showed mean z-scored mitochondrial gene expression changes between wild-type and LRPPRC-knockout mice heart tissue samples reported by Siira, S.J., et al.. The DEG statistical examination was conducted by the original study. The heatmap (right) showed the FC of the mRNA secondary structure increase upon LRPPRC knockdown observed in the same prior report, which positively correlated with the accelerated degradation of mitochondrial genes detected in our study (coefficient of Pearson correlation = 0.708, p-value = 6.8e-3). c. Boxplot showing the distribution of integrated stress response scores of single cells (n = 2758, 478, 768, 631, 504 cells in each group from left to right). Dunnett’s test after one-way ANOVA was performed. ISR, integrated stress response. ISR score, the average normalized expression of genes within the ISR transcription program identified by Genome-wide Perturb-seq. d. Barplot showing the fraction of genes regulated by synthesis, degradation or both in mitochondrial/nuclear-encoded DEGs. e. Barplot showing the enrichment of ATF4/CEBPG motifs at promoter regions of DEGs with/without significant synthesis changes. We identified two transcription factors (ATF4 and CEBPG) that were significantly upregulated upon LRPPRC knockdown, and motifs of their protein product were significantly over-represented in TSS regions of the synthesis-regulated nuclear-encoded DEGs. Nc DEGs w/o synth changes, Nuclear-encoded DEGs without synthesis changes. Nc DEGs w/ synth changes, Nuclear-encoded DEGs with synthesis changes. f. The transcriptional regulatory network in LRPPRC perturbation inferred from our analysis. It was consistent with the prior study that ATF4 was regulated at both transcriptional and post-transcriptional levels. g. Single-cell UMAP of HEK293-idCas9-sgNTC/sgLRPPRC cells in the validation dataset. h, i. Correlations of synthesis and degradation rate changes of mitochondrial mRNA upon LRPPRC knockdown between the original screen and the validation dataset. A linear regression line was fitted and ±95% confidence intervals are visualized for each metric. r, coefficient of Pearson correlation. Boxes in boxplots indicate the median and IQR with whiskers indicating 1.5× IQR.
Extended Data Fig. 9
Extended Data Fig. 9. PerturbSci-Kinetics identified post-transcriptional gene expression regulations by perturbing miRNA biogenesis pathway.
a. Illustration of the canonical miRNA biogenesis pathway. After the transcription of miRNA host genes, the primary miRNA (pri-miRNA) forms into a hairpin and is processed by DROSHA. Processed precursor miRNA (pre-miRNA) is transported to the cytoplasm by Exportin-5. The stem loop is cleaved by DICER1, and one strand of the double-stranded short RNA is selected and loaded into the RISC for targeting mRNA. b. Venn diagram showing the overlap of upregulated DEGs across perturbations on four genes encoding main members of the miRNA pathway. The knockdown of DROSHA and DICER1 in this pathway resulted in significantly overlapped DEGs (p-value = 2.2e-16, one-sided Fisher’s exact test). In contrast, AGO2 knockdown resulted in more unique transcriptome features. XPO5 knockdown showed no upregulated DEGs, consistent with a previous report in which XPO5 silencing minimally perturbed the miRNA biogenesis. c. Bar plot showing the fraction of upregulated DEGs driven by synthesis/degradation changes upon DROSHA, DICER1, and AGO2 perturbations. While DROSHA and DICER1 knockdown resulted in increased synthesis and reduced degradation, AGO2 knockdown only affected gene expression transcriptionally, consistent with our finding that AGO2 knockdown resulted in a global increase of synthesis rates (Fig. 2e), and further supported its roles in nuclear transcription regulation. As DROSHA is upstream of DICER1 in the pathway, we observed stronger effects of DROSHA knockdown than DICER1 knockdown, which was supported by the previous study. d, e. UMAP of sgNTC cells and single cells with individual miRNA biogenesis pathway genes knockdown. f. Reproducible steady-state expression, synthesis rate, and degradation rate changes of synthesis/degradation-regulated genes in the validation dataset. g. Example genes showing unchanged (transcription-regulated genes: FTX, YY1AP1) and enhanced (degradation-regulated genes: SHCBP1, PRTG) mRNA stability upon DROSHA/DICER knockdown. After long term 4sU labeling on Dox-induced HEK293-idCas9-sgNTC, sgDROSHA, sgDICER cells, uridine chase was performed. 3′end SLAM-seq was performed to directly track the degradation of labeled mRNA. The fraction of labeled read counts of individual genes at each time point were normalized by their labeled fractions at 0h.
Extended Data Fig. 10
Extended Data Fig. 10. PerturbSci-Kinetics enables dissecting the effects of perturbations on cell cycle-dependent RNA dynamics.
a. UMAP embedding of cells with miRNA pathway genes knockdowns and NTC cells reflected the cell-cycle progression. b. Stacked barplot showing the cell cycle distribution of cells from each perturbation. c. The expression changes of cell cycle marker genes in cell cycle clusters. d. The cell cycle time-course synthesis rates, degradation rates, and steady-state expression changes of 4 gene clusters. Solid lines with dots, the mean values and the average trend of all genes within the cluster. e. The top enriched GO terms of genes in the cluster 1 identified in GO enrichment analysis. f. Averaged trends of cell cycle time-course synthesis rates, degradation rates, and steady-state expression changes of cluster 1 genes in HEK293-idCas9-sgNTC, sgDROSHA, sgDICER1 cells. g. Averaged trends of cell cycle time-course synthesis rates, degradation rates, and steady-state expression changes of genes in cluster 1 in HEK293-idCas9-sgNTC and sgLRPPRC cells. Considering potential strong batch effects from distinct genetic perturbation, cell cycle clustering analysis in (g) was performed independently of (a), and cell cycle clusters in (g) were not fully synchronized with clusters in (f).

Update of

Similar articles

Cited by

References

    1. Jaitin, D. A. et al. Dissecting immune circuits by linking CRISPR-pooled screens with single-cell RNA-seq. Cell167, 1883–1896 (2016). 10.1016/j.cell.2016.11.039 - DOI - PubMed
    1. Adamson, B. et al. A multiplexed single-cell CRISPR screening platform enables systematic dissection of the unfolded protein response. Cell167, 1867–1882 (2016). 10.1016/j.cell.2016.11.048 - DOI - PMC - PubMed
    1. Dixit, A. et al. Perturb-seq: dissecting molecular circuits with scalable single-cell RNA profiling of pooled genetic screens. Cell167, 1853–1866 (2016). 10.1016/j.cell.2016.11.038 - DOI - PMC - PubMed
    1. Xie, S., Duan, J., Li, B., Zhou, P. & Hon, G. C. Multiplexed engineering and analysis of combinatorial enhancer activity in single cells. Mol. Cell66, 285–299 (2017). 10.1016/j.molcel.2017.03.007 - DOI - PubMed
    1. Datlinger, P. et al. Pooled CRISPR screening with single-cell transcriptome readout. Nat. Methods14, 297–301 (2017). 10.1038/nmeth.4177 - DOI - PMC - PubMed

MeSH terms

LinkOut - more resources