. 2024 Jun;42(6):946-959.
doi: 10.1038/s41587-023-01931-4. Epub 2023 Sep 25.

Single-cell lineage capture across genomic modalities with CellTag-multi reveals fate-specific gene regulatory changes

Affiliations

Single-cell lineage capture across genomic modalities with CellTag-multi reveals fate-specific gene regulatory changes

Kunal Jindal et al. Nat Biotechnol. 2024 Jun.

Abstract

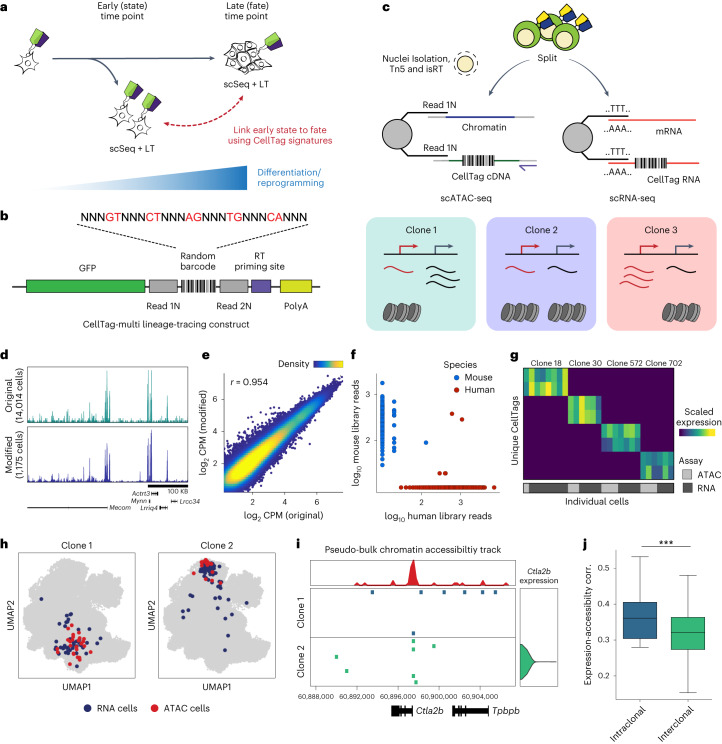
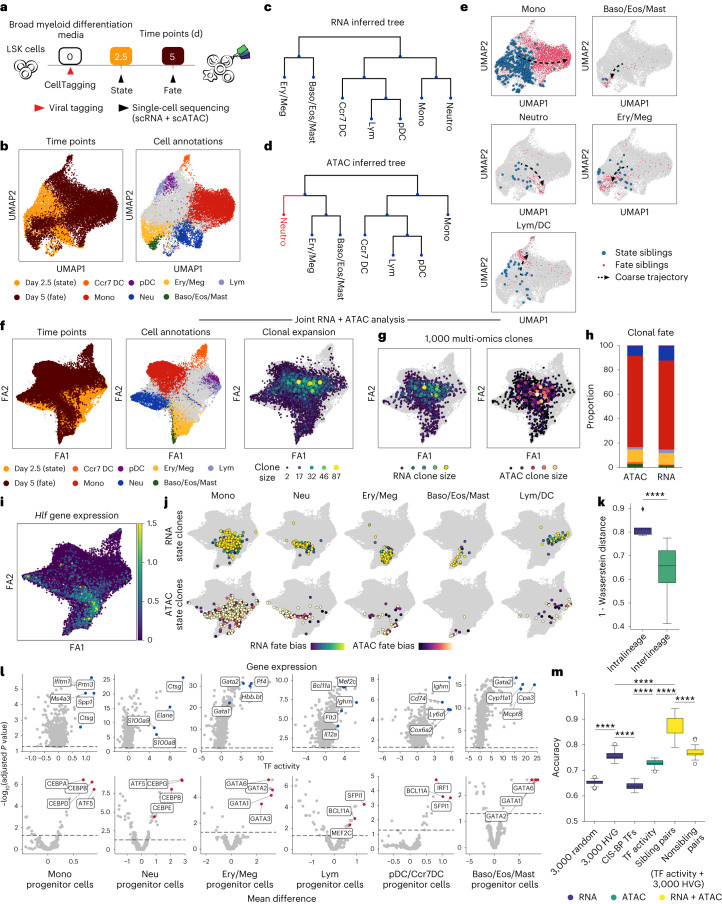
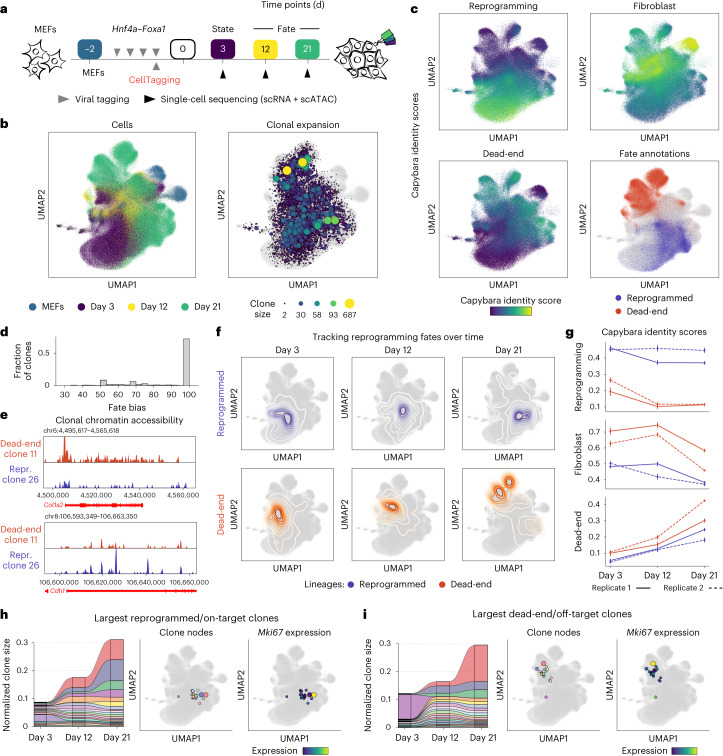
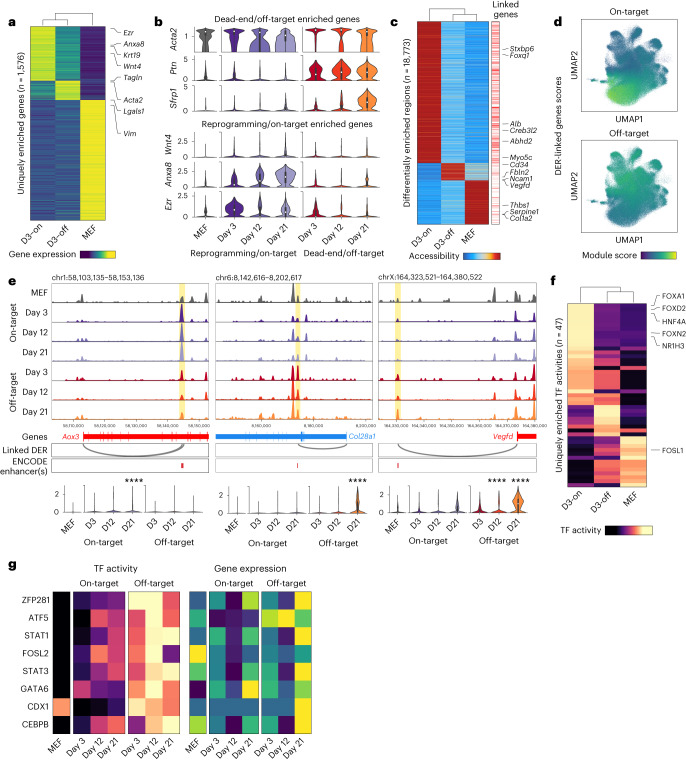
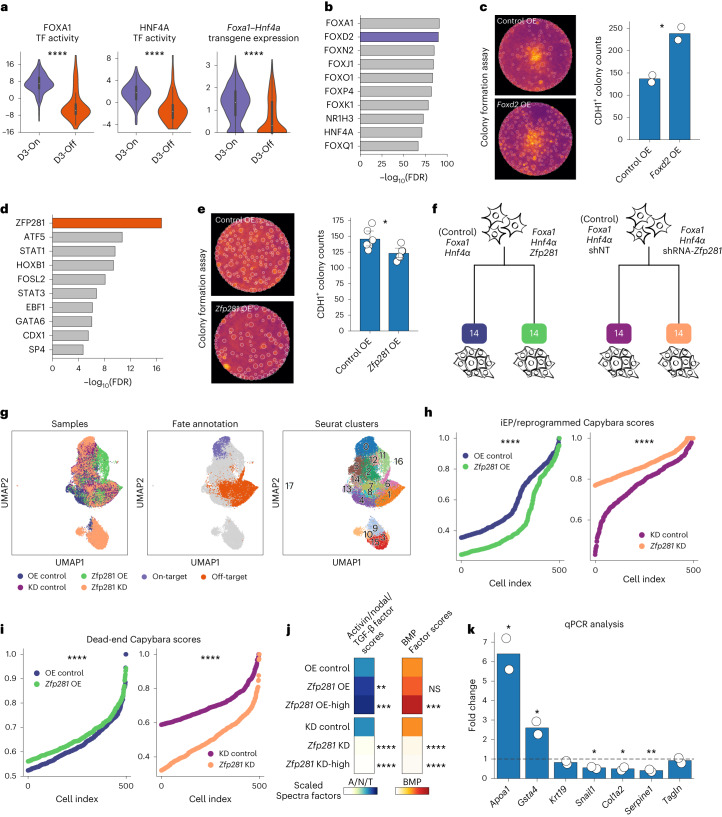
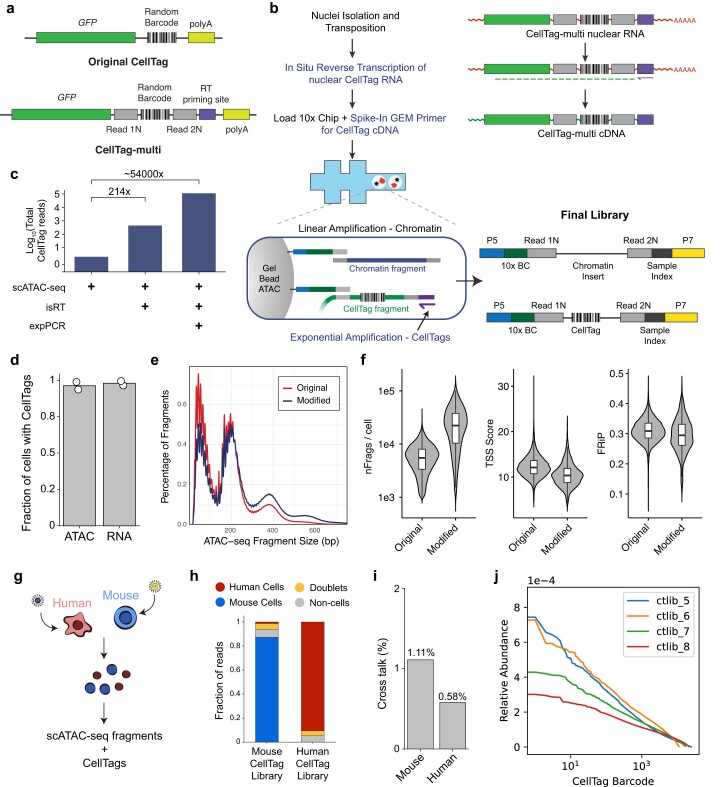
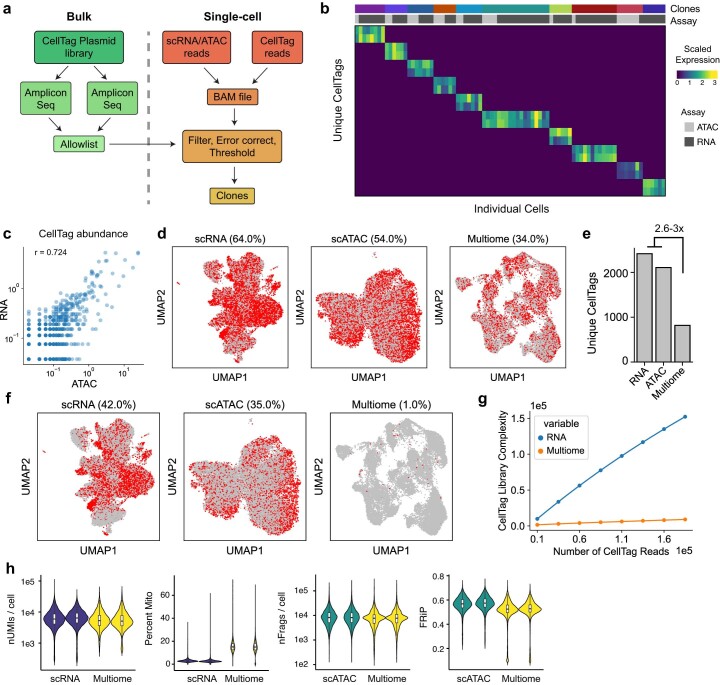
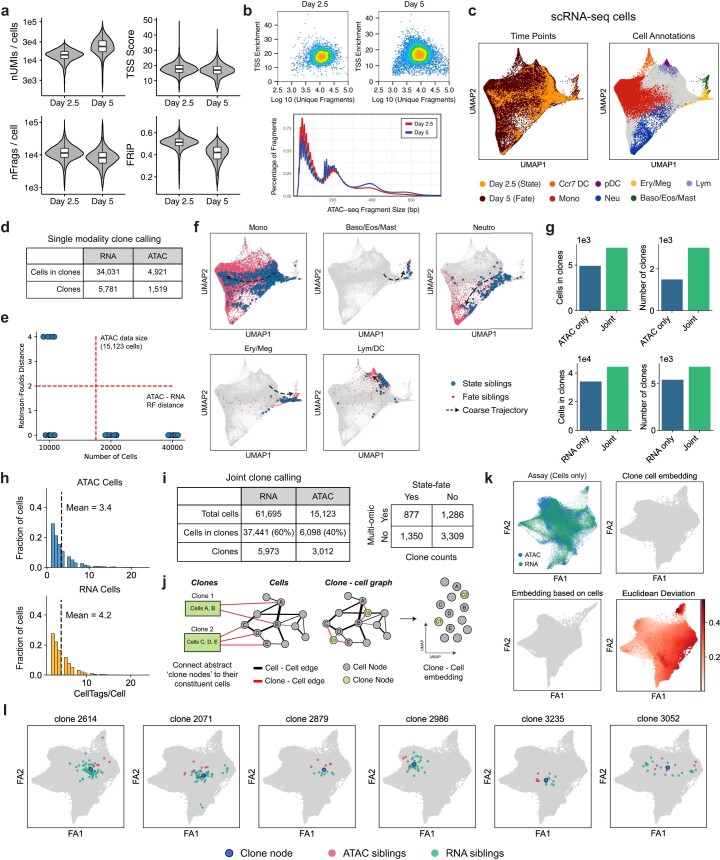
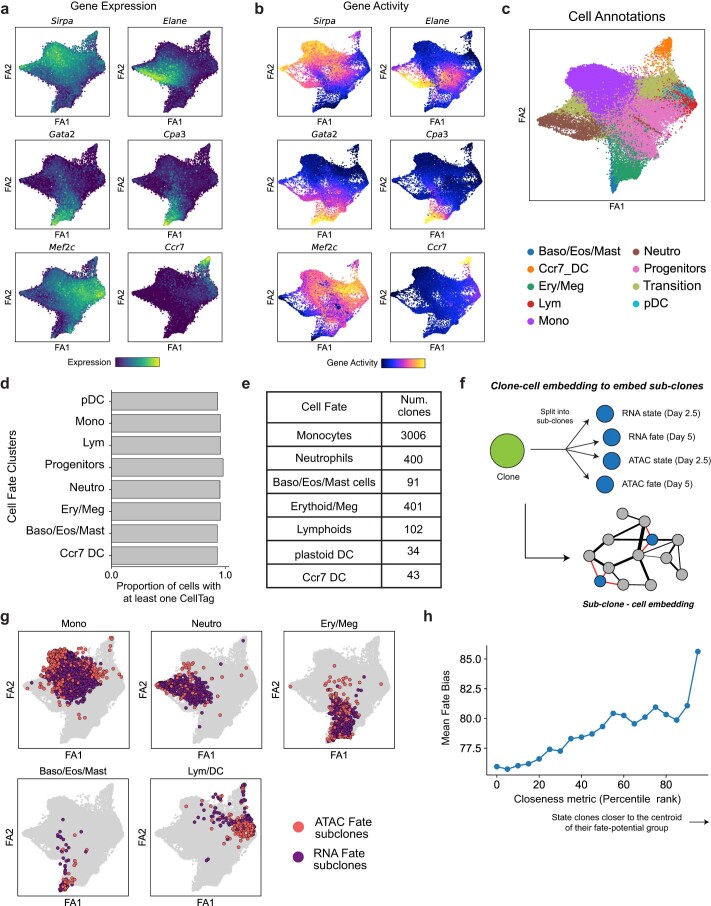
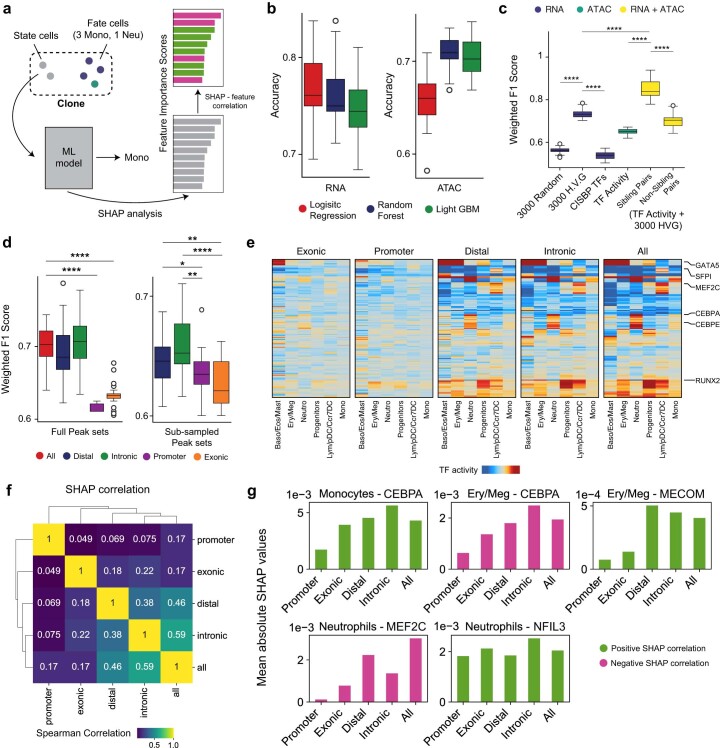
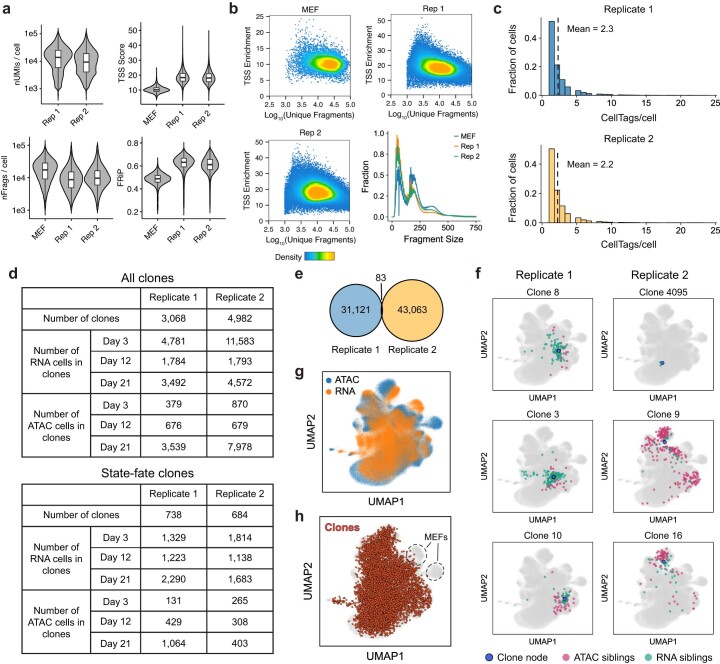
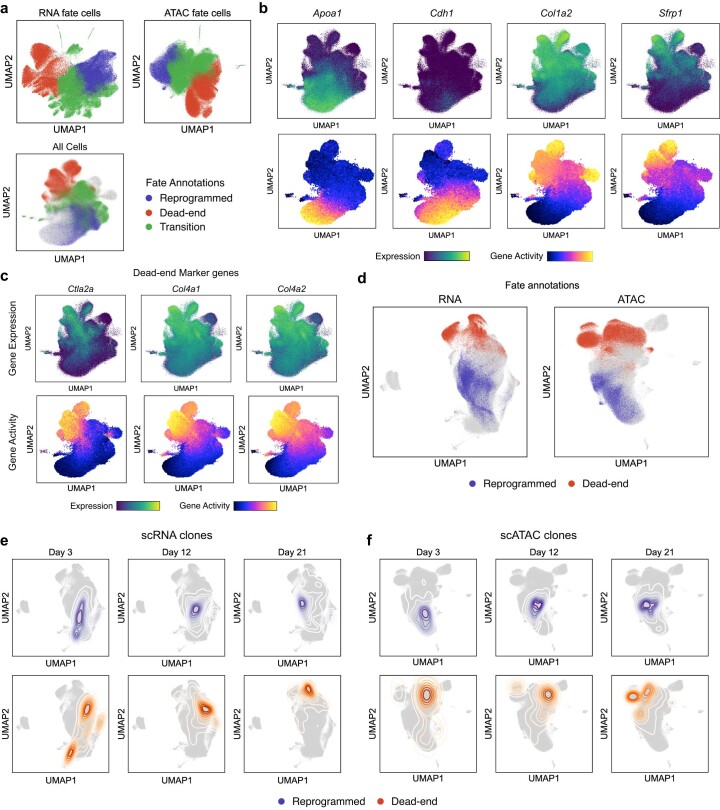
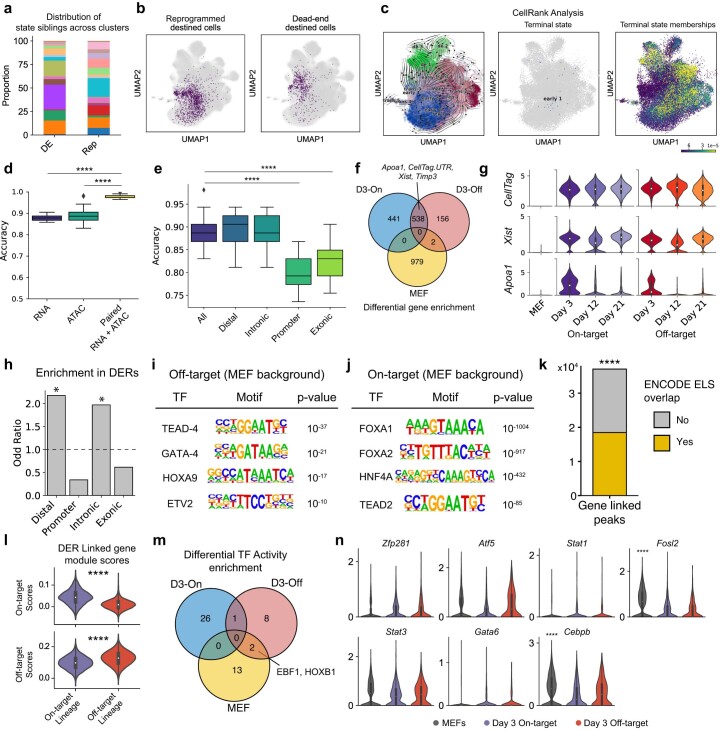
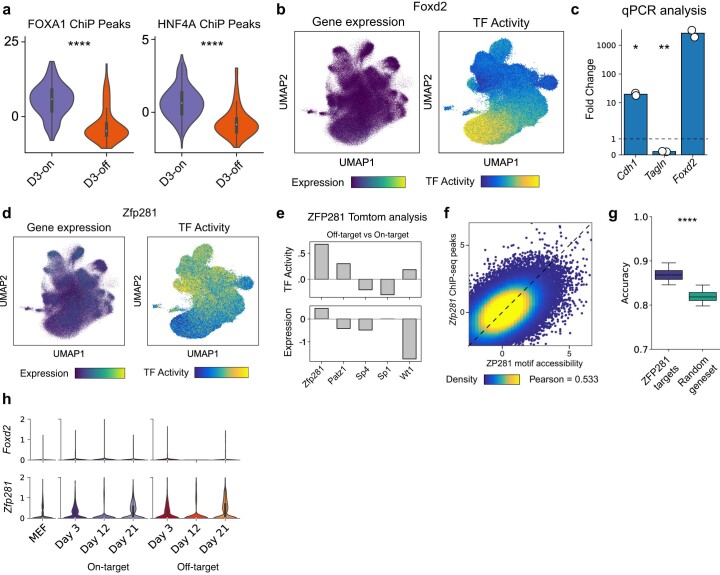
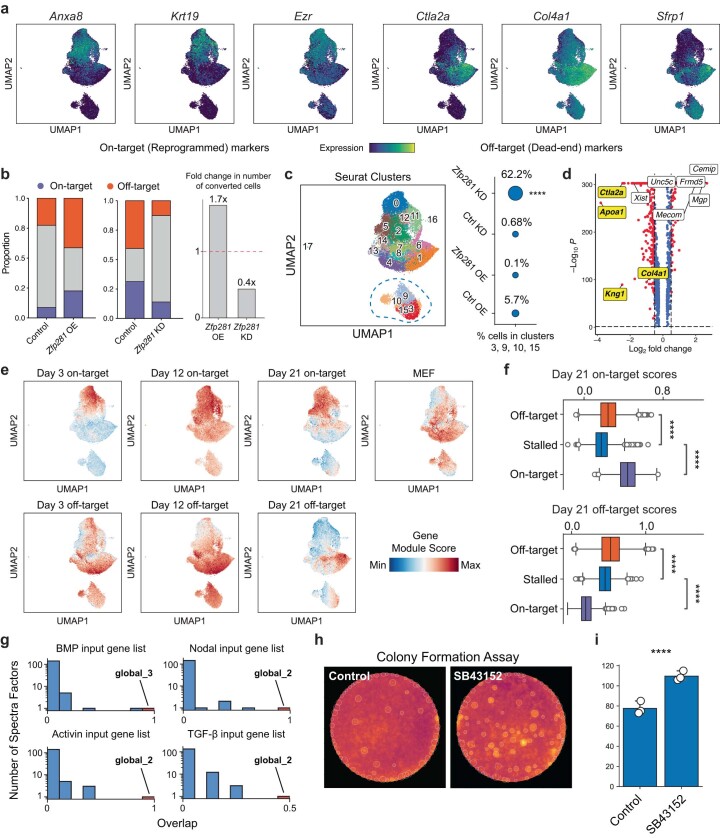
Complex gene regulatory mechanisms underlie differentiation and reprogramming. Contemporary single-cell lineage-tracing (scLT) methods use expressed, heritable DNA barcodes to combine cell lineage readout with single-cell transcriptomics. However, reliance on transcriptional profiling limits adaptation to other single-cell assays. With CellTag-multi, we present an approach that enables direct capture of heritable random barcodes expressed as polyadenylated transcripts, in both single-cell RNA sequencing and single-cell Assay for Transposase Accessible Chromatin using sequencing assays, allowing for independent clonal tracking of transcriptional and epigenomic cell states. We validate CellTag-multi to characterize progenitor cell lineage priming during mouse hematopoiesis. Additionally, in direct reprogramming of fibroblasts to endoderm progenitors, we identify core regulatory programs underlying on-target and off-target fates. Furthermore, we reveal the transcription factor Zfp281 as a regulator of reprogramming outcome, biasing cells toward an off-target mesenchymal fate. Our results establish CellTag-multi as a lineage-tracing method compatible with multiple single-cell modalities and demonstrate its utility in revealing fate-specifying gene regulatory changes across diverse paradigms of differentiation and reprogramming.


Conflict of interest statement

S.A.M. and K.J. are named inventors on a patent application for this technology. S.A.M. and G.R.G. are cofounders of CapyBio. The remaining authors declare no conflict of interest.

Figures

Fig. 1
Fig. 1. CellTag-multi allows simultaneous capture of lineage information with gene expression and chromatin accessibility.
a, A framework for relating early cell state with fate using single-cell lineage tracing. b, Schematic depicting the CellTag-multi lineage-tracing construct. c, Schematic detailing parallel capture of CellTags during scRNA-seq and modified scATAC-seq library preparation, using targeted isRT of CellTags in intact nuclei. CellTag-multi enables simultaneous clonal tracking of transcriptional and epigenomic states. d, Browser tracks comparing chromatin accessibility signal across aggregated scATAC-seq profiles generated using the original and modified library preparation methods. e, Scatterplot comparing log-normalized reads in ATAC peaks across aggregated scATAC-seq profiles generated with the original and modified library preparation methods. r = Pearson correlation coefficient. f, Plot for the human–mouse species-mixing experiment depicting the number of CellTag reads per cell from each CellTag library (1,778 human cells and 275 mouse cells shown). g, Heatmap showing scaled CellTag expression in scRNA-seq and scATAC-seq siblings for four multi-omic clones identified in a population of expanded reprogramming fibroblasts. h, Joint UMAP of RNA and ATAC cells with cells from two clones (clone 1, 70 cells; clone 2, 119 cells) highlighted, along with assay information. i, Browser track showing single-cell accessibility at the Ctla2b locus and Ctla2b gene expression across clones 1 and 2. Top, pseudo-bulk accessibility signal at the Ctla2b locus. j, Boxplots comparing intraclonal and interclonal correlation between clonally aggregated gene expression and gene activity scores in the reprogramming dataset (n = 29 clones used; Mann–Whitney–Wilcoxon test, two-sided; ***P = 5.16 × 104). Boxplots: center line, median; box limits, first and third quartiles; whiskers, 1.5× interquartile range.
Fig. 2
Fig. 2. Application of CellTag-multi to link early hematopoietic cell state with fate.
a, Schematic detailing the experimental design for the in vitro hematopoiesis state–fate experiment. b, scATAC-seq UMAPs with time point (left) and fate information (right) projected (Baso, Eos, Ery, Lym, Mast, Meg, Mono, Neu and pDC). Only major cell fates are highlighted. c,d, Hematopoietic fate hierarchy inferred from (c) scRNA or (d) scATAC clone coupling. e, scATAC-seq UMAPs with all state and fate siblings highlighted by fate. f, Clone-cell ForceAtlas (FA) embeddings with time point and fate projected onto cells (left and center) and clonal expansion information projected onto clones (right). g, FA embeddings with RNA and ATAC clonal expansion projected onto 1,000 multi-omic clones. Both modalities display expansion of early myeloid cells, consistent with our culture conditions. h, Bar plot of cell fates distribution across RNA and ATAC clones (fates colored as Fig. 2b). i, FA embedding with Hlf gene expression, a marker of hematopoietic stem and progenitor cells, projected onto the scRNA cells. j, FA embeddings with state (day 2.5) subclones highlighted for each major lineage along the differentiation continuum for both modalities and fate bias projected. k, Box plot comparing overlap between RNA and ATAC state subclones within and across cell fates (Mann–Whitney–Wilcoxon test, two-sided; P = 3.76 × 105; 5 intralineage and 20 interlineage comparisons). l, Volcano plots of differential feature enrichment analysis for each group of state subclones in scRNA (top) and scATAC (bottom). m, Box plot summarizing prediction accuracy values of trained state–fate prediction models. (Mann–Whitney–Wilcoxon test, two-sided; ****P < 0.0001, highly variable genes (HVG), n = 25 accuracy values for each model (Methods)). Boxplots, center line and median; box limits, first and third quartiles; whiskers, 1.5× interquartile range. Baso, basophils; Eos, eosinophils; Ery, erythroids; Lym, lymphoids; Mast, mast cells; Meg, megakaryocytes; Mono, monocytes; Neu, neutrophils; pDC: plasmacytoid dendritic cells.
Fig. 3
Fig. 3. Application of CellTag-multi to dissect clonal fate dynamics in direct reprogramming.
a, Experimental design for the direct reprogramming state–fate experiment. b, Cells from both scRNA-seq and scATAC-seq, across all time points, were co-embedded with clones and visualized using a UMAP. Left, time point information projected on cells. Right, clonal expansion visualized using clone nodes. c, Capybara transcriptional identity scores projected on scRNA-seq cells for reprogrammed, dead-end and fibroblast cell identities, based on a previous lineage-tracing dataset. Cell fates were annotated for days 12 and 21. Reprogrammed and dead-end cell fates are highlighted (lower right). d, Histogram of fate bias scores across all state–fate clones. Fate bias scores were calculated using cells from days 12 and 21. e, Clonal chromatin accessibility browser tracks for one dead-end and one reprogramming clone. f, Contour plots showing longitudinal tracking of cell fates enabled by CellTag-multi. g, Transcriptional identity dynamics tracked along both lineages. Dead-end cells depart from a MEF-like identity and acquire an off-target reprogrammed state. h,i, Significant clonal expansion is observed along both lineages, as depicted via alluvial plots, clone nodes and clonal expression levels of Mki67 (a proliferation marker gene) in the 20 largest (h) reprogramming/on-target and (i) dead-end/off-target clones.
Fig. 4
Fig. 4. Assessing fate-specific changes in early cell state.
a, Heatmap of genes uniquely enriched across uninduced MEFs or one of the two reprogramming fates on day 3 (false discovery rate (FDR) threshold = 0.05, log fold-change threshold = 0; D3-on: Day 3 on-target destined cells, D3-off: Day 3 off-target destined cells). b, Violin plots of several genes enriched in either off-target (dead-end) destined or on-target (reprogramming) destined cells. c, Heatmap of peaks uniquely enriched across uninduced MEFs or one of the two reprogramming fates on day 3 (FDR threshold = 0.05, log fold-change threshold = 1). Right, annotation of peaks linked to genes (Methods). d, Module scores for genes linked to either on-target or off-target DERs projected onto the clone-cell embedding. e, Top, accessibility browser tracks for each lineage split by day, highlighting peaks linked to late lineage markers (on-target: Aox3; off-target: Col28a1 and Vegfd) showing lineage-specific changes in accessibility on day 3. The Aox3- and Vegfd-linked DERs overlap perfectly with an ENCODE Enhancer-Like Signature (ELS) element, while the Col28a1-linked DER is within 100 bp of an ELS. Bottom, expression levels of the three genes across MEFs and the two reprogramming lineages split by days (Mann–Whitney–Wilcoxon test; two-sided; Bonferroni corrected ****P < 0.0001). f, Heatmap of TF activities uniquely enriched across uninduced MEFs or one of the two reprogramming fates on day 3 (FDR threshold = 0.05, mean difference threshold = 0.5). g, Heatmap showing TF activity (left) and gene expression (right) levels for off-target associated TFs in MEFs and each reprogramming lineage split by time points. TF activity scores show a much stronger lineage bias as compared to gene expression. Box plot definitions for b and e—center point, median; box limits, first and third quartiles; whiskers, up to 1.5× interquartile range; cell numbers—as indicated in Extended Data Fig. 6d.
Fig. 5
Fig. 5. Identification of TF regulators of on-target and off-target reprogramming fate.
a, Violin plots of FOXA1 and HNF4A TF activities and Hnf4α–Foxa1 transgene expression across the two fates on day 3 (Mann–Whitney-Wilcoxon test; two-sided; FOXA1 P = 1.2 × 1020, HNF4A P = 4.7 × 1019, Hnf4α–Foxa1 P = 1.3 × 1041; cell numbers—as indicated in Extended Data Fig. 6d). b, Top ten TF activities enriched in on-target destined cells. c, Representative images from the Foxd2 OE colony formation assay (CFA, left); mean CDH1+ colony counts in Foxd2 OE versus standard reprogramming (right, t-test, two-sided; *P = 0.025; n = 2 biological replicates). d, Top ten TF activities enriched in off-target destined cells. e, Representative images from the Zfp281 OE CFA (left); mean CDH1+colony counts in the Zfp281 OE versus standard reprogramming (right; t-test, two-sided; *P = 0.017; n = 6 biological replicates). f, scRNA-seq experiment schematic for Zfp281 OE and KD during reprogramming. g, UMAP for cells from Zfp281 OE and KD experiments; sample, cell fate and Seurat clusters projected. h,i, iEP identity scores (h) and dead-end identity scores (i) across the KD and OE samples compared to controls (Mann–Whitney–Wilcoxon test, two-sided; iEP: OE versus control, P = 1.07 × 1053; KD versus control, P = 2.19 × 1053; dead-end: OE versus control, P = 1.11 × 1011; KD versus control, P = 3.26 × 10120). j, Activin/nodal/TGF and BMP spectra factor scores across control, OE and OE-high cells (top) and control, KD and KD-high cells (bottom). Mean scores are normalized relative to controls. OE-high cells: subset of OE cells with above average Zfp281 expression. KD-high cells: subset of KD cells with below average Zfp281 expression (Mann–Whitney–Wilcoxon test, two-sided; ****P < 0.0001; ***P < 0.001; **P < 0.01; NS = P > 0.05). k, Fold-change in reprogramming and dead-end marker genes expression during TGF-β signaling inhibition compared to control, on day 5 of reprogramming (t-test, two-sided; Apoa1, *P = 0.02, Col1a2, *P = 0.02, Gsta4, *P = 0.04, Serpine1, *P = 0.009, Snail1, *P = 0.01; n = 2 technical replicates). Bar plots: error bars: 95% CI. Boxplots—center point, median; box limits, first and third quartiles; whiskers, up to 1.5× interquartile range. CI, confidence interval.
Extended Data Fig. 1
Extended Data Fig. 1. Development of CellTag-multi for parallel capture of lineage with scRNA-seq and scATAC-seq.
(a) Schematic comparing the original, CellTag lineage tracing construct to the CellTag-multi construct. (b) Left Panel: Detailed flow chart and schematic of the modified scATAC-seq library preparation protocol. Right Panel: Major molecular steps of the protocol and the final library containing both CellTag and chromatin accessibility fragments. (c) Bar plot comparing total number of CellTag reads per library obtained across different scATAC-seq library preparation methods. Each library was sequenced to a similar sequencing depth. (d) Mean percent cells with at least one CellTag detected in scATAC-seq, relative to scRNA-seq (n=2 samples/assay). Plots for (e) fragment size distribution and (f) various scATAC-seq quality metrics across two datasets generated using the ‘original’ and ‘modified’ scATAC-seq library preparation method (nFrags/cell: number of unique fragments per cell; FRiP: Fraction of reads in Peaks; Cell numbers – Original: 1000; Modified: 977). Boxplots: center line, median; box limits, first and third quartiles; whiskers, 1.5x interquartile range. (g) Schematic of the species mixing experiment to assess purity of CellTag signatures in scATAC-seq. (h) Bar plot depicting distribution of CellTag reads across, human, mouse, doublet and non-cell droplets for the two CellTag libraries. We observed that the majority of CellTag reads mapped to the expected species of origin, 87.2% for the mouse library and 91.4% for the human library. (i) Bar plot showing cross-talk levels (Methods) across the human and mouse cells profiled. (j) Line plots showing relative abundance of individual CellTag barcode across the four plasmid library preparations. The four individual libraries were pooled to obtain the final high complexity CellTag-multi library.
Extended Data Fig. 2
Extended Data Fig. 2. Testing CellTag-multi in cell lines and reprogramming fibroblasts.
(a) Schematic depicting the workflow for CellTag library allow listing and clone identification from single-cell CellTag reads. (b) Heatmap depicting scaled CellTag expression across ten clones in a population of expanded reprogramming fibroblasts. (c) Correlation between CellTag abundance across scRNA-seq and scATAC-seq cells from the reprogramming dataset (Pearson’s correlation coefficient = 0.724). (d) UMAPs for CellTagged, expanded, reprogrammed fibroblasts profiled with scRNA-seq, scATAC-seq and 10x Multiome with cells containing any CellTag reads highlighted. The percentage of cells with any detectable CellTag reads in each dataset are mentioned above respective UMAPs. (21,637 scRNA-seq, 20,466 scATAC-seq and 20,231 Multiome cells shown) (e) Bar plot showing a reduction in the total number of unique tags detected after quality filtering in the Multiome cells as compared to scRNA and scATAC cells. (f) UMAPs comparing number of cells with CellTags after error correction, allow listing and filtering (g) Line plot comparing library complexity for CellTag amplicon libraries across scRNA and Multiome datasets at different read depths (Methods). scATAC cells are excluded from this comparison as those do not contain any UMIs. (h) Violin plots depicting key scRNA-seq and scATAC-seq quality metrics for the single modality and multiome assays.
Extended Data Fig. 3
Extended Data Fig. 3. Single-cell metrics and cell annotation in hematopoiesis.
(a) Violin plots for single-cell quality metrics for the scRNA-seq and scATAC-seq data. Day 2.5: 5,161 (RNA) and 4,628 (ATAC) cells; Day 5: 56,534 (RNA) and 10,495 (ATAC) cells. (b) Unique fragments/cell vs single-cell TSS enrichment scatterplots and fragment size distribution plot for the two scATAC-seq time-points. (c) scRNA-seq UMAPs with time point (left panel) and cell fate information (right panel) projected. (d) Table summarizing clones identified in scRNA and scATAC datasets independently. (e) RNA fate hierarchy trees built with fewer cells are more discordant with the tree built using the full dataset (n=10 rounds of subsamplings for each indicated cell count). (f) scRNA-seq UMAPs with state and fate siblings for major hematopoietic fates highlighted. (g) Bar plots comparing number of clones and cells in clones across single-modality and joint modality clone calling. (h) Histograms of CellTags detected per cell across scRNA-seq and scATAC-seq datasets after filtering and processing of CellTag reads. (i) Tables summarizing all clones identified in the dataset. (j) Workflow for joint embedding of cells and clone nodes. (k) Top Left: Clone-cell embedding with RNA and ATAC assay information projected (cells only). Top Right and Bottom Left: Comparison of cell embeddings obtained using a conventional FA embedding vs a joint clone-cell graph-based embedding (only cell nodes shown, for direct comparison). Bottom Right: Clone-cell graph FA embedding with cells colored by deviation in their position between the two embeddings. (l) Visualization of clones along with their constituent cells confirms that clone nodes faithfully represent cells. Boxplots in a: center line: median; box limits: first and third quartiles; whiskers: up to 1.5x interquartile range.
Extended Data Fig. 4
Extended Data Fig. 4. Fate annotation in hematopoiesis.
(a) Marker gene expression and (b) accessibility projected on the FA embedding for various hematopoietic cell fates. (c) FA embedding with the full set of cell annotations in the hematopoiesis dataset projected. (d) Bar plot summarizing proportion of cells with at least one detectable CellTag across major cell fate clusters. CellTags are profiled uniformly across all cell states. (e) Table summarizing number of clones identified in each fate. Clonal fate was annotated using the most dominant cell type amongst Day 5 fate siblings. (f) Schematic depicting joint embedding of sub-clones with cells using the clone-cell embedding method. (g) FA embedding with fate sub-clone nodes for major lineages highlighted. (h) Plot showing that fate bias increases from the periphery of each state group towards the center. The closeness metric is directly proportional to the closeness of a state sub-clone node to the centroid of its state group in a 30-dimensional UMAP space (Methods).
Extended Data Fig. 5
Extended Data Fig. 5. Machine learning analysis to predict cell fate from state.
(a) Schematic of state-fate prediction analysis. (b) Accuracy values obtained with the three model architectures for either RNA (left) or ATAC (right) data (n=25 accuracy values/boxplot). (c) Same plot as Fig. 2m but for F1-weighted scores (Mann Whitney Wilcoxon test, two-sided, n=25 values/boxplot). (d) Boxplots showing variation in F1-weighted score values for ATAC models trained on full peak sets for ‘all’, ‘distal’, ‘intronic’, ‘exonic’ or ‘promoter’ peaks (left) and subsetted ‘distal’, ‘intronic’, ‘exonic’ and ‘promoter’ peak sets(right; n = 8823 peaks; Mann Whitney Wilcoxon test, two-sided; n=25 accuracy values/boxplot). (e) Heatmaps depicting mean TF activity scores for fate predictive TFs across groups of state siblings. TFs show strong fate biased enrichment patterns in ‘distal’, ‘intronic’ and ‘all’ peaks but not exonic and promoter datasets. (f) Heatmap depicting Rank correlation of SHAP values for top predictive TFs shows high similarity between ‘distal’, ‘intronic’ and ‘all’ peaks models. (g) Bar plots of mean absolute SHAP values for a few TFs for fates as indicated. Bars are colored based on value of SHAP correlation. SHAP analysis reveals that motif activity of many lineage specifying TFs is less predictive of cell fate in ‘promoter’ and ‘exonic’ models, while remains comparable across models for some others. Positive SHAP correlation for a feature in a given fate implies that higher values of the feature lead to higher probability of the model outputting that fate label. Negative correlation indicates lower values of the feature lead to higher probability of the model outputting that fate label. All boxplots: center line, median; box limits, first and third quartiles; whiskers, 1.5x interquartile range. For c and d: p-values: **** = p < 0.0001; ** = p < 0.01; * = p < 0.05. Exact p-values in Supplementary Table 12.
Extended Data Fig. 6
Extended Data Fig. 6. Single-cell metrics for the direct reprogramming dataset.
(a) Single-cell quality metrics for the scRNA-seq and scATAC-seq datasets, split by biological replicates. Cell numbers - MEF: 10,119; Rep 1: 92,261 (RNA) and 92,367 (ATAC); Rep 2: 123,827 (RNA) and 121,200 (ATAC). (b) Unique fragments/cell vs single-cell TSS enrichment scatterplots and fragment size distribution plots for the scATAC-seq dataset. (c) Histograms of number of CellTags detected per cell across the two biological replicates after filtering and processing of CellTag reads. (d) Summary of all clones identified across single-cell modalities, for both biological replicates. (e) Venn diagram showing overlap of CellTag signatures across the two biological replicates. (f) UMAPs depicting representative clone nodes from both biological replicates along with their constituent cells. (g) Cells in the clone-cell embedding UMAP with assay information projected shows uniform embedding of both single-cell modalities. (h) UMAP with all clone nodes highlighted shows uniform distribution of clones across all cell states except the unlabeled MEFs.
Extended Data Fig. 7
Extended Data Fig. 7. Fate annotation in direct reprogramming.
(a) UMAPs with ‘reprogrammed’, ‘dead-end’ and ‘transition’ fate information projected. Fate cells (Days 12 and 21) were re-clustered and annotated with one of the three fates based on marker gene expression/accessibility, in both modalities independently. (b) Clone-cell embedding UMAPs with expression and accessibility information for key marker genes projected. (c) UMAPs with expression and accessibility information of key dead-end marker genes projected. (d) UMAPs for individual modalities with reprogrammed and dead-end fate information projected. (e,f) Contour plots showing longitudinal tracking of cell fates enabled by CellTag-multi, independently for both scRNA and scATAC.
Extended Data Fig 8
Extended Data Fig 8. Differential analysis of expression and chromatin accessibility state across lineages.
(a) Distribution of reprogramming and dead-end destined cells across clusters and (b) their projection on the clone-cell embedding UMAP. (c) CellRank fails to reveal true lineage dynamics underlying reprogramming. Velocity vectors overlaid onto the UMAP (left). ‘Early_1’, a cluster from Day 3 cells identified as a terminal state (middle). Continuous membership values for the terminal state ‘Early_1’ (right). (d) Fate prediction from Day 3 cell state using random forest classifiers. (Mann Whitney Wilcoxon test, two-sided; p-values: Paired vs ATAC = 3.5e-09; Paired vs RNA = 1.4e-09; n=25 accuracy values/boxplot). (e) State-fate prediction analysis using subsets of peaks (Mann Whitney Wilcoxon test, two-sided; p-values: All vs Promoter = 1.757e-08; All vs Exonic = 1.052e-07; n=25 accuracy values/boxplot). (f) Differentially enrichment genes across uninduced MEFs and the two fates on Day 3. (g) Violin plots for several genes enriched in both reprogramming fates on Day 3. (h) DERs are enriched in distal and intronic regions of the genome. (Fischer’s exact test, one-sided; p-values: 0 for both intronic and distal peaks). HOMER analysis to identify motifs enriched in (i) Off-target (dead-end) DERs and (j) On-target (reprogrammed) DERs, compared to a MEF DER background. (k) Enrichment of ENCODE cCRE Enhancer Like Elements in gene linked peaks. (Permutation test, one-sided; 10,000 permutations, p-value: 1e-04). (l) Enrichment of DER linked genes’ module scores in each lineage (Mann Whitney Wilcoxon test, two-sided; p-values: top = 6.2e-221; bottom = 0). (m) Differentially enriched TF activities across uninduced MEFs and the two reprogramming fates on Day 3. (n) Violin plots showing expression of off-target TFs, as identified from TF activity analysis, across uninduced MEFs and the two fates on Day 3. Cdx1 expression was not detected in any of the groups and is hence not plotted (Bonferroni corrected p-values: Cebpb = 1.64e-14, Fosl2 = 1.37e-39). All boxplots: center line, median; box limits, first and third quartiles; whiskers, 1.5x interquartile range. Panels g, l and n: Cell numbers – MEF: 10,526; Others – as indicated in Extended Data Fig. 6d.
Extended Data Fig. 9
Extended Data Fig. 9. Identification of Zfp281 and Foxd2 as regulators of iEP reprogramming.
(a) Violin plots comparing accessibility z-scores of FOXA1 and HNF4A genomic binding sites across the two reprogramming fates on Day 3 (Mann Whitney Wilcoxon test, two-sided; p-value: FOXA1 = 1.159e-19, HNF4A = 2.2e-18) suggesting higher on-target binding of the two TFs in the on-target reprogramming lineage on Day 3. (b) Projection of Foxd2 gene expression and FOXD2 TF activity levels on the clone-cell embedding. (c) Bar plots showing fold-change in on-target and off-target marker genes (Cdh1 and Tagln respectively) upon Foxd2 over-expression, compared to a GFP control, on reprogramming day 12 (t-test; p-values: Tagln = 0.006, Cdh1 = 0.03; n=2 biological replicates). (d) Projection of Zfp281 gene expression and ZFP281 TF activity levels on the clone-cell embedding. (e) Tomtom analysis identified four dead-end enriched TFs with significantly similar motifs to ZFP281. ZFP281 shows the highest enrichment in dead-end cells for both gene expression and TF activity levels across all TF candidates. (f) Scatterplot showing correlation between single-cell accessibility of ZFP281 genomic binding sites and ZFP281 motifs (Pearson correlation coefficient = 0.533). (g) Boxplot showing significantly higher cell fate prediction accuracy using ZFP281 target genes (1,612 genes) compared to a size matched set of random genes (Mann Whitney Wilcoxon test, two-sided; p-value = 2.248e-09; n=25 accuracy values/boxplot). (h) Violin plots showing expression levels of Foxd2 and Zfp281 in uninduced MEFs and along the two lineages. All boxplots: center point: median; box limits: first and third quartiles; whiskers: upto 1.5x interquartile range. Panels a and h: Cell numbers – MEF: 10,526; Others – as indicated in Extended Data Fig. 6d.
Extended Data Fig 10
Extended Data Fig 10. Single-cell analysis of Zfp281 knockdown and overexpression.
(a) Projection of key on-target and off-target reprogramming marker genes on the UMAP for Zfp281 overexpression and knockdown cells. (b) (Left Panel) Bar plots showing proportion of on-target and off-target fate cells and (Right Panel) change in total number of reprogrammed cells across the KD and OE experiments. A positive correlation between rate of reprogramming and Zfp281 expression suggests a role for the TF in promoting fate conversion away from the starting MEF identity. (c) (Left Panel) UMAP highlighting a distinct sub-population of cells, likely representing a stalled reprogramming cell state. (Right Panel) Dot plot showing the proportion of each sample in the stalled clusters. Cells from the Zfp281 KD sample are enriched in the stalled cell states (Permutation test, one-sided; p-value = 0; 100,000 trials). (d) Volcano plot showing genes differentially enriched in the stalled cell sub-population (adjusted p-value < 0.05; Benjamini-Hochberg correction, absolute log2 fold-change > 0.5). (e) Gene expression module scores for MEF, on-target and off-target marker genes from all three time points, based on the lineage tracing experiment, projected on the UMAP. (f) Boxplots comparing module scores for Day 21 off-target, and Day 21 on-target marker genes module scores across stalled cells and the two reprogrammed clusters (Mann Whitney Wilcoxon test, two-sided; **** = p-value < 0.0001; Exact p-values in Supplementary Table 12; Cell numbers – Off-target: 7,069; On-target: 1,706; stalled: 4,726). Boxplots: center line, median; box limits, first and third quartiles; whiskers, 1.5x interquartile range. (g) Histograms showing overlap of all learned Spectra factors with each signaling pathway input gene list. BMP input list overlaps maximally with the ‘global_3’ factor (overlap = 1) while Activin, Nodal and TGF-β input lists overlap maximally with the ‘global_2’ factor (overlap = 1 for Activin and Nodal; overlap = 0.5 for TGF-β). (h) Representative images from the SB43152 colony formation assay; (i) Mean CDH1-positive colony counts in cells cultured in presence of SB43152 compared to a standard reprogramming experiment (t-test, two-sided; p-value = 2.26e-3; n = 3 biological replicates). Error bars represent 95% CI.

References

    1. Clevers H, et al. What is your conceptual definition of ‘cell type’ in the context of a mature organism? Cell Syst. 2017;4:255–259. - PubMed
    1. Stuart T, Satija R. Integrative single-cell analysis. Nat. Rev. Genet. 2019;20:257–272. - PubMed
    1. Morris SA. The evolving concept of cell identity in the single cell era. Development. 2019;146:dev169748. - PubMed
    1. Kester L, van Oudenaarden A. Single-cell transcriptomics meets lineage tracing. Cell Stem Cell. 2018;23:166–179. - PubMed
    1. VanHorn S, Morris SA. Next-generation lineage tracing and fate mapping to interrogate development. Dev. Cell. 2021;56:7–21. - PubMed

Substances