. 2023 Nov;4(11):1544-1560.
doi: 10.1038/s43018-023-00622-y. Epub 2023 Sep 25.

Endothelial Notch1 signaling in white adipose tissue promotes cancer cachexia

Affiliations

Endothelial Notch1 signaling in white adipose tissue promotes cancer cachexia

Jacqueline Taylor et al. Nat Cancer. 2023 Nov.

Abstract

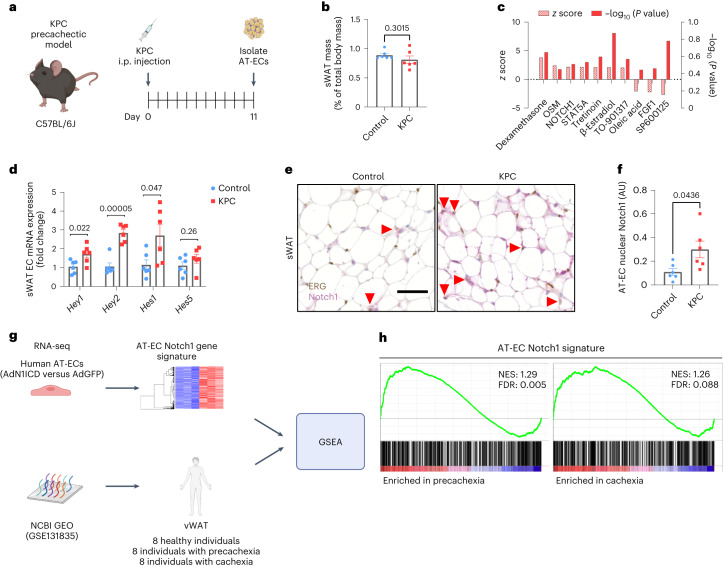
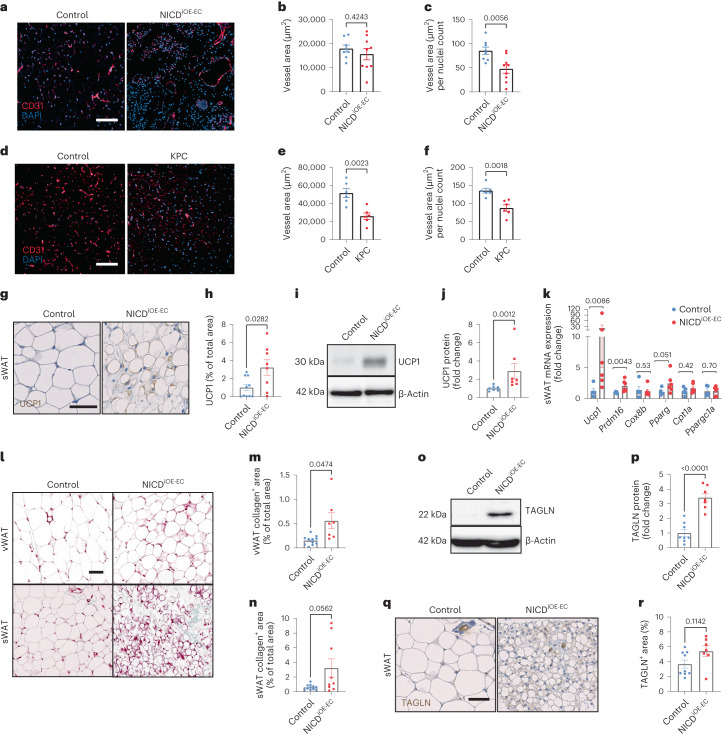
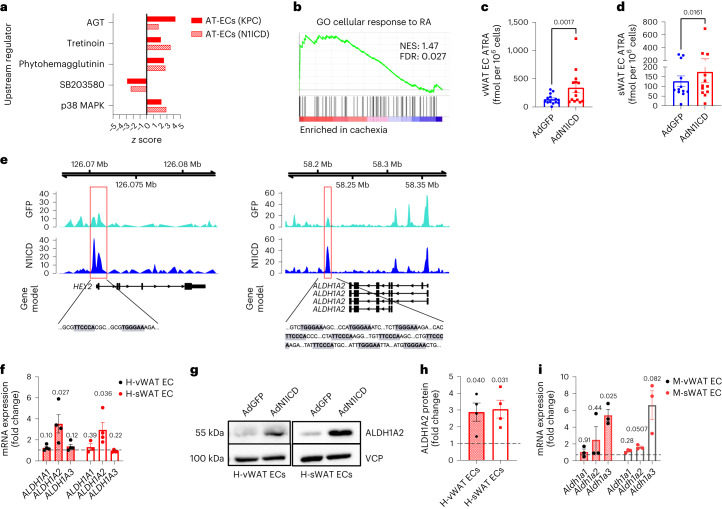
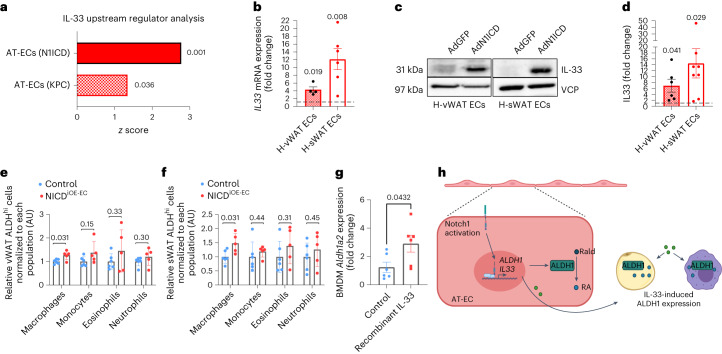
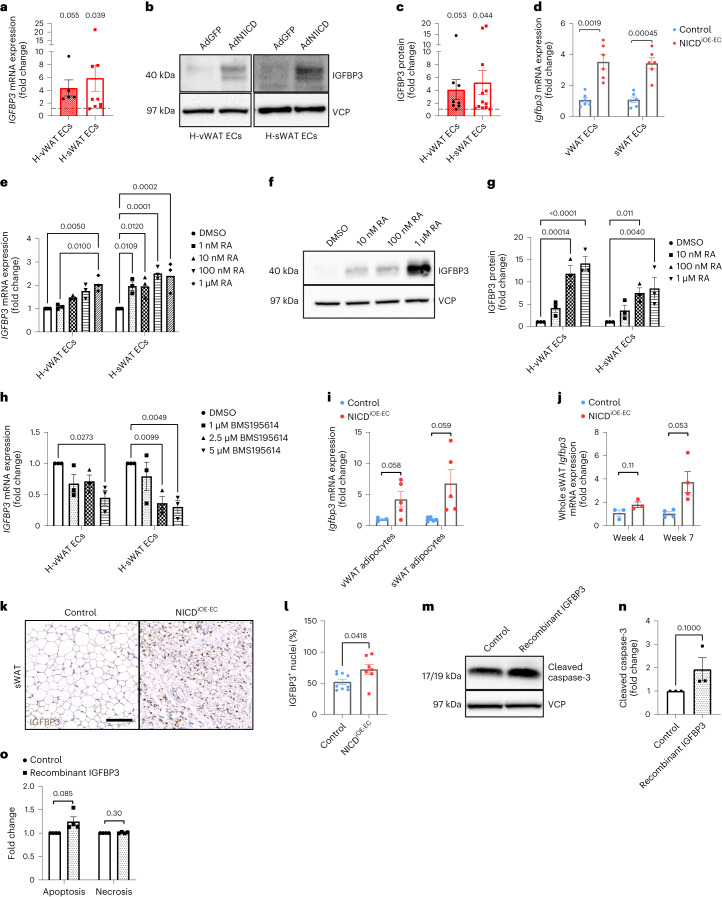
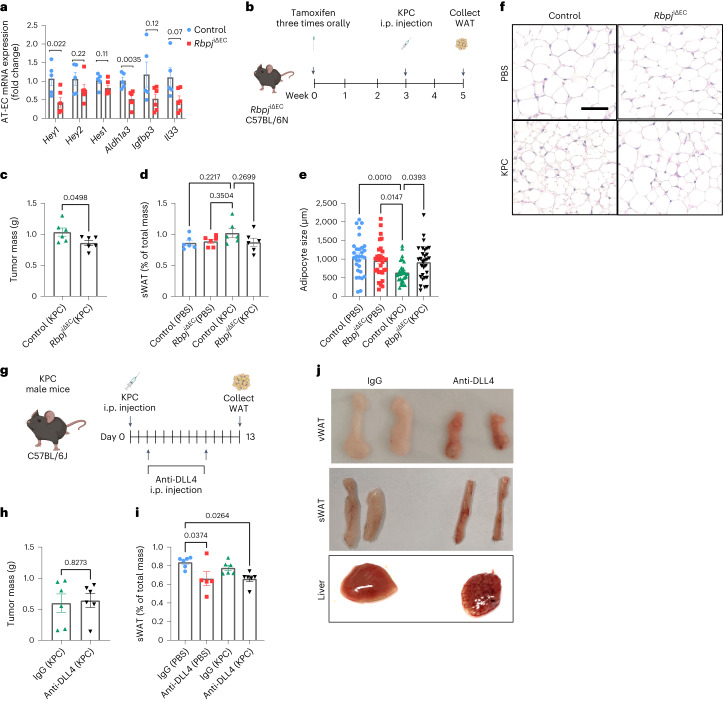
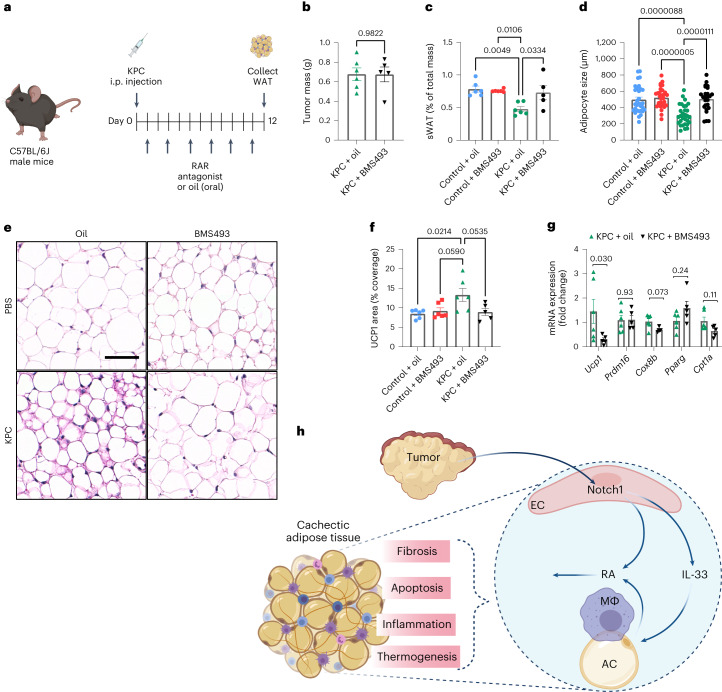
Cachexia is a major cause of morbidity and mortality in individuals with cancer and is characterized by weight loss due to adipose and muscle tissue wasting. Hallmarks of white adipose tissue (WAT) remodeling, which often precedes weight loss, are impaired lipid storage, inflammation and eventually fibrosis. Tissue wasting occurs in response to tumor-secreted factors. Considering that the continuous endothelium in WAT is the first line of contact with circulating factors, we postulated whether the endothelium itself may orchestrate tissue remodeling. Here, we show using human and mouse cancer models that during precachexia, tumors overactivate Notch1 signaling in distant WAT endothelium. Sustained endothelial Notch1 signaling induces a WAT wasting phenotype in male mice through excessive retinoic acid production. Pharmacological blockade of retinoic acid signaling was sufficient to inhibit WAT wasting in a mouse cancer cachexia model. This demonstrates that cancer manipulates the endothelium at distant sites to mediate WAT wasting by altering angiocrine signals.


Conflict of interest statement

The authors declare no competing interests.

Figures

Fig. 1
Fig. 1. Tumors induce Notch1 overactivation in the adipose tissue endothelium.
a, Timeline of AT-EC isolation from precachectic mice injected intraperitoneally (i.p.) with KPC pancreatic adenocarcinoma cells. b, Relative mass of sWAT collected from KPC precachectic mice (n = 6 animals per group). c, Top ten IPA-predicted upstream regulators of transcriptomic changes in sWAT AT-ECs from precachectic versus non-tumor-bearing mice. Plotted are z scores and –log10 (P values); n = 3–4. d, mRNA levels of prototypical Notch target genes and signaling components in precachectic AT-ECs (n = 6 animals per group). e, Representative images of ERG (DAB, brown) and Notch1 (AP, red) co-stainings comparing sWAT from PBS-injected (control) and KPC-injected mice; scale bar, 50 µm. f, Quantification of ERG+Notch1+ ECs in sWAT (n = 6 animals per group, ten images averaged per mouse); AU, arbitrary units. g, Enrichment of an ‘AT-EC Notch1 gene signature’ was analyzed in publicly available datasets from whole vWAT biopsies from healthy individuals and individuals with precachexia and cachexia (GSE131835). h, Enrichment plots of the ‘AT-EC Notch1 gene signature’ comparing precachectic and cachectic vWAT to healthy vWAT; NES, normalized enrichment score; FDR, false discovery rate. Data shown represent mean ± s.e.m. Data were analyzed by unpaired, two-sided t-test with Welch correction. Experiments in b and d were performed twice with consistent results. Results shown are from one representative experiment. Source data
Fig. 2
Fig. 2. Beiging and fibrosis drive NICDiOE-EC adipose tissue remodeling.
a, Representative images of CD31 and DAPI staining of control and NICDiOE-EC sWAT from two individual experiments; scale bar, 200 µm. b,c, Stainings were quantified based on vessel area (μm2; b) and vessel area (μm2) per nuclei count (c); n = 8–9 animals per group. d, Representative images of CD31 and DAPI staining of control and KPC sWAT from one individual experiment; scale bar, 200 µm. e,f, Stainings were quantified based on vessel area (μm2; e) and vessel area (μm2) per nuclei count (f); n = 6 biologically independent animals. g,h, Representative images from two individual experiments of UCP1 (DAB) staining of control and NICDiOE-EC sWAT (g) and quantification (h) as a percentage of total area (n = 8–10 animals per group); scale bar, 50 µm. i, Representative western blot of UCP1 expression from two individual experiments from whole control and NICDiOE-EC sWAT. j, UCP1 western blot quantification was normalized to β-actin (n = 7 animals per group). k, mRNA levels of thermogenic and/or beiging markers in whole sWAT (n = 5–6 animals per group). l, Representative images from two individual experiments of Masson’s trichrome-stained vWAT and sWAT; scale bar, 100 µm. m,n, Quantification of collagen areas as a percentage of total section area excluding the reticular interstitium in vWAT (n = 7–11 animals per group; m) and sWAT (n = 9–11 animals per group; n). o, Representative western blot of TAGLN expression in lysates from whole control and NICDiOE-EC sWAT. p, Quantifications were normalized to β-actin (n = 7–8 animals per group; P = 0.00004106). q,r, Representative images (q) from two individual experiments of TAGLN-stained (DAB) sWAT and quantification (r) of TAGLN+ area analyzed from whole sWAT sections; n = 7–9 animals per group; scale bar, 50 µm. Data shown represent mean ± s.e.m. and were analyzed by unpaired, two-sided t-test with Welch correction (b, c, e, f, h and m) or Mann–Whitney test (j, k, n, p and r). Experiments in ac, gj and lr were performed twice, and results were pooled from two independent experiments. Results were consistent between the two experiments. Source data
Fig. 3
Fig. 3. Notch1 regulates RA metabolism through ALDH1 expression.
a, Overlapping predicted upstream regulators of transcriptomic changes in KPC (precachectic) and N1ICD-overexpressing AT-EC datasets compared to their respective controls. b, GO term ‘cellular response to RA’ enrichment plot of cachectic versus healthy vWAT (GSE131835). c,d, Intracellular ATRA levels in human vWAT ECs (n = 14 biologically independent experiments; c) and sWAT ECs (n = 12 biologically independent experiments; d) treated with AdN1ICD or AdGFP were measured by mass spectrometry. e, vWAT ECs overexpressing AdN1ICD or AdGFP were analyzed by ChIP–seq using an antibody to H3K27ac. N1CD increased H3K27ac at the HEY2 locus (left, red box) and at the ALDH1A2 locus (right, red box). RBP-J binding motifs are identified within the regions associated with increased H3K27ac after N1ICD overexpression at both the HEY2 and ALDH1A2 loci. RBP-J binding motifs are highlighted by the gray boxes; Mb, megabases. f,g, mRNA levels of ALDH1 isozymes (n = 3–4 biologically independent experiments; f) and ALDH1A2 protein levels (g) analyzed by western blotting in human AT-ECs overexpressing AdN1ICD or AdGFP; H-vWAT, human vWAT; H-sWAT, human sWAT. h, Western blots were quantified and normalized to VCP (n = 4 biologically independent experiments). i, mRNA expression of Aldh1 isozymes in NICDiOE-EC AT-ECs (n = 3 biologically independent experiments). Data shown represent mean ± s.e.m. and were analyzed by Wilcoxon test (c and d) or unpaired, two-sided t-test with Welch correction (f, h and i). Source data
Fig. 4
Fig. 4. Notch1-induced IL-33 secretion increases whole-tissue ALDH1.
a, IPA comparative analysis of N1ICD-overexpressing AT-ECs and precachectic KPC AT-ECs identified IL-33 as a potential upstream regulator of transcriptomic changes. b, IL33 mRNA levels in N1ICD- compared to GFP-overexpressing human AT-ECs (n = 4–6 biologically independent experiments). c,d, Western blots (c) of human AT-EC IL-33 protein levels and quantification (d). Data were normalized to the expression of VCP (n = 6–8 biologically independent experiments). e,f, Analysis of Aldefluor activity in myeloid cells, including macrophages (CD45+CD11b+F4/80hi), monocytes (CD45+CD11b+Ly6GLy6C+), eosinophils (CD45+CD11b+SiglecF+) and neutrophils (CD45+CD11b+Ly6G+), by flow cytometry in vWAT (e) and sWAT (f) of NICDiOE-EC mice (n = 5–6 animals per group). Quantifications were normalized to each respective cell population. Flow cytometry experiments in e and f analyzing ALDHhi macrophages were performed twice with consistent results. Immunostainings and gatings for other ALDHhi myeloid cell populations were performed once. g, RT–qPCR analysis of Aldh1a2 mRNA expression in BMDMs treated with recombinant IL-33 for 72 h (n = 6 biologically independent experiments). h, Summary. WAT endothelial Notch1 mediates whole-tissue ALDH1 expression and RA production both directly and indirectly (via IL-33). Rald, Retinaldehyde. Data shown represent mean ± s.e.m. and were analyzed by unpaired, two-sided t-test with Welch correction. Source data
Fig. 5
Fig. 5. RA-regulated IGFBP3 production induces WAT apoptosis.
a, RT–qPCR analysis of IGFBP3 mRNA levels in AdN1ICD-overexpressing human AT-ECs compared to AdGFP controls (n = 5 (vWAT ECs) or 9 (vWAT ECs) biologically independent experiments). b,c, Representative western blot (b) and quantification (c) of IGFBP3 protein levels normalized to VCP (n = 8 (vWAT ECs) or 12 (sWAT ECs) biologically independent experiments). d, Igfbp3 mRNA levels in NICDiOE-EC AT-ECs isolated from male mice at 2 weeks after tamoxifen treatment (n = 6 animals per group). e,f, RT–qPCR (e) and western blotting (f) of IGFBP3 in human AT-ECs treated with 0 nM (DMSO only), 10 nM, 100 nM or 1 µM ATRA. The western blot image is representative of three individual experiments; n = 3 biologically independent experiments. g, IGFBP3 protein levels were quantified relative to VCP (n = 3 biologically independent experiments). h, RT–qPCR analysis of IGFBP3 expression in human vWAT and sWAT ECs after treatment with 1, 2.5 or 5 µM RAR antagonist BMS195614 or DMSO (n = 3 biologically independent experiments). i,j, RT–qPCR analysis of Igfbp3 levels in isolated NICDiOE-EC vWAT and sWAT adipocytes (n = 3–5 animals per group; i) as well as whole sWAT (j) at 4 and 7 weeks after recombination (n = 3 (week 4) or 4 (week 7) animals per group). k, IGFBP3 (DAB) immunohistochemical stainings of sWAT from NICDiOE-EC mice at 7 weeks after recombination; scale bar, 100 µm. Images are representative of two individual experiments. l, IGFBP3+ nuclei were quantified as a percentage of total nuclei (n = 7–9 animals per group pooled from two independent cohorts). m,n, Western blot (m) and quantification (n) of cleaved caspase-3 levels of SVF-differentiated adipocytes treated with recombinant IGFBP3 (100 ng ml–1) for 72 h. Data were normalized to VCP (n = 3 biologically independent experiments). o, Apoptosis (PS) and necrosis (7-AAD) were assessed using the Apoptosis/Necrosis Assay kit from Abcam (n = 4 biologically independent experiments; shown are biological replicates representing the averages of five technical replicates). Data shown represent mean ± s.e.m. and were analyzed by unpaired, two-sided t-test with Welch correction (a, c, d, i and j), two-way analysis of variance (ANOVA) with Dunnett’s test (e, g and h), Mann–Whitney test (l and n) or Sidak’s multiple comparisons test (o). The experiment in d was performed twice with consistent results. Shown is one representative experiment. Experiments in k and l were performed in two independent cohorts, and results were pooled. Results were consistent between the two experiments. Source data
Fig. 6
Fig. 6. Notch1-driven changes in vitamin A metabolism occur during precachexia.
a, RT–qPCR analysis of Aldh1 mRNA levels in AT-ECs from KPC mice (n = 5–6 animals per group). b, AT-EC Aldefluor activity in KPC mice versus in non-tumor-bearing control mice (n = 5–6 animals per group). c, RT–qPCR analysis of Igfbp3 mRNA levels in AT-ECs (n = 5–6 animals per group). d, RT–qPCR analysis of Il33 mRNA levels in AT-ECs (CD31+CD45) from KPC and control mice (n = 6 animals per group). e, Aldh1a2 mRNA expression in macrophages (CD45+CD11b+F4/80hi) from KPC mice (n = 6 animals per group). f, Flow cytometry histogram plot of Aldefluor activity in control and KPC macrophages. g, Analysis of ALDH activity in myeloid cells, including macrophages (CD45+CD11b+F4/80hi), monocytes (CD45+CD11b+Ly6C+), eosinophils (CD45+CD11b+SiglecF+) and neutrophils (CD45+CD11b+Ly6G+), measured by flow cytometry in sWAT from KPC and control mice (n = 5–6 animals per group). h,i, CD45+ immune cells (h) and myeloid cell populations (i) quantified as a percentage of total living cells (DAPI) in KPC and control sWAT (n = 5–6 animals per group). Data shown represent mean ± s.e.m. and were analyzed by Mann–Whitney test (a) or unpaired, two-sided t-test with Welch correction (be and gi). Experiments in a, c and d were performed twice with consistent results. Shown are data from one representative experiment. Source data
Fig. 7
Fig. 7. Pharmacological targeting of DLL4 does not inhibit cachexia progression.
a, RT–qPCR analysis of AT-EC Notch1 target genes from RbpjiΔEC and control mice (n = 5–6 animals per group). b, Analysis scheme of RbpjiΔEC mice. Mice were given tamoxifen 3 weeks before injection of KPC tumor cells or PBS as a control. Samples were analyzed on day 13 after KPC injection. c, KPC tumor mass in RbpjiΔEC mice compared to in control mice (n = 6 animals per group). d, Relative sWAT mass normalized to total mass in PBS- and KPC-treated mice (n = 6 animals per group). e,f, Average adipocyte size (e) quantified from hematoxylin and eosin (H&E) staining (f) of RbpjiΔEC sWAT. Shown are representative images from all groups; scale bar, 50 µm (n = 6 animals per group, five images per mouse). g, Analysis scheme of DLL4-neutralizing antibody treatment in KPC mice (n = 5–6 animals per group). h, KPC tumor mass in wild-type C57BL/6J mice treated with control IgG or anti-DLL4 (n = 6 animals per group). i, Relative sWAT mass normalized to total mass (n = 5–6 animals per group). j, Representative images of vWAT, sWAT and liver from non-tumor-bearing control mice injected with IgG or anti-DLL4. Data shown represent mean ± s.e.m. and were analyzed by unpaired, two-sided t-test with Welch correction (a, c and h) or one-way ANOVA with Tukey’s test (d, e and i). Source data
Fig. 8
Fig. 8. Pharmacological blockade of RA signaling inhibits WAT remodeling in cachexia.
a, Experimental setup of treatments given to KPC or non-tumor-bearing control mice. Mice were given BMS493 (RAR antagonist) or a solvent control orally every second day following KPC or PBS injection. b, Tumor mass of KPC mice given either oil or BMS493 (n = 5–6 animals per group). c, Percentage of sWAT mass normalized to total body mass (n = 5–6 animals per group). d, Adipocyte size quantified from sWAT H&E stainings (n = 5–6 animals per group, five images per mouse). e, Representative images of H&E-stained sWAT from one experiment; scale bar, 50 µm. f, UCP1 (DAB) immunohistological stainings were quantified as a percentage of total coverage area (n = 5–6 biologically independent animals). g, RT–qPCR analysis of thermogenic and/or beiging markers in whole sWAT tissue (n = 5–6 animals per group). h, Summary. Tumor-induced WAT endothelial Notch1 signaling mediates various hallmarks of adipose tissue wasting; MΦ, macrophage. Data shown represent mean ± s.e.m. and were analyzed by unpaired, two-sided t-test with Welch correction (b), one-way ANOVA with Tukey’s test (c, d and f) or Mann–Whitney test (g). Source data
Extended Data Fig. 1
Extended Data Fig. 1. Notch signalling is overactive in human and murine models of cancer cachexia.
a, RT-qPCR analysis of Notch1 ligands Jag1 and Dll4 as well as total Notch1 in sWAT ECs isolated from pre-cachectic KPC mice (n = 6 animals per group). b,c, RT-qPCR analysis of prototypical Notch1 target genes in muscle ECs (b) and heart ECs (c) of KPC mice compared to non-tumour bearing controls (n = 5-6 animals per group). d, Analysis scheme of whole tissue harvested from C26 cachectic mice. e, RT-qPCR analysis of prototypical Notch1 target genes and f, Notch ligands, Jag1, Dll4, and total Notch1 in whole sWAT harvested from C26 mice (n = 6 animals per group). g, RT-qPCR of prototypical Notch1 target genes in human vWAT ECs overexpressing AdN1ICD or AdGFP (n = 3 (HES1) or 4 (HEY1, HEY2) biologically independent experiments). h, Heatmap comparing expression levels of the top 10 leading edge genes of the ‘AT-EC Notch1 gene signature’ in patient samples (GSE131835). i, Heatmap of the top 20 leading edge genes of the ‘AT-EC Notch1 gene signature’ in KPC sWAT ECs isolated from mice during pre-cachexia and the corresponding j, GSEA enrichment plot. k, Human AT-ECs treated with recombinant IL-1β for 24 hours were analysed for JAG1 and HEY1 mRNA levels (n = 3 biologically independent experiments). l, Human AT-ECs treated with recombinant TNFα for 6 hours were analysed for JAG1and HEY1 mRNA levels (n = 3 biologically independent experiments). Data shown represent mean ± SEM, unpaired two-sided t-test with Welch correction. Experiments shown in a, b and c were performed twice with consistent results. Results shown are from one representative experiment. Source data
Extended Data Fig. 2
Extended Data Fig. 2. Chronic overactivation of EC Notch1 signalling induces lipodystrophy in male NICDiOE-EC mice.
a,b, RT-qPCR analysis of Notch1 target genes and ligands in male NICDiOE-EC AT-ECs isolated from vWAT (n = 6 animals per group; a) and sWAT (b) two weeks after tamoxifen treatment (n = 6 animals per group). c,d, Body (c) and relative vWAT mass (d) of NICDiOE-EC male mice 2-7 weeks post-recombination (n = 2-8 animals per group). e, Relative sWAT mass at weeks 4 and 7 in NICDiOE-EC male mice (n = 3-5 animals per group). f, Representative photograph of NICDiOE-EC vWAT at week 6 post-recombination. g,h, Representative images of vWAT and sWAT H&E stainings at weeks 4 (g) and 7 (h) from one (week 4) or two (week 7) independent experiments. Scale bar: 200 µm. il, Quantification of vWAT (n = 3-12 animals per group, 5 images per mouse; i and j) and sWAT (k and l) adipocyte area at weeks 4 (i and k) and 7 (j and l) quantified using the Adiposoft plugin for ImageJ (n = 3 or 5 animals per group, 5 images per mouse). m, Relative plasma leptin levels measured at week 7 by adipokine array (n = 4 animals per group). n, Basal blood glucose levels of male NICDiOE-EC mice between weeks 5 and 8 (n = 4-11 animals per group). o, Plasma LDL/VLDL and HDL cholesterol (n = 8-10 animals per group). p,q, NEFA (n = 5-6 animals per group; p) and TAG (n = 3-5 animals per group; q) measured in male NICDiOE-EC mice at week 7. r, Livers were stained with Oil Red O at week 7 when substantial fat loss was observed. Scale bar: 200 µM. s, Lipid droplet content was quantified from Oil Red O staining as percentage of total area (n = 7 animals per group). Data shown represent mean ± SEM, unpaired two-sided t-test with Welch correction (a-e, k, m-q) or Mann-Whitney test (i-l, s). Data in i and j were pooled from two individual experiments. Source data
Extended Data Fig. 3
Extended Data Fig. 3. Male but not female NICDiOE-EC mice are lipodystrophic at the timepoints analysed.
ac, Total body (a), vWAT (b) and sWAT (c) mass were compared in male and female NICDiOE-EC mice at 3 weeks post-recombination (n = 6 animals per group). d, vWAT mass was also compared at 6 weeks (n = 3-4 animals per group). e, Representative images of vWAT and sWAT H&E staining from female NICDiOE-EC mice at week 6. Scale bar: 100 µM. f, Plasma NEFA (n = 3-4 animals per group). g,h, TAG (n = 3-4 animals per group; g) and LDL/VLDL and HDL cholesterol levels (n = 2-4 animals per group; h) in female NICDiOE-EC mice. i,j, RT-qPCR comparison of prototypical Notch1 target genes in male and female vWAT (i) and sWAT (j) AT-ECs at 3 weeks post-recombination (n = 6 animals per group). Data shown represent mean ± SEM, 1-way ANOVA with Tukey’s test (ad), unpaired two-sided t-test with Welch correction (fh) or 2-way ANOVA (i and j). Experiments i and j were performed twice with consistent results. Shown is one representative experiment. Source data
Extended Data Fig. 4
Extended Data Fig. 4. Apoptosis contributes to NICDiOE-EC WAT loss in male mice.
a, Representative images of isolectin B4 whole mount stainings of NICDiOE-EC vWAT and sWAT at week 7 post-recombination. b,c, Isolectin B4+ endothelial coverage area was quantified (n = 5 animals per group). d, Enrichment plot of ‘Hallmark_apoptosis’ in cachectic compared to healthy vWAT (GSE131835). e, Adipose stromal cells (CD45-CD31-CD140+Sca1+) assessed in sWAT of KPC mice compared to non-tumour bearing controls for early apoptotic (Annexin V+PI), late apoptotic (Annexin V+PI+) and necrotic (Annexin VPI+) markers by flow cytometry (n = 5-6 animals per group). fi, Quantified percentages of apoptotic progenitors (CD45-CD31CD34+; f and g) and AT-ECs (CD45CD31+; h and i) in vWAT (g and i) and sWAT (f and h) of NICDiOE-EC mice at week 7 analysed by flow cytometry (n = 6-8 animals per group). j, Gating strategy of CD45CD31CD34+ adipose progenitors to assess early apoptosis (Annexin V+PI), late apoptosis (Annexin V+PI+) and necrosis (Annexin VPI+) by flow cytometry. k, Western blots of cleaved caspase-3 from control and NICDiOE-EC vWAT and sWAT. l,m, Quantifications of vWAT (l) and sWAT (m) cleaved caspase-3 levels normalized to VCP (n = 3-4 animals per group). n, Enrichment plot of ‘Hallmark_adipogenesis’ in healthy vWAT compared to cachectic patient samples (GSE131835). o, Western blot analyses of whole vWAT and sWAT ATGL protein levels normalized to the housekeeping protein VCP (n = 4 animals per group). p,q, Ser565 and Ser660 HSL phosphorylation and total HSL were quantified from whole sWAT and vWAT by Western blot analysis and normalized to the housekeeping protein VCP. The ratios of pHSL:HSL in vWAT (p) and sWAT (q) of NICDiOE-EC mice at week 5 post-recombination were quantified (n = 4 animals per group). Data shown represent mean ± SEM, Mann –Whitney test (b, c) or unpaired two-sided t-test with Welch correction (e-q). Source data
Extended Data Fig. 5
Extended Data Fig. 5. Enhanced collagen secretion and type 2 inflammation in NICDiOE-EC WAT.
a, Representative collagen IV, isolectin B4 and DAPI fluorescence stainings of NICDiOE-EC vWAT and sWAT sections at week 7 post-recombination. Scale bar: 100 µM. be, vWAT (n = 8 biologically independent animals pooled from two independent experiments) and sWAT (n = 9 animals per group pooled from two independent experiments) were quantified for total collagen IV expression as well as collagen IV:isolectin B4 co-localization. f,g, RT-qPCR analysis of extracellular matrix and fibrotic markers in vWAT (f) and sWAT (g); n = 3 animals per group. h, Representative images of H&E stained vWAT reticular interstitium. Scale bar: 20 µm. i, Average thickness of the reticular interstitium from vWAT H&E staining (n = 7-8 animals per group pooled from two independent experiments). j, RT-qPCR analysis of adhesion molecules in human AT-ECs from vWAT and sWAT overexpressing AdN1ICD compared to AdLacZ-overexpressing controls (n = 3 biologically independent experiments). k,l, Western blots (k) of VCAM-1 levels in human AT-ECs were quantified (l) and normalized to β-actin (n = 4 biologically independent experiments). m,n, RT-qPCR analysis of macrophage markers and cytokines in whole vWAT (m) and sWAT (n) of NICDiOE-EC mice at week 4 post-recombination (n = 3 animals per group). o,p, Western blot (o) of Arg-1 in whole NICDiOE-EC vWAT at week 6 was quantified (p) relative to VCP (n = 4 animals per group). Data shown represent mean ± SEM, Mann-Whitney test (be and p) or unpaired two-sided t-test with Welch correction (fn). Experiments ae and h and i were performed twice and results were pooled. Results were consistent between the two experiments. Source data
Extended Data Fig. 6
Extended Data Fig. 6. IL-33 upregulates ALDH1 and increases retinoic acid signaling in whole WAT.
a, Heatmap of genes associated with GO term ‘cellular response to retinoic acid’ in healthy, pre-cachectic and cachectic vWAT patient samples (GSE131835). bd, Enrichment plots of GO term ‘cellular response to retinoic acid’ in male (b) and female (c) vWAT from cachectic patients compared to healthy patient samples as well as AdN1ICD-overexpressing vWAT ECs compared to AdGFP controls (d). e, RT-qPCR analysis of genes involved in RA metabolism and/or RAR targets in human vWAT and sWAT ECs treated with AdN1ICD versus AdGFP-overexpressing cells (n = 3-5 biologically independent experiments). f,g, RT-qPCR analysis of mRNA expression levels of Aldh1 isozymes in whole vWAT (f) and sWAT (g) from NICDiOE-EC mice 4-5 weeks post-recombination (n = 6 animals per group). h, Gating strategy to analyse ALDH activity in myeloid cells. i, Human WAT organoid stained with Bodipy, anti-CD31 antibodies and DAPI. Scale bar: 200 µm. j, RT-qPCR analysis of ALDH1 isozymes (n = 6 biologically independent experiments), k, ALDHhiCD45+ immune cells in recombinant IL-33-treated organoids (10 ng/mL) compared to controls (n = 6 biologically independent experiments). l, Gating strategy to analyse ALDH activity in CD45+ immune cells of human WAT organoids. m,n, RT-qPCR analysis of Aldh1 isozymes in NICDiOE-EC vWAT (m) and sWAT (n) adipocytes (n = 3-5 biologically independent animals). o, RT-qPCR analysis of genes associated with retinoic acid signalling in NICDiOE-EC sWAT (n = 3 biologically independent animals). Data shown represent mean ± SEM, unpaired two-sided t-test with Welch correction (e-g, j, m, n, o) or Mann-Whitney test (k). Source data
Extended Data Fig. 7
Extended Data Fig. 7. Retinoic acid signaling in adipocytes and macrophages.
a,b, RT-qPCR analysis of Ucp1 (a) and beiging markers (b) in SVF-differentiated adipocytes treated with 0 nM (DMSO only), 10 nM, 100 nM or 1 µM ATRA for 24 hours (n = 3 biologically independent experiments). c, RT-qPCR analysis of Arg1 in BMDMs treated with ATRA for 72 hours (n = 3 biologically independent experiments). d, RT-qPCR analysis of Arg1 and Mrc1 in BMDMs treated with recombinant IL-33 for 72 hours (n = 3 biologically independent experiments). Data shown represent mean ± SEM, 1-way ANOVA (a), 2-way ANOVA (b) or unpaired two-sided t-test with Welch correction (c,d). Source data
Extended Data Fig. 8
Extended Data Fig. 8. BMS195614 downregulates RAR target genes in AT-ECs in vitro.
a,b, RT-qPCR analysis of prototypical RAR target genes in human vWAT (a) and sWAT (b) ECs upon treatment with 1, 2.5 or 5 µM of RAR antagonist BMS195614 or DMSO (n = 3 biologically independent experiments). Data shown represent mean ± SEM, 2-way ANOVA with Dunnett’s test (a, b). Source data
Extended Data Fig. 9
Extended Data Fig. 9. Confirmation of NICDiOE-EC findings in C26 and KPC cachexia models.
a, Gating strategy to quantify the percentage of ALDHhi AT-ECs of KPC pre-cachectic male mice. b, RT-qPCR analysis of Igfbp3 in whole sWAT from C26 cachectic mice compared to non-tumour bearing controls (n = 5 animals per group). c, RT-qPCR analysis of Aldh1 isozymes in whole sWAT from KPC pre-cachectic mice compared to non-tumour bearing controls (n = 6 animals per group). d, RT-qPCR analysis of Arg1 and Mrc1 in sorted macrophages (CD45+CD11b+F4/80hi) from KPC and non-tumour bearing mice (n = 6 animals per group). e, RT-qPCR analysis and comparison of Aldh1 isozymes in sWAT stromal cells (CD140a+Sca1+CD45CD31) vs. macrophages (CD45+CD11b+F4/80hi) FACS-sorted from KPC pre-cachectic mice compared to non-tumour bearing controls (n = 6 animals per group). f, Flow cytometry analysis of the number of myeloid cells per gram of sWAT, including macrophages (CD45+CD11b+F4/80hi), monocytes (CD45+CD11b+Ly6C+), eosinophils (CD45+CD11b+SiglecF+) and neutrophils (CD45+CD11b+Ly6G+), from pre-cachectic KPC mice (n = 5–6 animals per group). Data shown represent mean ± SEM, unpaired two-sided t-test with Welch correction (b, c, d, f). Source data
Extended Data Fig. 10
Extended Data Fig. 10. UCP1 immunohistochemical stainings of sWAT from KPC mice treated with BMS493 or DMSO (solvent control).
a, Representative images of UCP1 (DAB) stainings of sWAT from KPC or non-tumour bearing mice which received either oil (solvent control) or BM493 treatment orally from one individual experiment. Scale bar: 100 µm.

References

    1. Schmidt SF, Rohm M, Herzig S, Berriel Diaz M. Cancer cachexia: more than skeletal muscle wasting. Trends Cancer. 2018;4:849–860. - PubMed
    1. Fearon K, et al. Definition and classification of cancer cachexia: an international consensus. Lancet Oncol. 2011;12:489–495. - PubMed
    1. Batista ML, et al. Cachexia-associated adipose tissue morphological rearrangement in gastrointestinal cancer patients. J. Cachexia Sarcopenia Muscle. 2016;7:37–47. - PMC - PubMed
    1. Batista ML, et al. Heterogeneous time-dependent response of adipose tissue during the development of cancer cachexia. J. Endocrinol. 2012;215:363–373. - PubMed
    1. Franco FDO, et al. Cancer cachexia differentially regulates visceral adipose tissue turnover. J. Endocrinol. 2017;232:493–500. - PubMed

Publication types