. 2023 Nov;24(11):1890-1907.
doi: 10.1038/s41590-023-01633-8. Epub 2023 Sep 25.

Newborn and child-like molecular signatures in older adults stem from TCR shifts across human lifespan

Affiliations

Newborn and child-like molecular signatures in older adults stem from TCR shifts across human lifespan

Carolien E van de Sandt et al. Nat Immunol. 2023 Nov.

Abstract

CD8+ T cells provide robust antiviral immunity, but how epitope-specific T cells evolve across the human lifespan is unclear. Here we defined CD8+ T cell immunity directed at the prominent influenza epitope HLA-A*02:01-M158-66 (A2/M158) across four age groups at phenotypic, transcriptomic, clonal and functional levels. We identify a linear differentiation trajectory from newborns to children then adults, followed by divergence and a clonal reset in older adults. Gene profiles in older adults closely resemble those of newborns and children, despite being clonally distinct. Only child-derived and adult-derived A2/M158+CD8+ T cells had the potential to differentiate into highly cytotoxic epitope-specific CD8+ T cells, which was linked to highly functional public T cell receptor (TCR)αβ signatures. Suboptimal TCRαβ signatures in older adults led to less proliferation, polyfunctionality, avidity and recognition of peptide mutants, although displayed no signs of exhaustion. These data suggest that priming T cells at different stages of life might greatly affect CD8+ T cell responses toward viral infections.


Conflict of interest statement

P.T. is on the SAB of Immunoscape and Cytoagents and has consulted for JNJ. P.T. has also received travel support and/or honoraria from Illumina and 10x Genomics and has patents related to TCR discovery and expression. All other authors declare no competing interests.

Figures
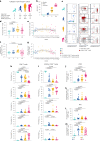
Fig. 1
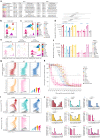
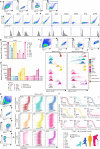
Fig. 1. Age-related changes in A2/M158+CD8+ T cell frequencies and phenotypes.
a, ‘Lifespan’ HLA-A*02:01-positive cohort, median age and number of donors per age category. b, Age distribution within the HLA-A*02:01-expressing lifespan cohort. c, Representative FACS panels and gating strategy for A2/M158+CD8+ T cells in the enriched fraction and phenotypic populations TCM (CD27+CD45RA) cells, TEM (CD27CD45RA), TEMRA (CD27-CD45RA+), Tnaive (CD27+CD45RA+CD95) and TSCM (CD27+CD45RA+CD95+) cells. Gray dots represent total CD8+ T cells in the unenriched sample, red dots are A2/M158+CD8+ T cells in the enriched sample. dg, Proportion of total CD8+ T cells (d,e) and frequency of A2/M158+CD8+ T cells (f,g) across different age groups. Open symbols indicate <10 A2/M158+CD8+ T cells counted, which were not used for phenotypic analyses. h,i, Frequency of naive and memory subsets within the total CD8+ T cell (h) or A2/M158+CD8+ T cell populations (i) across all age groups. jm, Frequencies of CD57 and PD-1 expression on CD8+ T cells (j and l, respectively) and A2/M158+CD8+ T cells (k and m, respectively) per age group. Horizontal bars indicate the median, dots represent individual donors, with n = 11 newborns, n = 12 children, n = 20 adults and n = 18 older adults (bh,j,l) and n = 10 newborns, n = 12 children, n = 20 adults and n = 16 older adults (i,k,m). Black line is a locally estimated scatter-plot smoothing) Loess trend line with error bands shaded in gray representing 95% confidence interval (CI) (e,g). Technical replicates were not performed due to limited samples. Statistical analysis was performed using a two-sided Kruskal–Wallis with Dunn’s correction for multiple tests. P values are indicated above the graphs. N, newborn; C, children; A, adult; OA, older adult. Source data
Fig. 2
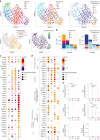
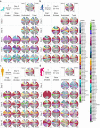
Fig. 2. Molecular differentiation of A2/M158+CD8+ T cells across human lifespan.
a, Dimensionality reduction (UMAP) and clustering of scRNA-seq data colored by clusters (top left), age groups (top middle), phenotype (top right), TCR features (bottom left) and clone size (bottom right). b, Distribution of age (left) and phenotype (right) in each UMAP cluster. Single-cell phenotypes were obtained via index-sorting protein expression data. c,d, Selected genes identified from differential expression analysis between A2/M158+CD8+ T cells in each UMAP cluster (c) or between A2/M158+CD8+T cells grouped by age (d) using pairwise comparison with a two-side hurdle model (MAST) without correction for multiple comparison (P < 0.05). Dot size represents the proportion of cells with non-zero expression. e, Comparison of exhaustion gene expression levels between A2/M158+CD8+ T cells grouped by their age, three donors per age group with n = 174 single A2/M158+CD8+ T cells from newborns, n = 219 from children, n = 261 from adults and n = 139 from older adults. Pairwise group comparisons were performed with two-sided Wilcoxon rank-sum test and Bonferroni-adjusted P values are reported (*P < 0.05, **P < 0.01, ***P < 0.001, ****P < 0.0001). N, newborn; C, children; A, adult; OA, older adult.
Fig. 3
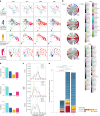
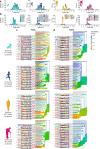
Fig. 3. Single-cell transcriptomics shows evolutionary trajectory across human life.
a, PAGA analysis of single cells (n = 793) identified five clusters (left) and their relative connectivity (middle) and colored based on the four UMAP clusters (right). b, PAGA analysis colored by age (left), phenotype (right). Single-cell phenotypes were obtained via index sorting. c, PAGA analysis colored by public TCR features (left), TRBV27 expression (middle) and clone size (right). Bar charts represent respective age, phenotype and TCR features distributions in each PAGA cluster. d, Trajectory derived from scRNA-seq data with colored pseudotime values (large panel). Loess curves represent the changes along the trajectories of age groups (top left), phenotype based on protein expression (top right), TCR features (middle) and the dot-plot shows expression values of selected genes measured via scaled mean expression along the pseudotime size of the dots corresponds to the percentage of cells expressing the gene in the given pseudotime state (bottom). Colored lines are a Loess fit, with error bands shaded in matching colors representing the 95% CI (d, bottom left). N, newborn; C, children; A, adult; OA, older adult.
Fig. 4
Fig. 4. Age-related changes in A2/M158+CD8+ TCRαβ repertoire.
ae, A2/M158+CD8+ T cells were enriched by TAME followed by single-cell sorting for TCRαβ analysis. a, A 2D kernel principal-component analysis (PCA) projection of the A2/M158+CD8+ TCR landscape colored by Vα, Jα, Vβ and Jβ gene usage (left to right) for all four age groups generated by TCRdist. Encoding clone size indicated by symbol size. b, TCRdiv diversity measures of the TCRα, TCRβ or paired TCR αβ-chains. c, smoothed density profiles of neighbor distance distribution are shown for each age group. A lower distribution peak indicates more clustered A2/M158+CD8+ single TCRα, TCRβ or paired TCRαβ repertoire, average distance values for each age group are depicted within the plot. PDF, probability density function. d, TRAV and TRBV clonotype pairing per age group illustrated by circos plots. Left arch segment colors indicate TRAV usage, right outer arch colors depict TRBV usage. Connecting lines indicated TRAVTRBV gene pairing and are colored based on their TRAV usage and segmented based on their CRD3α and CDR3β sequence, the thickness is proportional to the number of TCR clones with the respective pair. The number of sequences considered for each circos plot is shown at the right bottom. e, Frequency of high-prevalent (>2 similar TCRs within a single individual) public (shared) and private (not shared) clonotypes across different age groups. Dark red represents high-prevalent public TCR (TRAV27, TRAJ42, CDR3α GAGGGSQGNLIF, TRBV19, TRBV2–7 and CDR3β CASSIRSSYEQYF), whereas the light red are clonotypes expressing the full public TCRβ chain (TRBV19, TRBV2–7 and CDR3β CASSIRSSYEQYF) but the TCR α-chain could not be identified. Numbers in the graph represent the number of donors in which this specific high-prevalent clonotype was identified. Statistical analysis was performed using a two-sided Kruskal–Wallis test with Dunn’s correction for multiple tests. P values are indicated above the graphs. N, newborn; C, children; A, adult; OA, older adult. Source data
Fig. 5
Fig. 5. Age-related changes within the A2/M158+CD8+ CDR3αβ-motifs.
a, The top-scoring A2/M158+CD8+ CDR3α (left TCR logo) and CDR3β (right TCR logo) sequence motifs for each age group. Each logo depicts the V (left side) and J (right side) gene frequencies with the CDR3 amino acid sequence in the middle with the full height (top) and scaled (bottom) by per-residue reparative entropy to background frequencies derived from TCRs with matching gene-segment composition to highlight motif positions under selection. The middle section indicates the inferred rearrangement structure by source region (light gray for V-region, dark gray for J, black for D and red for N insertions) of the grouped receptors. b, Persistence of TCRα clonotypes expressing selected prominent CDR3α motifs across different age groups. Colors identify the most prominent CDR3α motifs. Shared clonotypes are connected by colored lines. c, Frequency of the most prominent CDR3α motifs GGGSQG, GGG and GG across the different age groups. d, Persistence of TCRβ clonotypes expressing selected prominent CDR3β motifs across different age groups. Colors identify the most prominent CDR3β motifs. Shared clonotypes are connected by colored lines. e, Frequency of the most prominent CDR3β motifs IV, RS, IG, YGY, IY and IF across the different age groups. Bars indicate the median, dots represent individual donors, with n = 6 newborns, n = 12 children, n = 8 adults and n = 10 older adults (c,f). Statistical analysis was performed using a two-sided Kruskal–Wallis test with Dunn’s correction for multiple tests. P values are indicated above the graphs. N, newborn; C, children; A, adult; OA, older adult. Source data
Fig. 6
Fig. 6. Age-related changes in probability of generation of A2/M158+CD8+ TCRs.
a, Frequency of A2/M158+CD8+ TCRβ motifs in bulk repertoires of HLA-A*2-expressing and negative donors and b, across decades of human life for HLA-A*2+ donors. Each dot is the cumulative frequency of TCRβ chains from A2/M158+CD8+ T cells in bulk TCRβ repertoires. Dots represent individual donors, HLA-A*2+ age group 0–9, n = 6; 10–19, n = 14; 20–39, n = 157; 40–59, n = 111; 60–79, n = 24; 80–103, n = 17 and HLA-A*2 age group age group 0–9, n = 22; 10–19, n = 24; 20–39, n = 189; 40–59, n = 150; 60–79, n = 29; 80–103, n = 9. c,d, Probabilities of generation (Pgen; log10 transformed) for all single TCRα (c) and TCRβ (d) chains proteins from newborns, children, adults and older adults estimated with TCRdist. e,f, Number of nucleotide insertions (e) and deletions (f) for all single TCRβ chains. g, Pgen (log10 transformed) for TCR β-chain proteins that include TRBV19 (left) or other V (right) gene segments in newborns, children, adults and older adults generated with TCRdist. Box plots represent the median (middle bar), 75% quartile (upper hinge) and 25% quartile (lower hinge) with whiskers extending 1.5 × interquartile range, dots represent individual clonotypes derived from n = 6 newborns, n = 12 children, n = 8 adults and n = 10 older adults, with clone size indicated by symbol size. Statistical analysis of Pgen and for the number of insertions and deletions between age groups utilized a two-sided mixed-effects model with donor encoded as a random effect, as described in Methods. P values were adjusted (Padj) for multiple testing with the Benjamini–Hochberg false discovery rate (FDR) method. N, newborn; C, children; A, adult; OA, older adult. Source data
Fig. 7
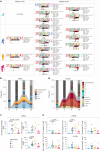
Fig. 7. Proliferation and polyfunctionality of A2/M158+CD8+ T cells across human life.
a,b, Total numbers (a) and fold increase (b) of A2/M158-tetramer+CD8+ T cells from day 0 (ex vivo tetramer enrichment, due to low frequency), day 3, 4, 5, 6, 7 and 10 following in vitro M158–66 peptide stimulation of newborn, child, adult and older adult peripheral blood mononuclear cells (PBMCs) (no previous enrichment). c, Representative FACS plots indicating the gating strategy used to characterize dividing (red) and undivided (blue) A2/M158+CD8+ T cells by the loss of cell trace violet over a 10-d expansion of representative donors. Gray dots represent total CD8+ T cells. d, Persistence of TCRα clonotypes expressing selected prominent CDR3α motifs across a 10-d expansion in each age group. Shared TCRα clonotypes are connected by colored lines. e, Persistence of TCRβ clonotypes expressing selected prominent CDR3β motifs across a 10-d expansion in each age group. Colors identify the most prominent CDR3β motifs identified ex vivo (Fig. 5) (d,e). Shared TCRβ clonotypes are connected by colored lines. f, Representative FACS plots indicating the gating strategy used to characterize proliferating (red) and non-proliferating (blue) A2/M158+CD8+ T cells by the loss of cell trace violet expressing IFN-γ, TNF, GrzB and perforin following M158–66 peptide re-stimulation on day 9. g, Pie charts representing average fractions of divided and undivided A2/M158+CD8+ T cells, the number of coexpressed molecules IFN-γ, TNF, GrzB and perforin (slices) and specific combination (arcs). Statistical analysis was performed using a two-sided Tukey’s multiple comparisons test. Exact significant P values are indicated in similar colors as the representative slice. N, newborn; C, children; A, adult; OA, older adult. Source data
Fig. 8
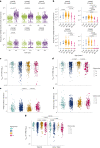
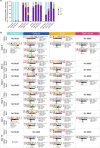
Fig. 8. SKW-3-CD3+ and SKW-CD3+CD8+ cell lines expressing age-specific TCRs.
a, Selection of A2/M158+CD8+ TCR specifically identified in certain age groups. p, proliferation; aa, amino acid. b,c, Representative A2/M158 tetramer-PE staining of SKW-3-CD3+ (b) and SKW-3-CD3+CD8+ (c) TCR-expressing cell lines. d, Median MFI A2/M158 tetramer-PE of SKW-3-CD3+ (open bars) and SKW-3-CD3+CD8+ TCR-expressing cell lines (closed bars) (n = 5 independent experiments, median and interquartile range (IQR)); dotted line indicates MFI threshold set by the parental cell line expressing no TCR. MFI, median fluorescence intensity. e,f, Representative staining (e) and median MFI (f) of A2/M158 tetramer-PE staining with a normal CD8-binding site (A2/M158-WT, lightly shaded), knockout CD8-binding site (A2/M158-KO open) and enhanced CD8-binding site (A2/M158-Enh, closed) tetramer of SKW-3-CD3+CD8+ TCR-expressing cell lines (n = 2 independent experiments); dotted line indicates MFI threshold set by the parental cell line expressing no TCR. g, Representative CD69-PECy7 expression following peptide titration for public and age group specific TCRs expressed in SKW-3-CD3+ cell lines. h, Percentage of maximum CD69-PECy7 MFI for age-specific TCRs expressed on SKW-3-CD3+ (open circles) and SKW-3-CD3+CD8+ (closed circles) cell lines following peptide titration; EC50 indicated by the dotted line (n = 3 independent experiments, median and range). i, Representative CD69-PECy7 expression profiles of SKW-3-CD3+ TCR-expressing cell lines following stimulation with the M158–66 peptide with single alanine substitutions, except for binding site (p2). j, Percentage of maximum CD69-PECy7 MFI following stimulation with M158–66 alanine scan peptides for age-specific TCRs expressed on SKW-3-CD3+ cells (n = 3 independent experiments, median and range). Statistical analysis was performed using a two-sided Kruskal–Wallis with Dunn’s correction for multiple tests between the public TCR and the age-specific TCRs within the same cell line (d,j, black) or between the same TCRs across two cell lines (d, blue). P values are indicated above the graphs. Source data
Extended Data Fig. 1
Extended Data Fig. 1. Age-related changes in A2/M158+CD8+ T cell frequencies and phenotypes.
a, Representative FACS panels indicate the gating strategy used to characterize the total CD8+ T cell and the A2/M158+CD8+ T cell populations. The second line indicates unenriched, enriched and flowthrough fractions of the TAME assay. The unenriched fraction was used to define the frequency and phenotype of the total CD8+ T cell population (gray gate and cell populations), whereas the A2/M158 tetramer-positive CD8+ T cells of the enriched fraction were used to define the frequency and phenotype of the total A2/M158+CD8+ T cell population (red gate and cell populations). Naïve/memory T cell subsets were identified as Tcm (CD27+CD45RA) cells, Tem (CD27CD45RA), Temra (CD27CD45RA+), Tnaïve (CD27+CD45RA+CD95) and Tscm (CD27+CD45RA+CD95+) cells. Boolean gating was used to identify frequencies of individual and combined expression of CD57 and PD-1 and combined expression of CD38, HLA-DR and CD71. b, number of A2/M158+phenotype+CD8+ T cells per 106 CD8+ T cells across all age groups. Co-expression of CD57 and PD-1 in total CD8+ T cells (c) and A2/M158+CD8+ T cells (d-top panel) and number of A2/M158+CD57+CD8+ T cells (d-middle panel) or A2/M158+PD-1+CD8+ T cells (d-bottom panel) per 106 CD8+ T cells across all age groups. Co-expression of CD38 and HLA-DR in total CD8+ T cells (e) and A2/M158+CD8+ T cells (f). Numbers of A2/M158+phenotype+CD8+ T cells per 106 CD8+ T cell data were right shifted by 0.001 (that is absence of A2/M158 events in a specific phenotypic population are displayed as 0.001) (b,d-middle and bottom panel). Only samples with 10 or more total A2/M158+ events were included for phenotype analysis (b-f). Horizontal bars indicate the median, dots represent individual donors, with n = 10 newborns, n = 12 children, n = 20 adults and n = 16 older adults in b, d and f and n = 11 newborns, n = 12 children, n = 20 adults and n = 18 older adults in c and e. Technical replicates were not performed due to limited samples. Statistical analysis was performed using a two-sided Kruskal-Wallis with Dunn’s correction for multiple tests (b, d-middle and bottom panel) or a two-sided Tukey’s multiple comparisons test (c, d-top panel, e, f). Exact significant p-values are indicated above the graphs. N, newborns; C, children; A, adults; OA, older Adults. Source data
Extended Data Fig. 2
Extended Data Fig. 2. CMV-related changes in A2/M158+CD8+ T cell phenotypes.
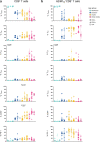
Frequency of naïve, memory, CD57 or PD-1 expressing subsets within the total CD8+ T cell (a) or A2/M158+CD8+ T cell populations (b) across all age groups split based on their CMV status. Horizontal bars indicate the median, dots represent individual donors. Horizontal bars indicate the median, dots represent individual donors, with n = 3 CMV, n = 4 CMV+ and n = 4 CMV unknown newborns, n = 6 CMV, n = 5 CMV+ and n = 1 CMV unknown children, n = 7 CMV, n = 4 CMV+ and n = 9 CMV unknown adults and n = 2 CMV, n = 13 CMV+ and n = 3 CMV unknown older adults in a and n = 3 CMV, n = 4 CMV+ and n = 3 CMV unknown newborns, n = 6 CMV, n = 5 CMV+ and n = 1 CMV unknown children, n = 7 CMV, n = 4 CMV+ and n = 9 CMV unknown adults and n = 1 CMV-, n = 12 CMV+ and n = 3 CMV unknown older adults in b. Statistical analysis was performed between donors with a known positive or negative CMV status within each age group using a two-sided Mann-Whitney U-test. Exact significant p-values are indicated above the graphs. Source data
Extended Data Fig. 3
Extended Data Fig. 3. Molecular and phenotypic differentiation within A2/M158+CD8+ T cells across human lifespan.
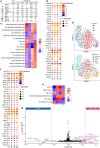
a, Specification selected donors for single-cell multi-omic analysis. Phenotype frequencies were obtained via flow cytometry protein expression data. b, Dot plot of selected transcription factors grouped by UMAP clusters. Dot size represents the proportion with non-zero expression from each age group. The color represents average mean expression. c, Heatmap of enriched pathways identified from GSEA using differentially expressed genes between each UMAP cluster. All pathways shown have Benjamini–Hochberg adjusted p-values < 0.05 in at least one cluster. NES: Normalized enrichment score. d, Dimensionality reduction (UMAP) and clustering of scRNAseq data excluding TCR genes colored by clusters (top), age groups (bottom). e, Heatmap of enriched pathways identified from GSEA using differentially expressed genes between each age group. All pathways shown have Benjamini–Hochberg adjusted p-values < 0.05 in at least one age group. NES: Normalized enrichment score. f, Dot plot of selected transcription factors grouped by age group. Dot size represents the proportion with non-zero expression from each age group (N, newborns; C, children; A, adults; OA, older Adults). The color represents average mean expression. g, Volcano plot of a pairwise comparison without correction for multiple testing of differentially expressed genes between children (blue) and older adults (pink) with a fold change |log2(FC)| >0.3 and p-value < 0.05.
Extended Data Fig. 4
Extended Data Fig. 4. Age-related changes in A2/M158+CD8+ TCRαβ repertoire.
a, Z-score for intra- versus inter-donor distance, larger Z means intra-donor distances are smaller than inter-donor distances, that is greater heterogenticity across donors. b, TRAV and TRBV clonotype pairing for individual donors within each age group illustrated by circos plots. Left arch segment colors indicate TRAV usage, right outer arch colors depict TRBV usage. Connecting lines indicated TRAV-TRBV gene pairing and are colored based on their TRAV usage and segmented based on their CRD3α and CDR3β sequence, the thickness is proportional to the number of TCR clones with the respective pair. The number of sequences considered for each circos plot is shown at the right bottom. c, Frequency of high (TCRs detected ≥2 within a single individual) and low (TCRs detected once with a single individual) prevalent public (shared) clonotypes across individuals of age groups. Dark red represents high prevalent public TCR (TRAV27, TRAJ42, CDR3α GAGGGSQGNLIF, TRBV19, TRBV2-7, CDR3β CASSIRSSYEQYF), whereas the light red are clonotypes expressing the full public TCRβ chain (TRBV19, TRBV2-7, CDR3β CASSIRSSYEQYF) but TCRα chain could not be identified. Numbers in the squares represent the number of donors in which the specific high versus low prevalent clonotype was identified. d, Frequency of high prevalent (TCRs detected ≥2 within a single individual) private (not shared) clonotypes across individuals of age groups. Statistical analysis was performed using a two-sided Kruskal-Wallis with Dunn’s correction for multiple tests. Exact significant p-values are indicated above the graphs. Source data
Extended Data Fig. 5
Extended Data Fig. 5. Age-related changes in A2/M158+CD8+ CDR3αβ repertoire and probability of generation.
Distribution of CDR3α (a) and CDRβ (b) amino acid lengths, calculated using the Chothia nomenclature, across all age groups. Average-linkage dendrograms of TCR clustering for the TCRα (c) and TCRβ (d) A2/M158+CD8+ repertoires generated by TCRdist. Each clustering was generated using a fixed-distance threshold algorithm and colored by generation probability (red, highest; blue, lowest probability of ease of TCR recombination). The probability is relative between TCRs across different age groups. TCRlogos for selected subsets (corresponding to the branches of the dendrogram enclosed in dashed boxes) are shown, labeled by cluster size both to the left of each logo and to the right of the corresponding branches. Each TCR logo depicts the V- and J-gene frequencies, the CDR3 amino acid sequence, and the inferred rearrangement structure of the grouped receptors (colored by source region, light gray for the V-region, dark gray for J, black for D, and red for N-insertions). Source data
Extended Data Fig. 6
Extended Data Fig. 6. Divided and undivided A2/M158+CD8+ TCRαβ repertoires across age groups.
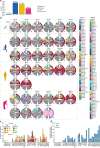
TRAV and TRBV clonotype pairing for pooled donors within each age group, newborns (a), children (b), adults (c) and older adults (d), illustrated by circos plots for fast, slow, undivided and total A2/M158+CD8+ T cells. Left arch segment color indicates TRAV usage, right outer arch color depicts TRBV usage. Connecting lines indicate TRAV-TRBV gene pairing and are colored based on their TRAV usage and segmented based on their CRD3α and CDR3β sequence. The thickness is proportional to the number of TCR clones with the respective pair. The number of sequences considered for each circos plot is shown at the right bottom. Source data
Extended Data Fig. 7
Extended Data Fig. 7. Age-related changes to A2/M158+CD8+ CDR3αβ-motifs.
a, Phenotypic distribution of individual donors at the start of the proliferation assay (day 0). b, The top-scoring A2/M158+CD8+ CDR3α (top TCR logo) and CDR3β (bottom TCR logo) sequence motifs for each age group on day 0, 3, 5, 6, 7 and 10 following M15866 peptide stimulation. Each logo depicts the V- (left side) and J- (right side) gene frequencies with the CDR3 amino acid sequence in the middle with the full height (top) and scaled (bottom) by per-residue reparative entropy to background frequencies derived from TCRs with matching gene-segment composition to highlight motif positions under selection. The middle section indicates the inferred rearrangement structure by source region (light gray for V-region, dark gray for J, black for D and red for N-insertions) of the grouped receptors. Source data
Extended Data Fig. 8
Extended Data Fig. 8. Transient and stable expression of age-specific TCR.
a, Gating strategy transient transfection age-specific TCRs in HEK293T cells. b, Median MFI A2/M158 tetramer-PE staining of transiently expressed TCRs in HEK293T cells, dotted line indicates MFI threshold set by the parental cell line expressing no TCR (n = 3 independent experiments, median and IQR). c, Gating strategy and A2/M158 tetramer-PE staining with a normal (A2/M158-WT, lightly shaded), knockout CD8-binding site (A2/M158-KO open) and enhanced CD8-binding site (A2/M158-Enh, closed) tetramer of SKW-3-CD3+ and SKW-3-CD3+CD8+ TCR-expressing cell lines. d, Median MFI of A2/M158 tetramer-PE staining with a normal (A2/M158-WT, lightly shaded), knockout CD8-binding site (A2/M158-KO open) and enhanced CD8-binding site (A2/M158-Enh, closed) tetramer of SKW-3-CD3+ TCR-expressing cell lines (n = 2 independent experiments), dotted line indicates MFI threshold set by the parental cell line expressing no TCR. e, Gating strategy and CD69-PECy7 expression following peptide titration for public and age group specific TCRs (SKW-3-CD3+ cells). f, Percentage of maximum CD69-PECy7 MFI for age-specific TCRs expressed on SKW-3-CD3+ (open circles) and SKW-3-CD3+CD8+ (closed circles) cell lines following peptide titration, EC50 indicated by the dotted line (n = 3 independent experiments, median and range). Statistical analysis was performed using a two-sided Kruskal-Wallis with Dunn’s correction for multiple tests between the public and the age-specific TCRs (b) and a one-tailed Mann-Whitney U-test was performed for the EC50 between SKW-3-CD3+CD8- SKW-3-CD3+CD8+ TCR-expressing cell lines (f). Exact significant p-values are indicated above the graphs. Source data
Extended Data Fig. 9
Extended Data Fig. 9. TCR recognition patterns of age-specific TCRs.
a, Gating strategy and CD69-PECy7 expression profiles of SKW-3-CD3+CD8+ TCR-expressing cell lines following stimulation with the single alanine mutant M158-66 peptides. (b) Frequency of maximum CD69-PECy7 MFI following stimulation with M158-66 alanine scan peptides for age-specific TCRs expressed on SKW-3-CD3+CD8+ cells (n = 3 independent experiments, median and range). Statistical analysis was performed using a two-sided Kruskal-Wallis with Dunn’s correction for multiple tests between the public and the age-specific TCRs (b). Exact significant p-values are indicated above the graphs. Source data

References

    1. Sridhar S, et al. Cellular immune correlates of protection against symptomatic pandemic influenza. Nat. Med. 2013;19:1305–1312. doi: 10.1038/nm.3350. - DOI - PubMed
    1. Wang Z, et al. Recovery from severe H7N9 disease is associated with diverse response mechanisms dominated by CD8(+) T cells. Nat. Commun. 2015;6:6833. doi: 10.1038/ncomms7833. - DOI - PMC - PubMed
    1. Kedzierska K, Thomas PG. Count on us: T cells in SARS-CoV-2 infection and vaccination. Cell Rep. Med. 2022;3:100562. doi: 10.1016/j.xcrm.2022.100562. - DOI - PMC - PubMed
    1. van de Sandt, C.E. et al. Human influenza A virus-specific CD8+ T cell response is long-lived. J. Infect. Dis.10.1093/infdis/jiv018 (2015). - PMC - PubMed
    1. Messaoudi I, Guevara Patino JA, Dyall R, LeMaoult J, Nikolich-Zugich J. Direct link between MHC polymorphism, T cell avidity, and diversity in immune defense. Science. 2002;298:1797–1800. doi: 10.1126/science.1076064. - DOI - PubMed

Substances