. 2023 Nov;24(11):1839-1853.
doi: 10.1038/s41590-023-01627-6. Epub 2023 Sep 25.

APOE4 impairs the microglial response in Alzheimer's disease by inducing TGFβ-mediated checkpoints

Affiliations

APOE4 impairs the microglial response in Alzheimer's disease by inducing TGFβ-mediated checkpoints

Zhuoran Yin et al. Nat Immunol. 2023 Nov.

Abstract

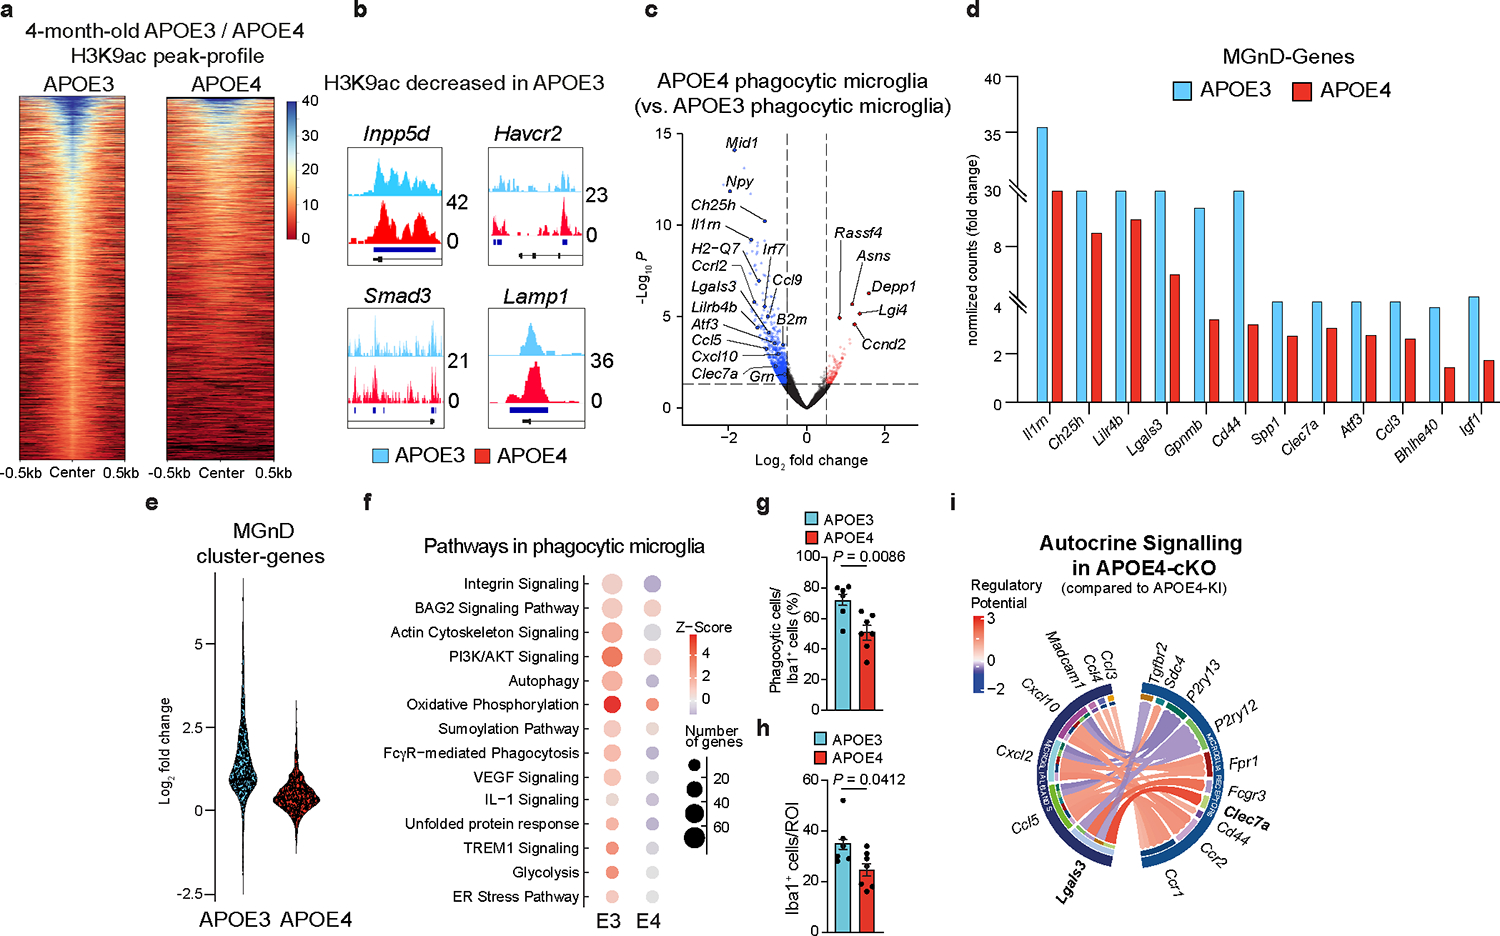
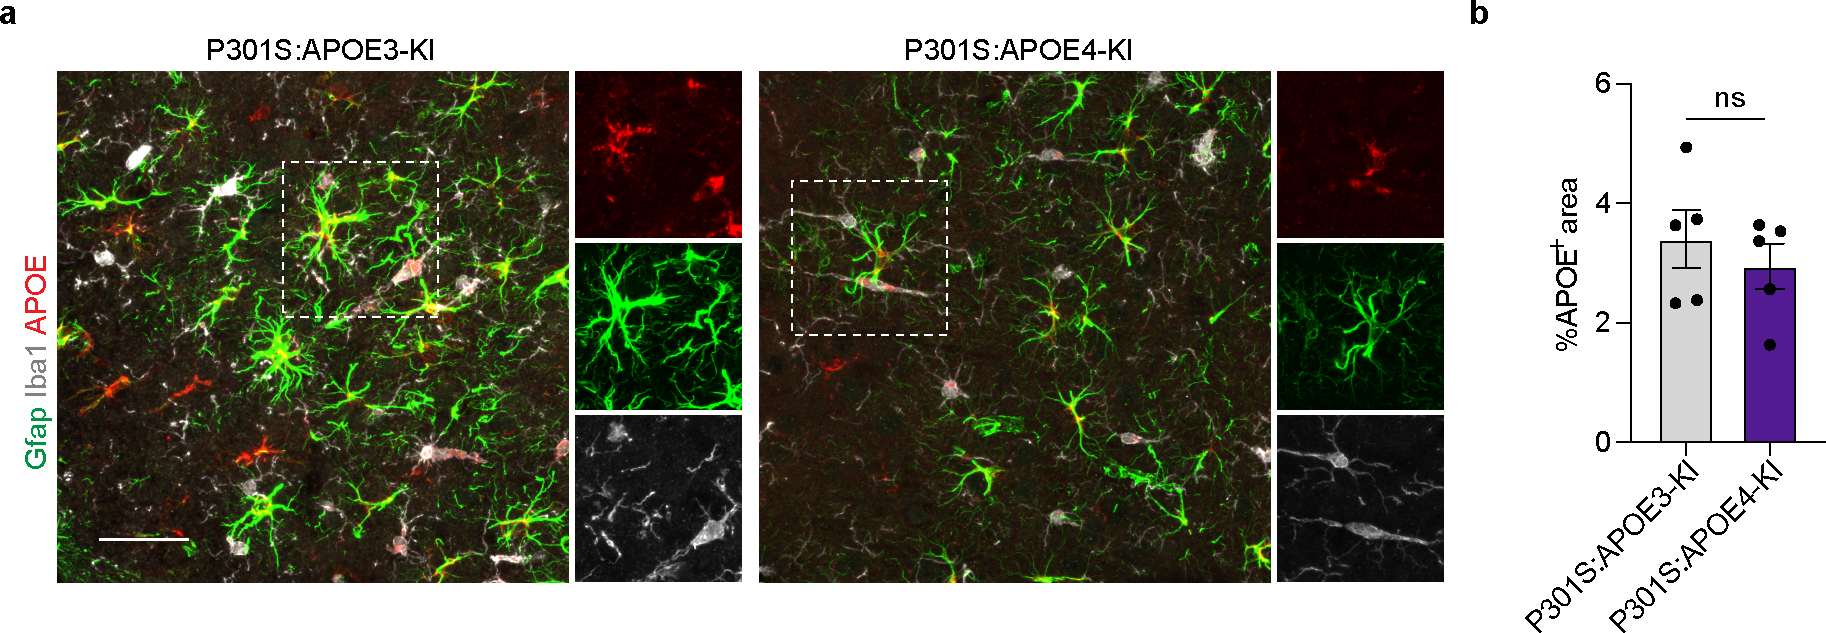
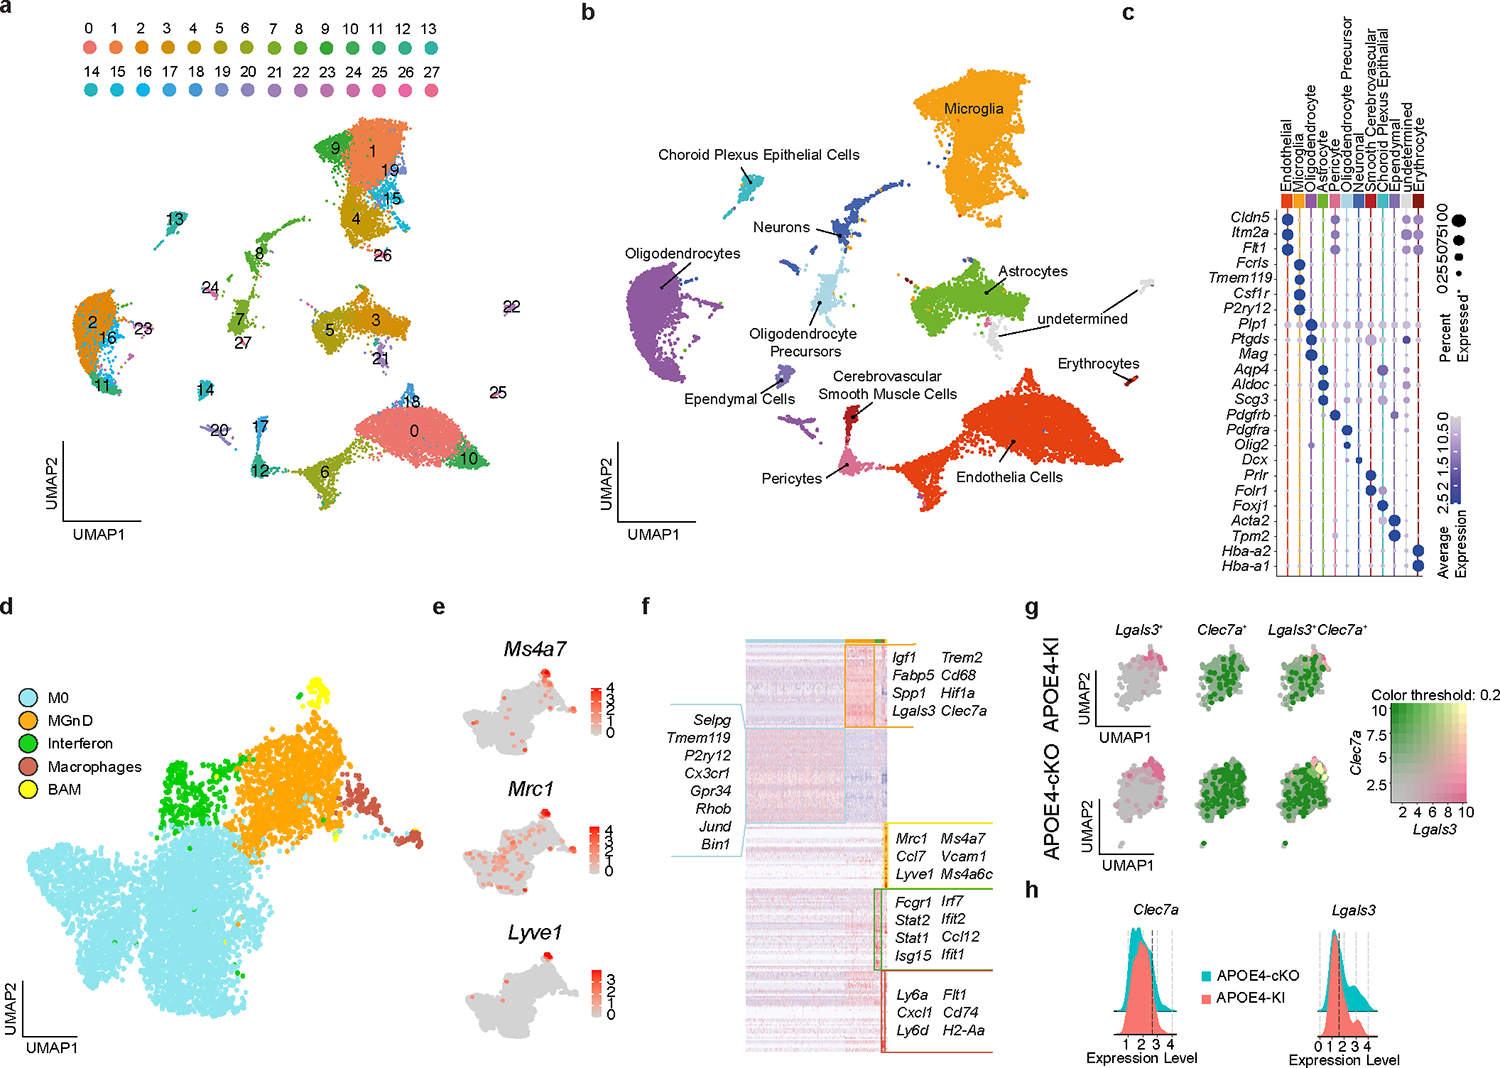
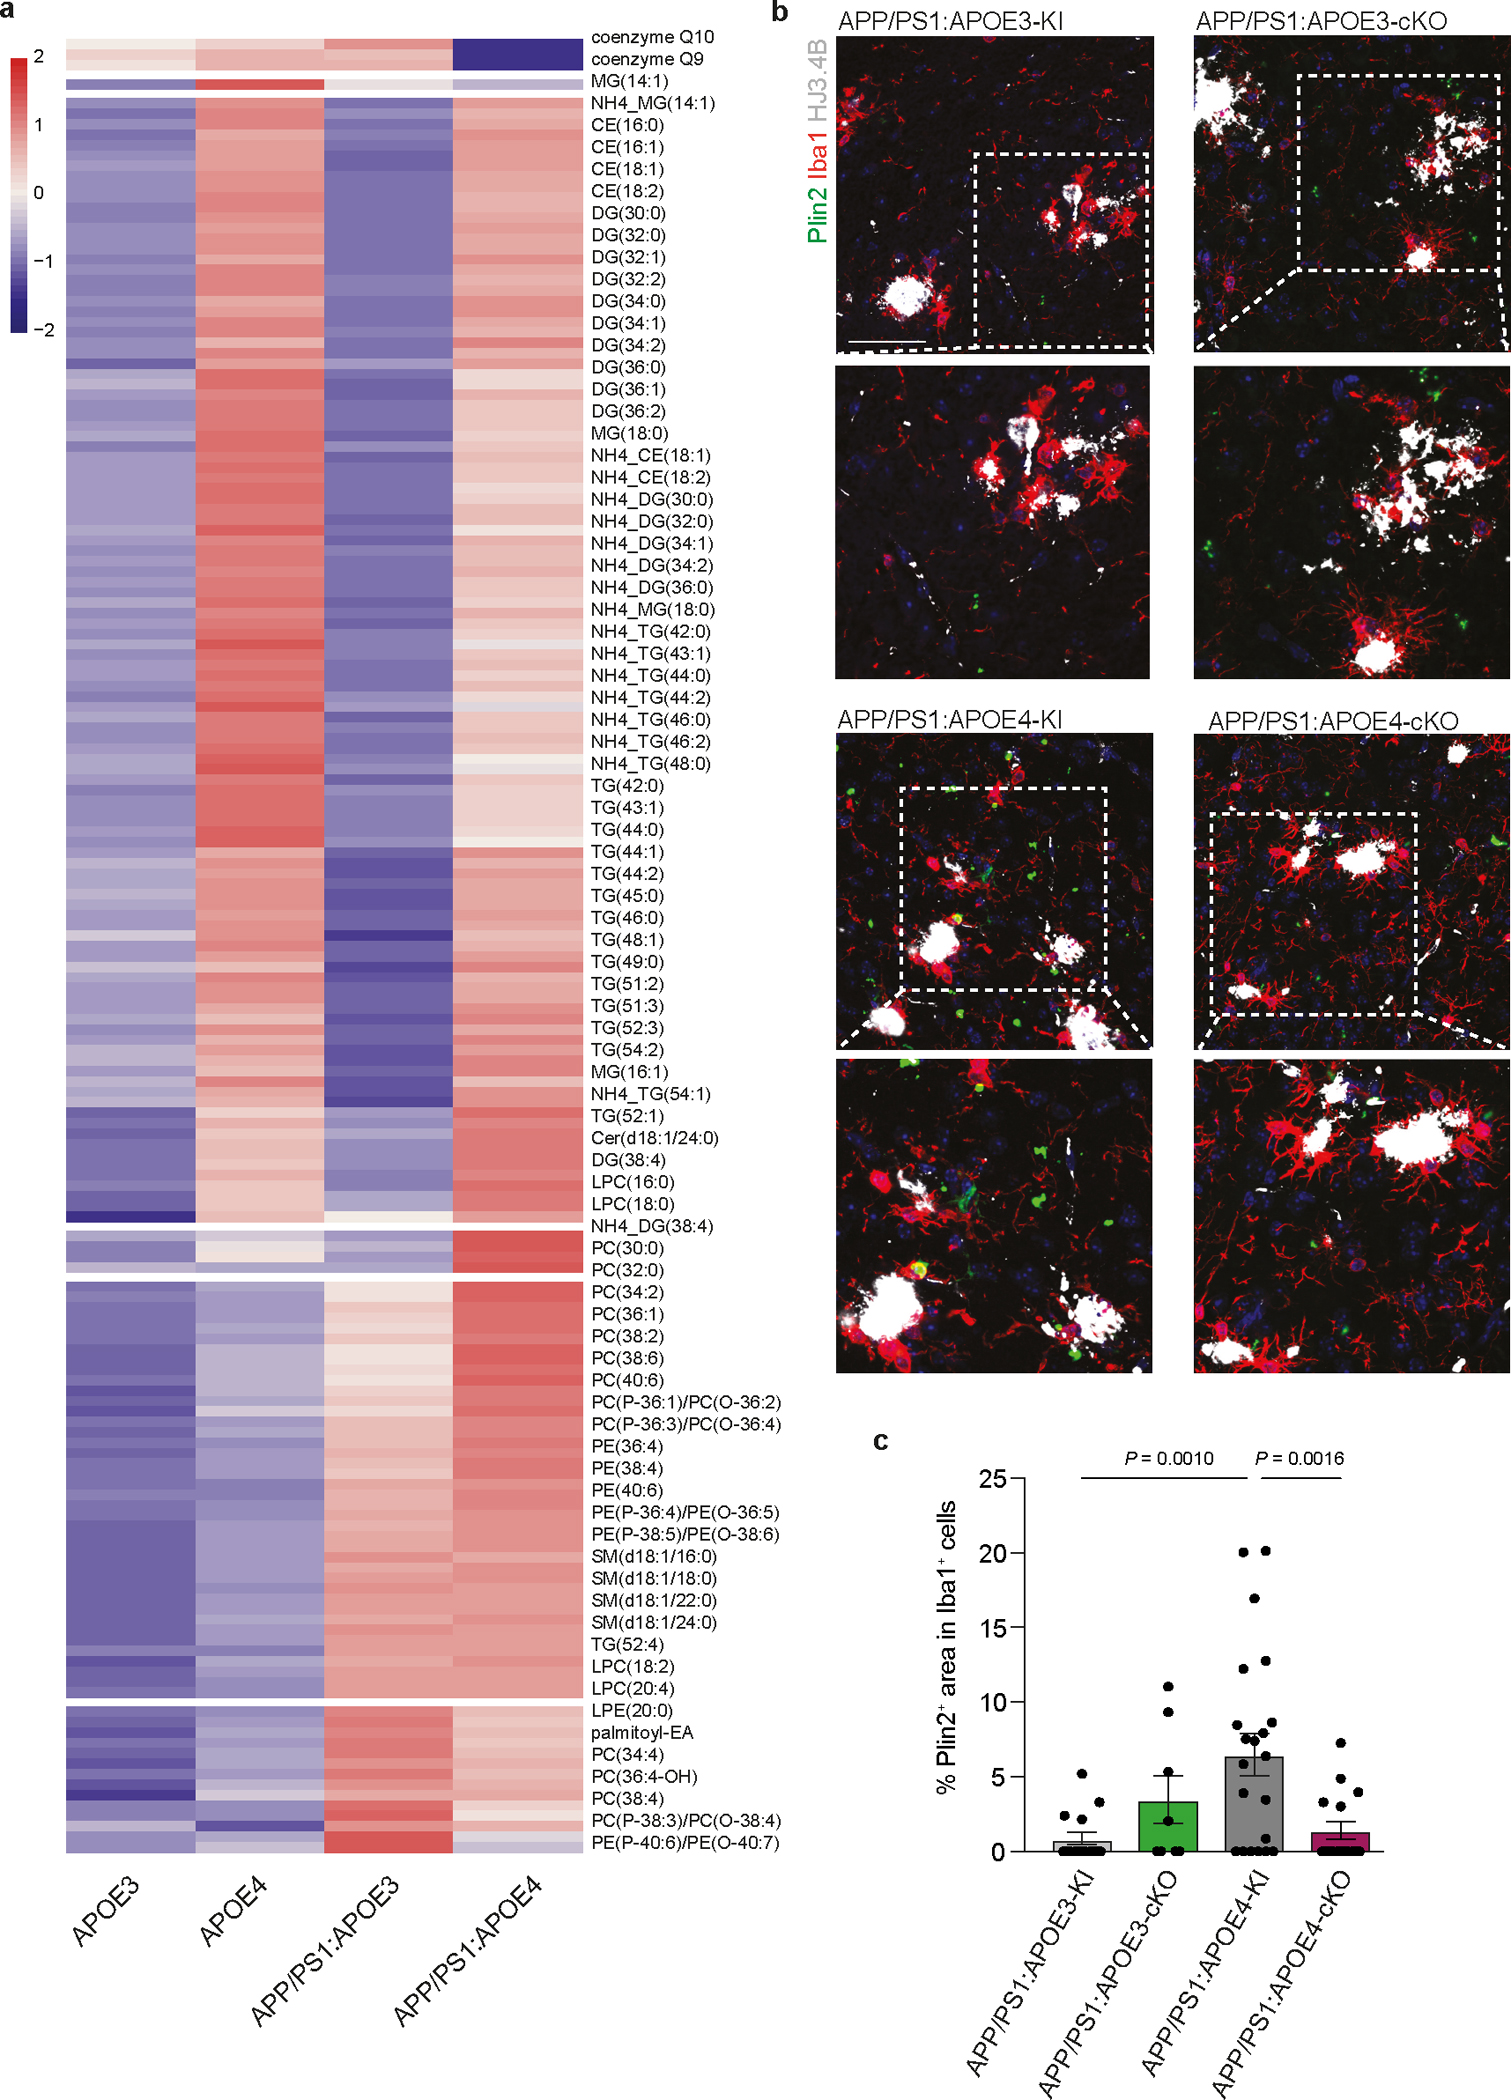
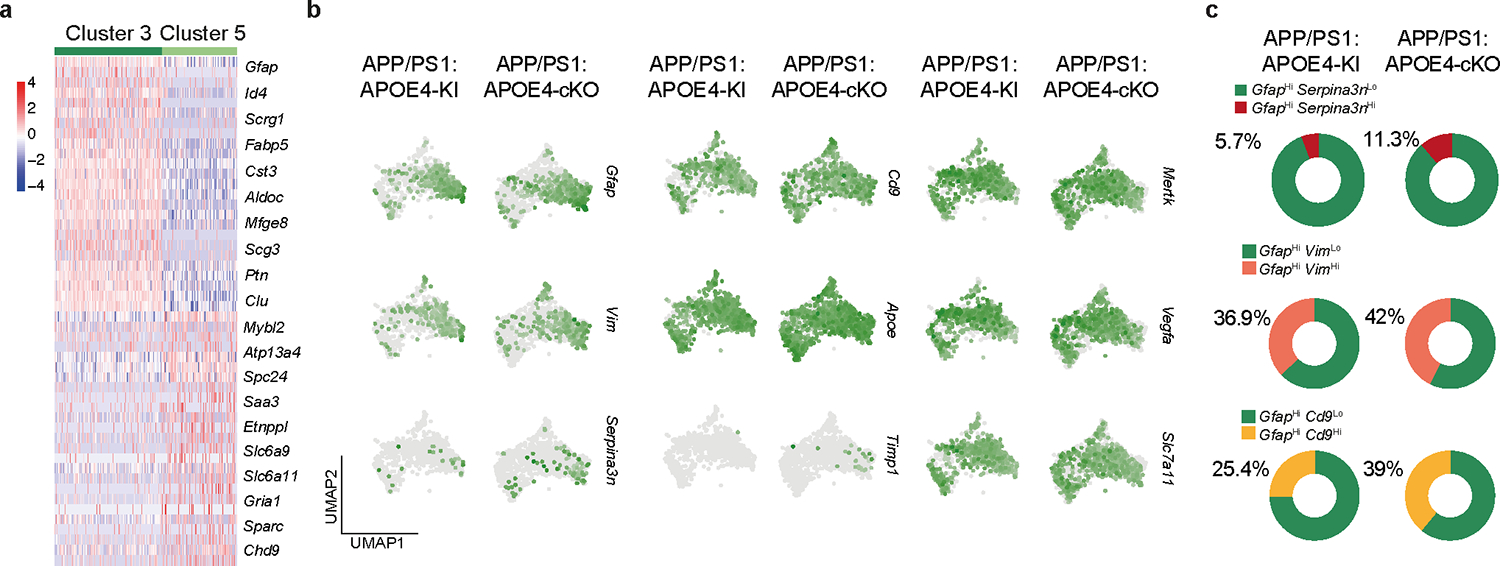
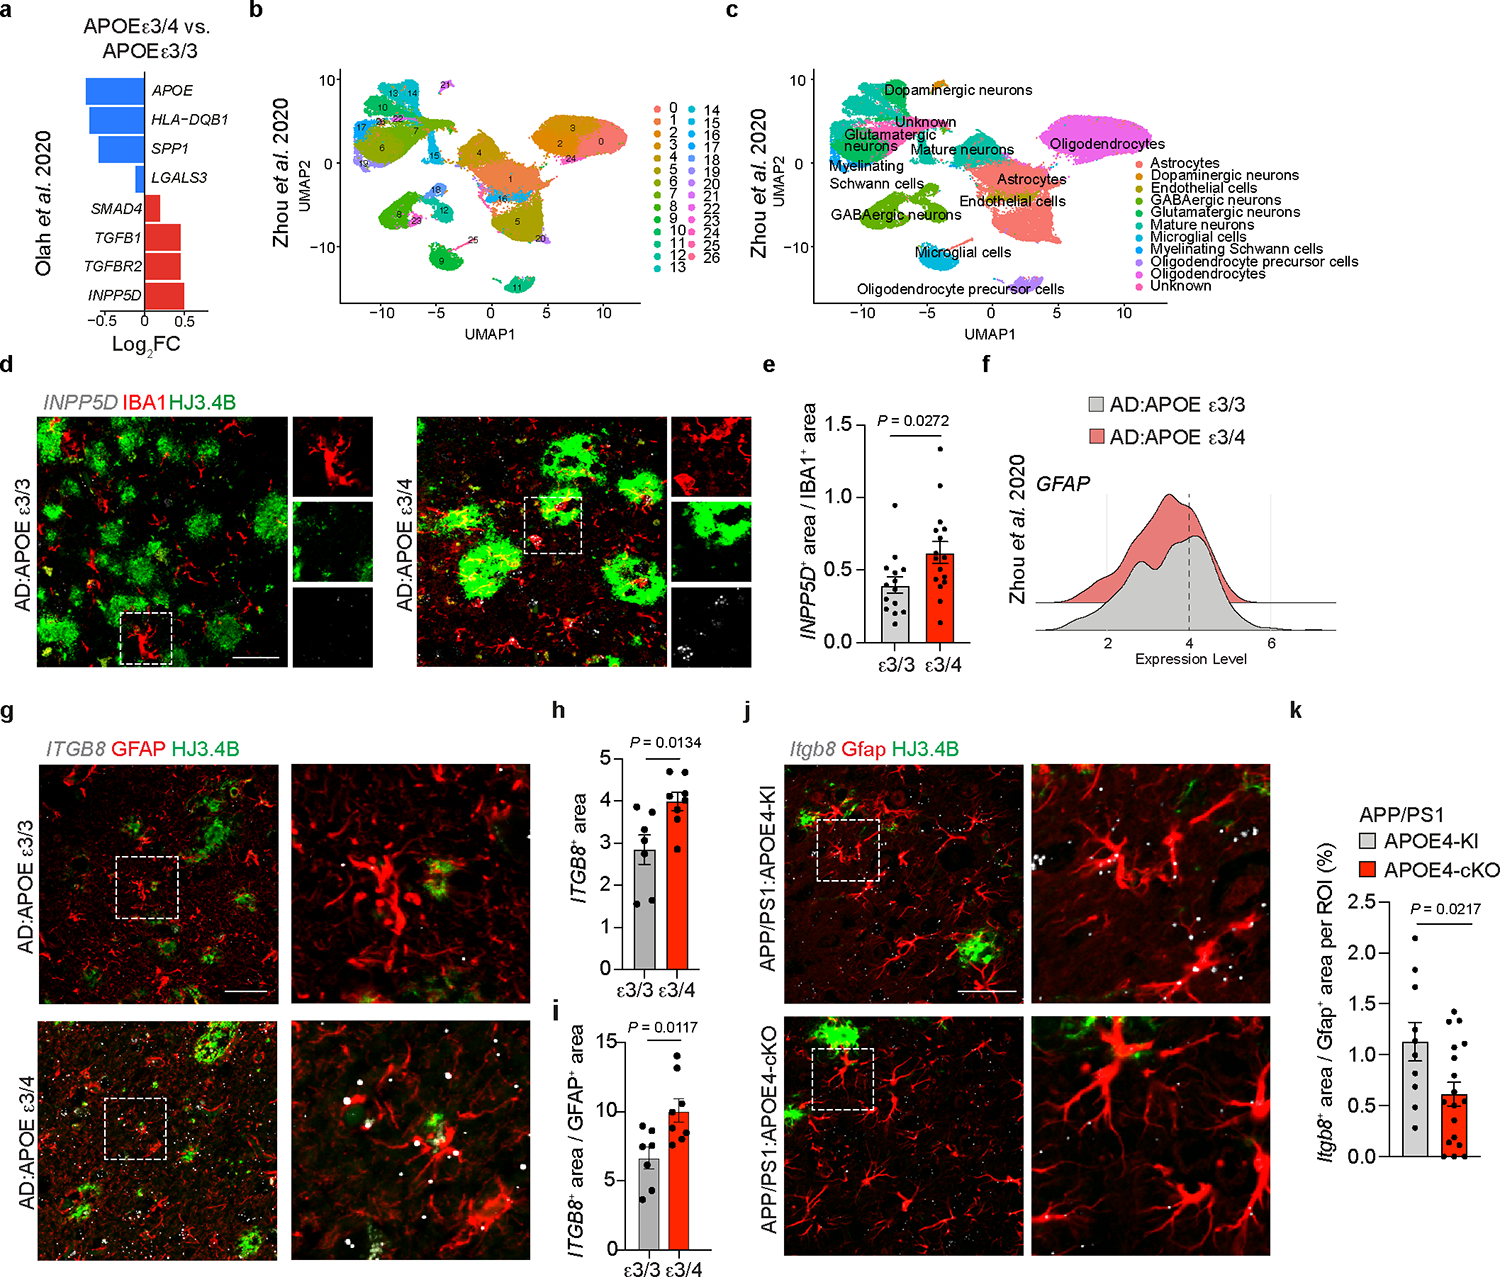
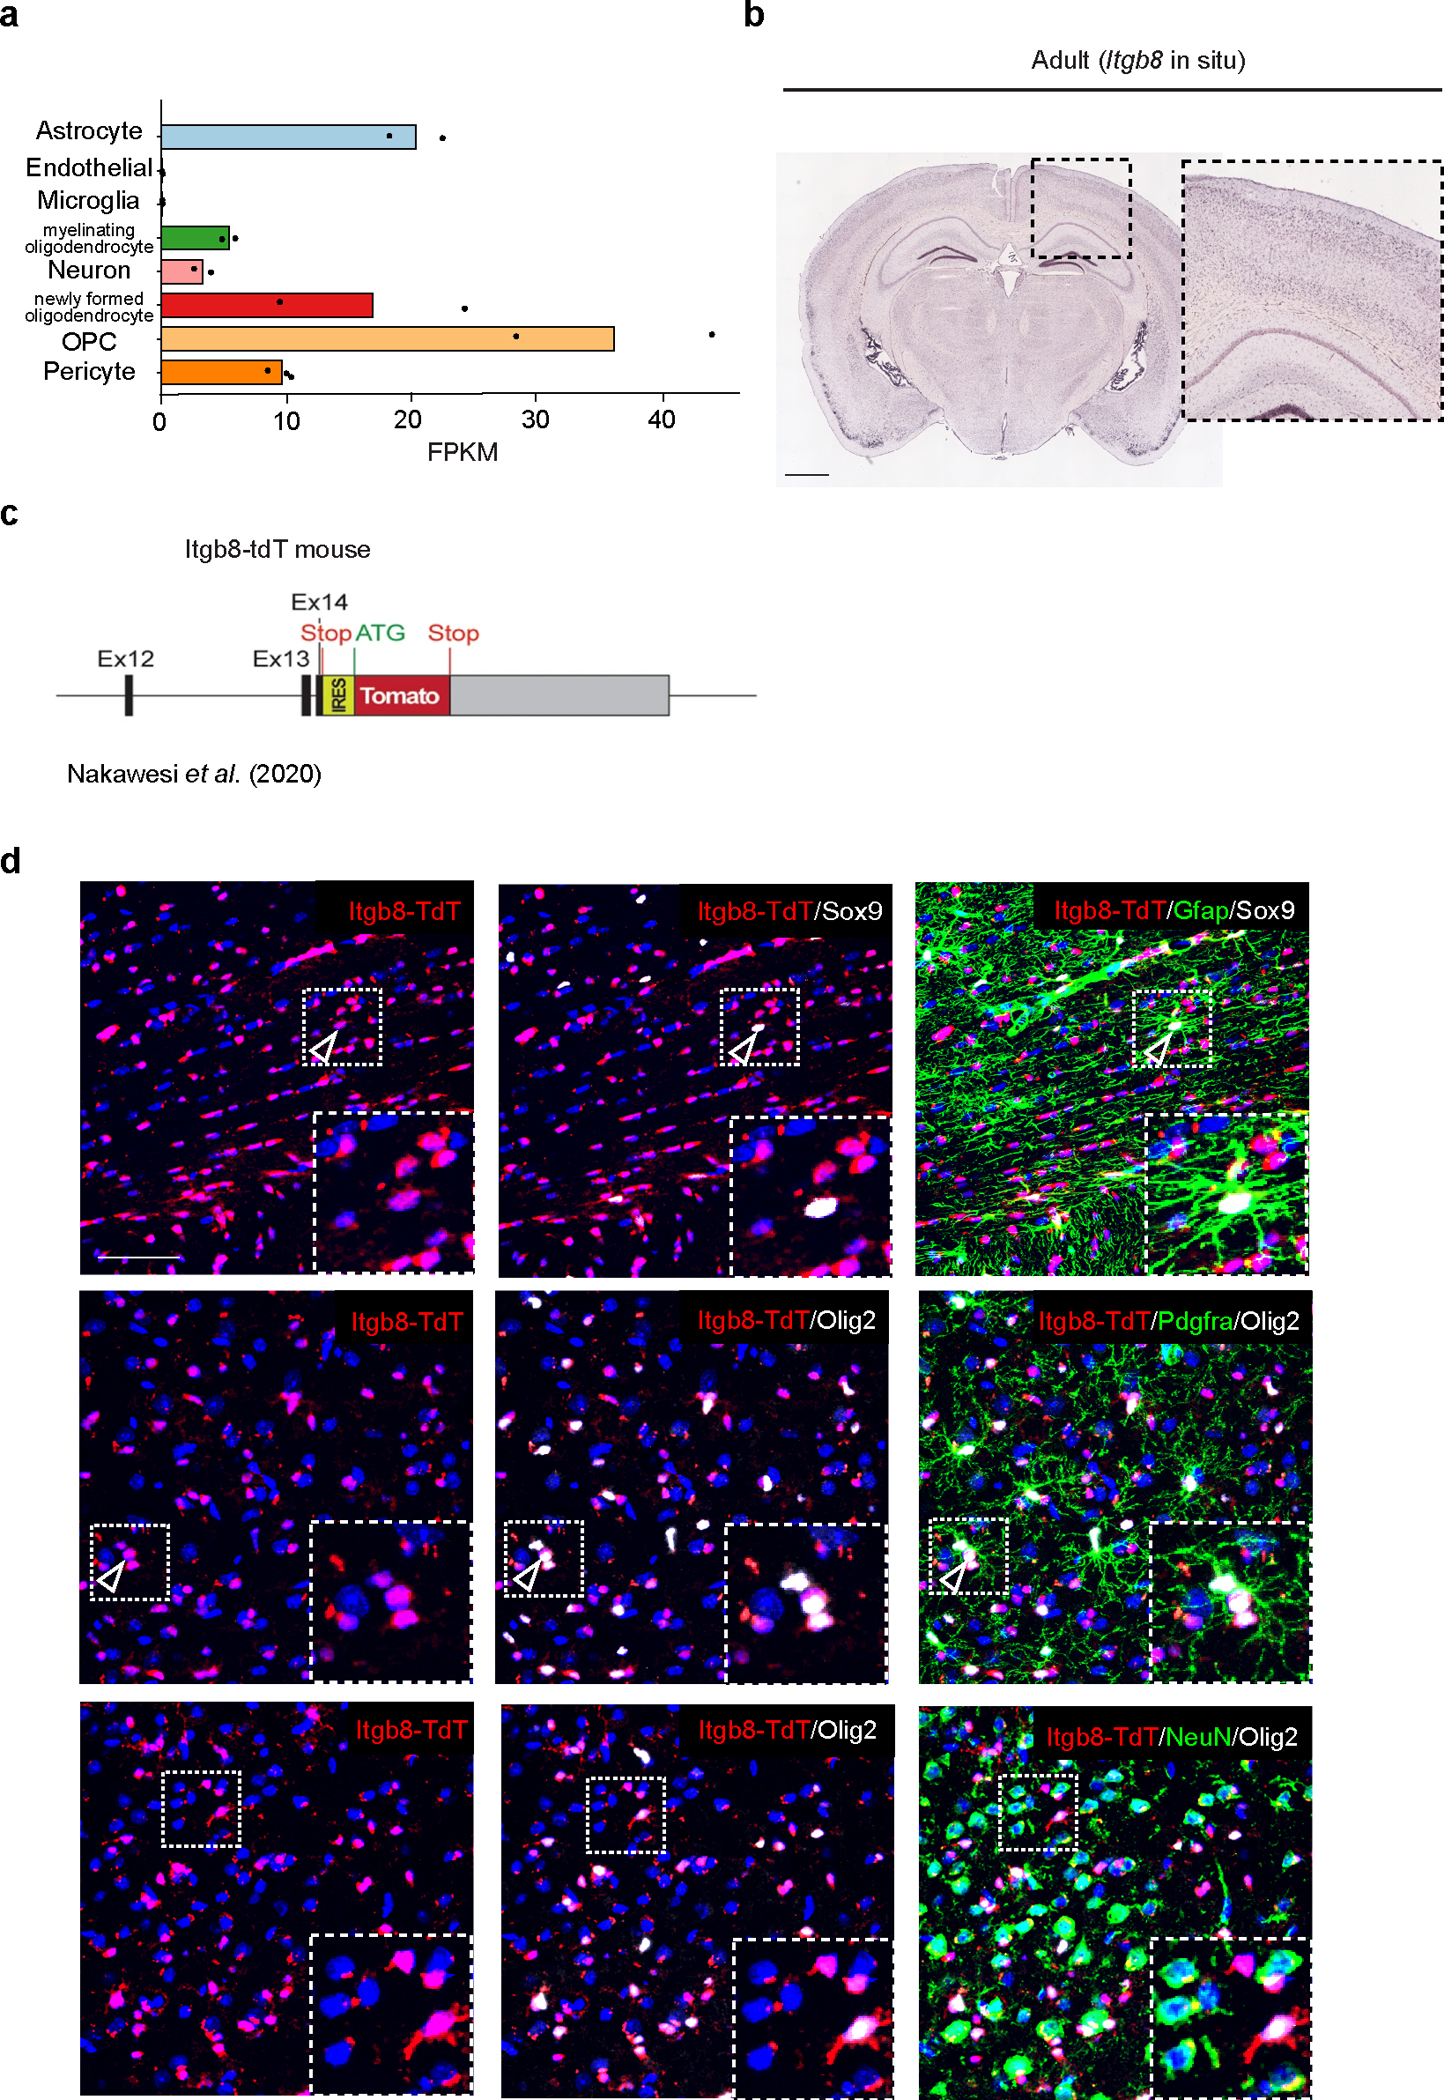
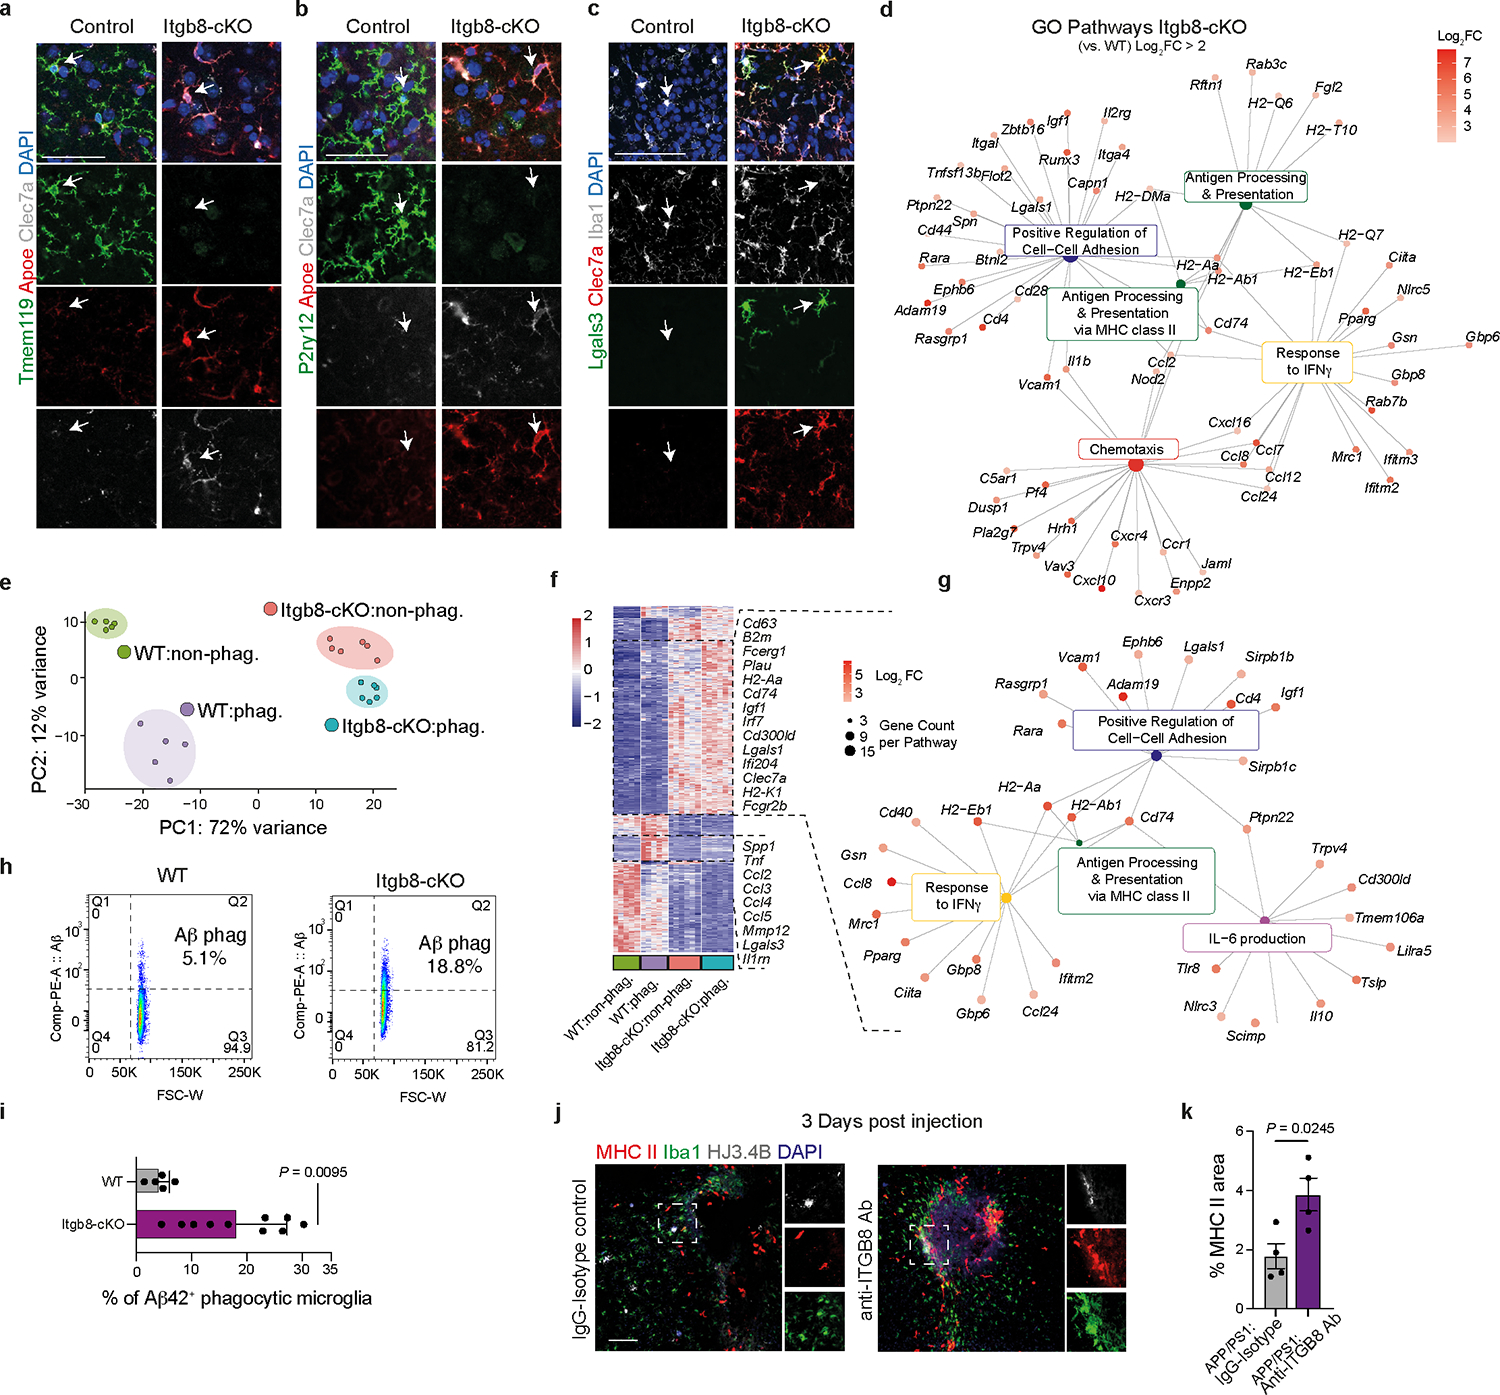
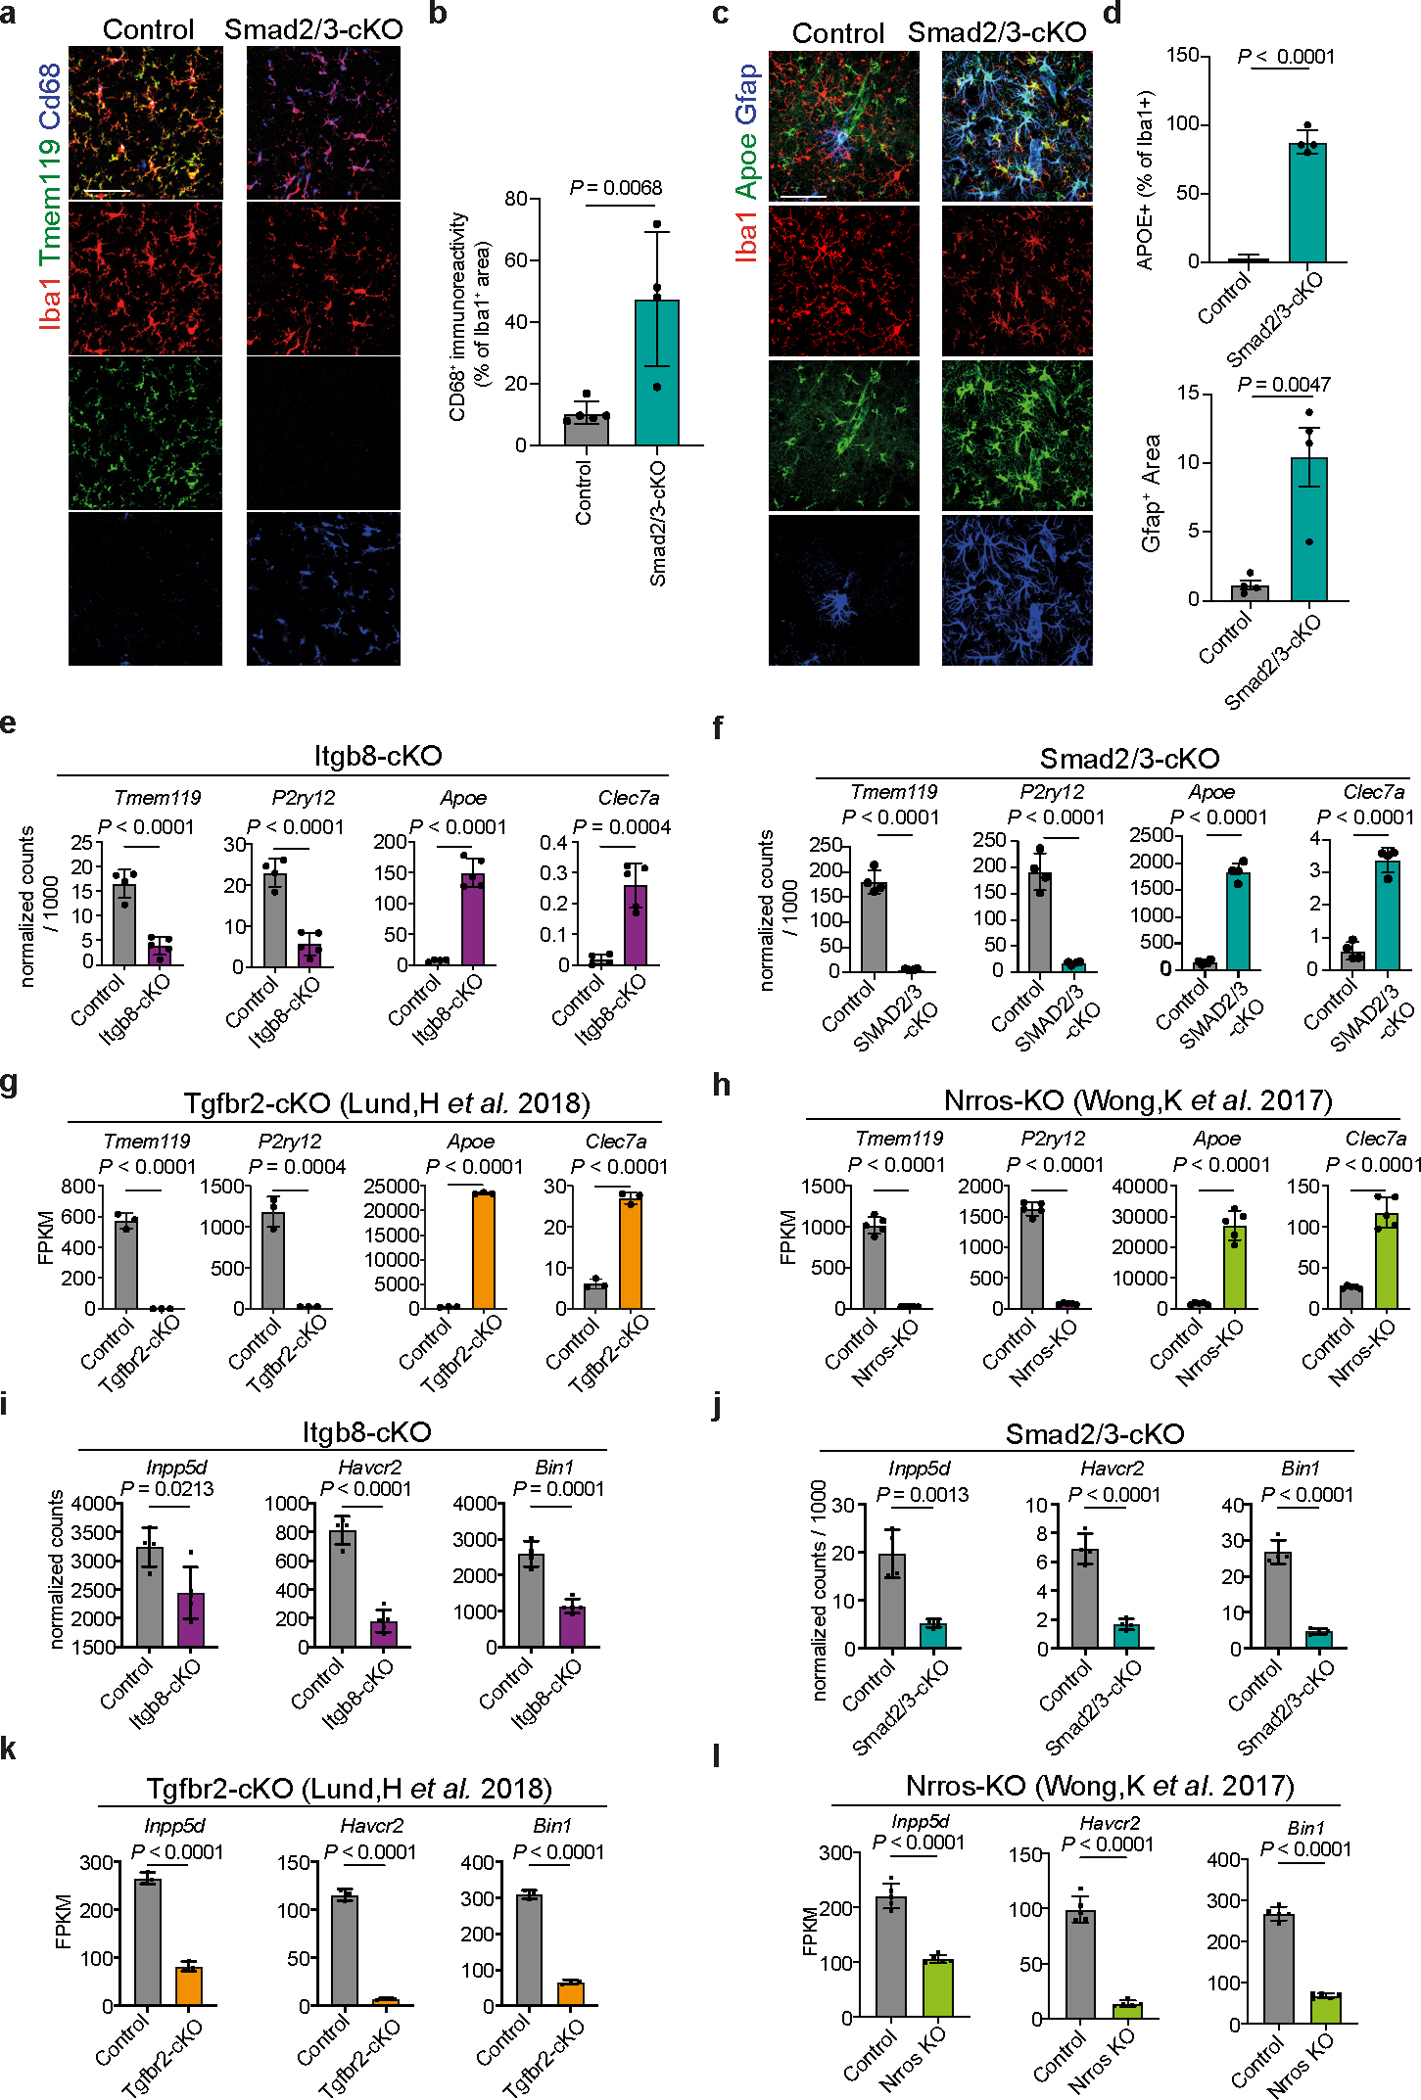
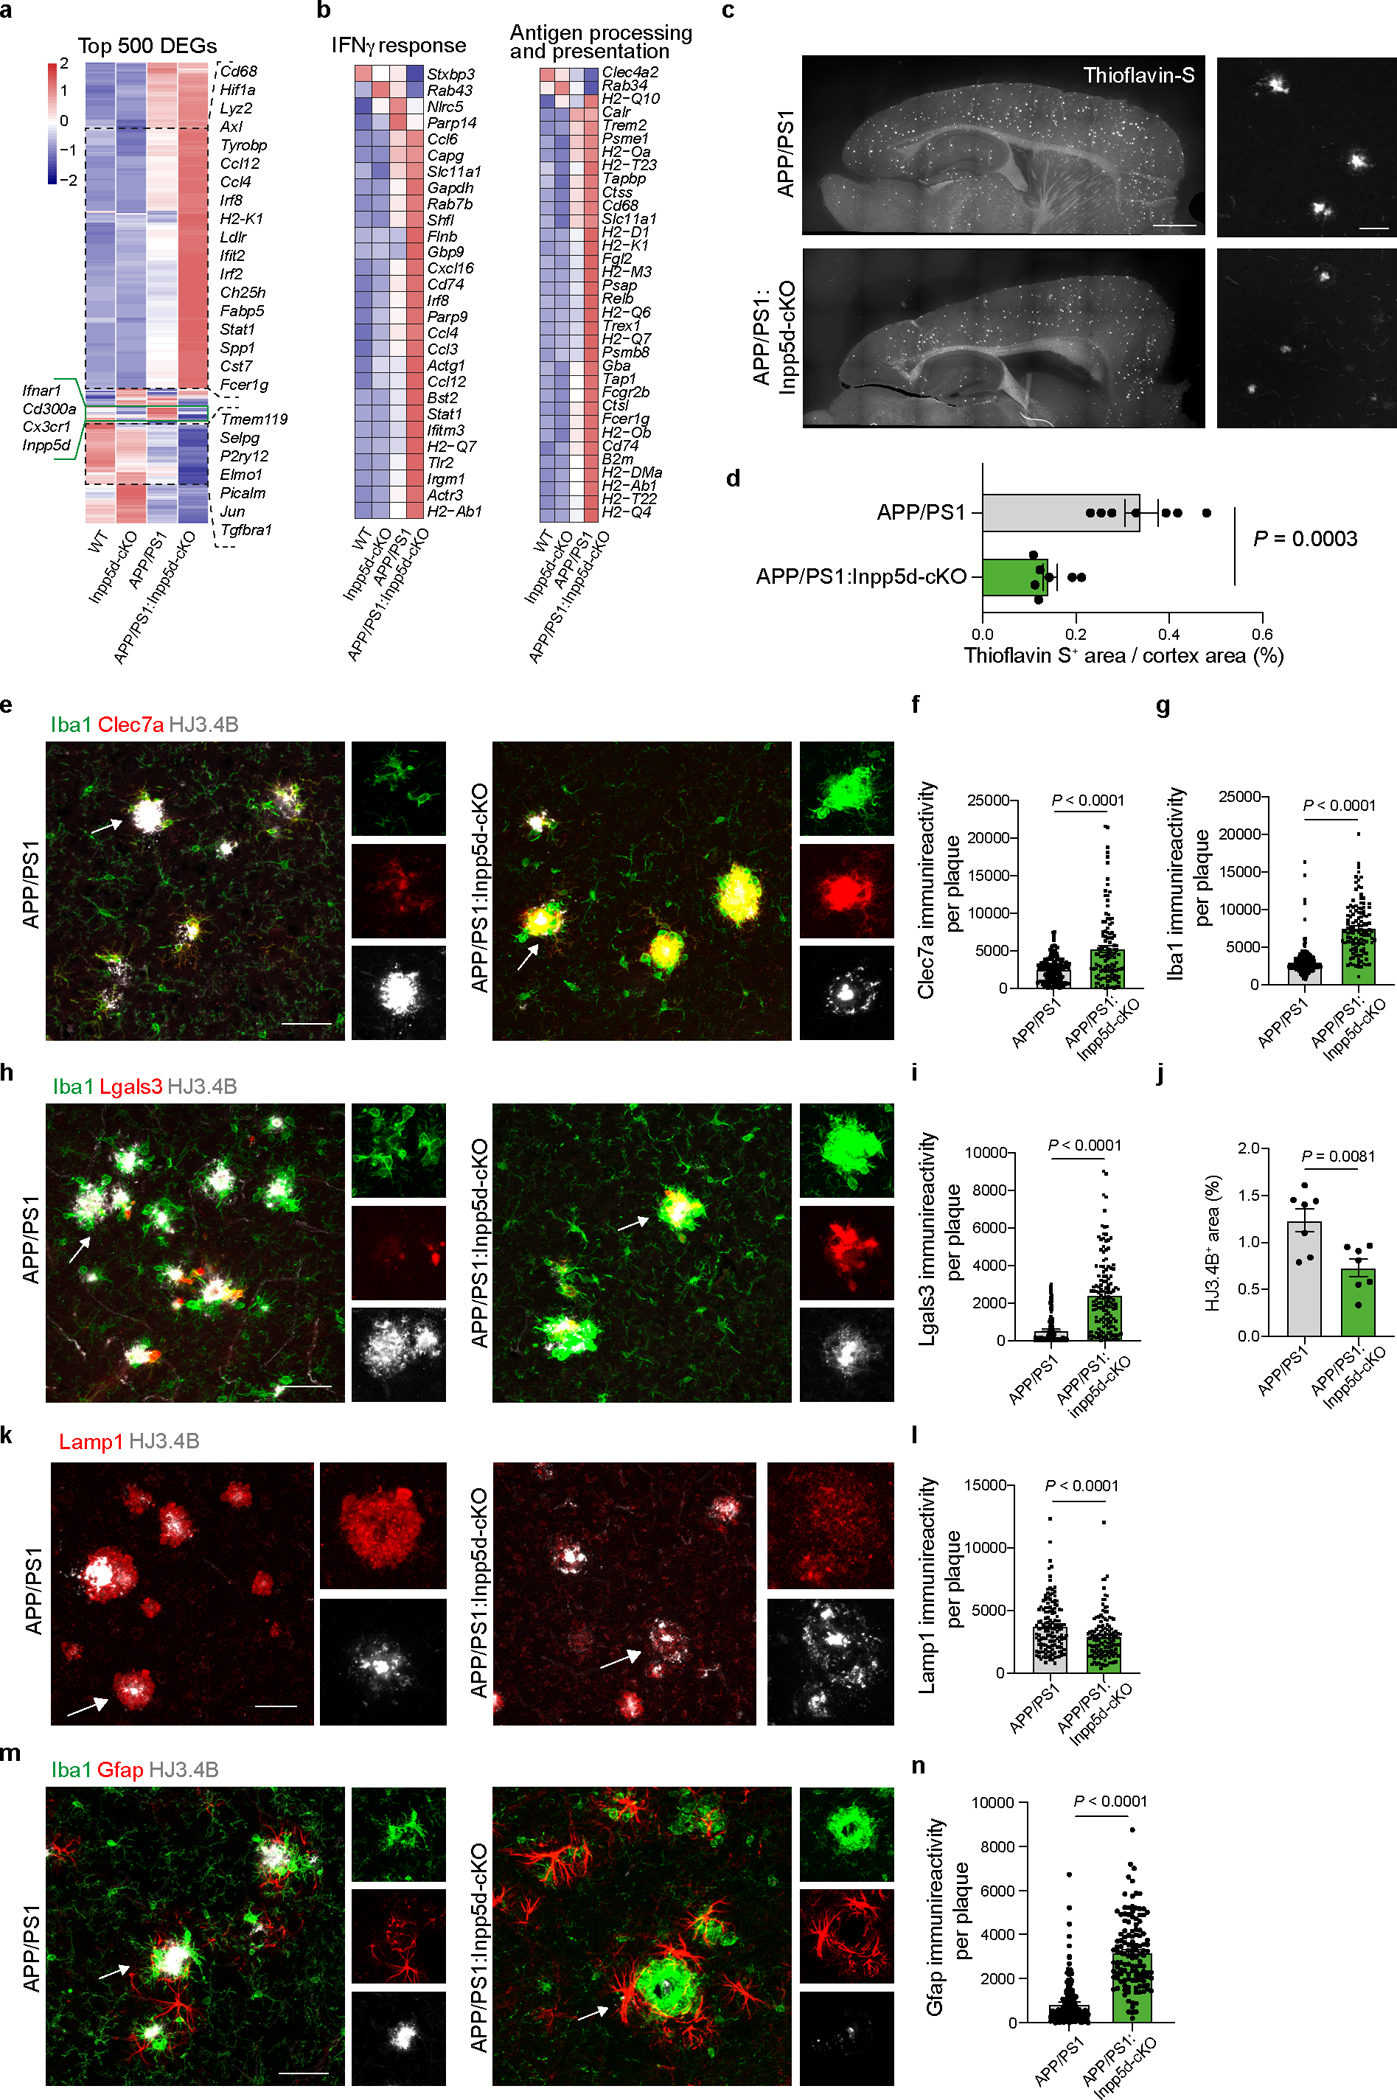
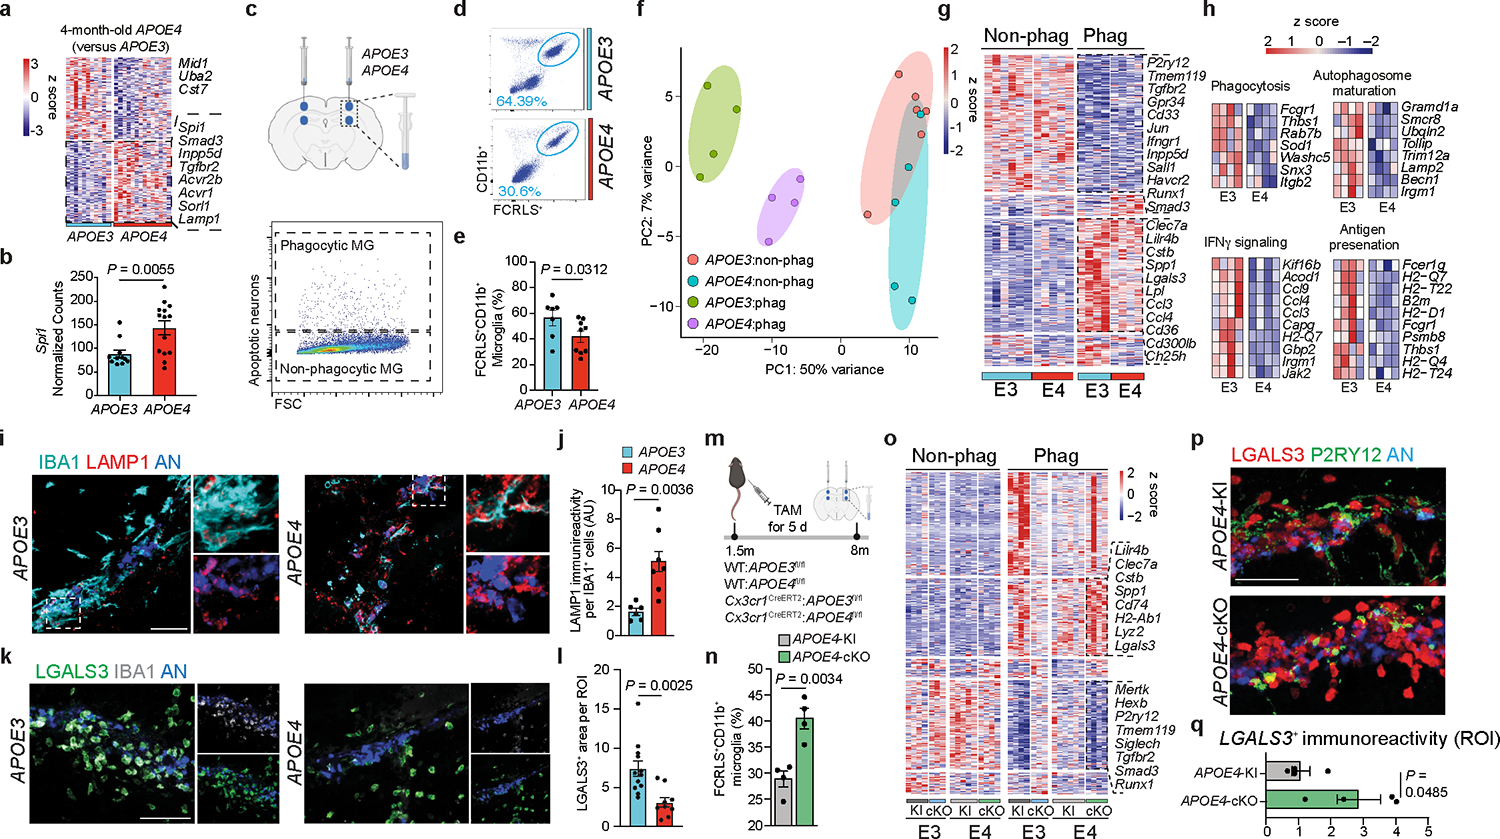
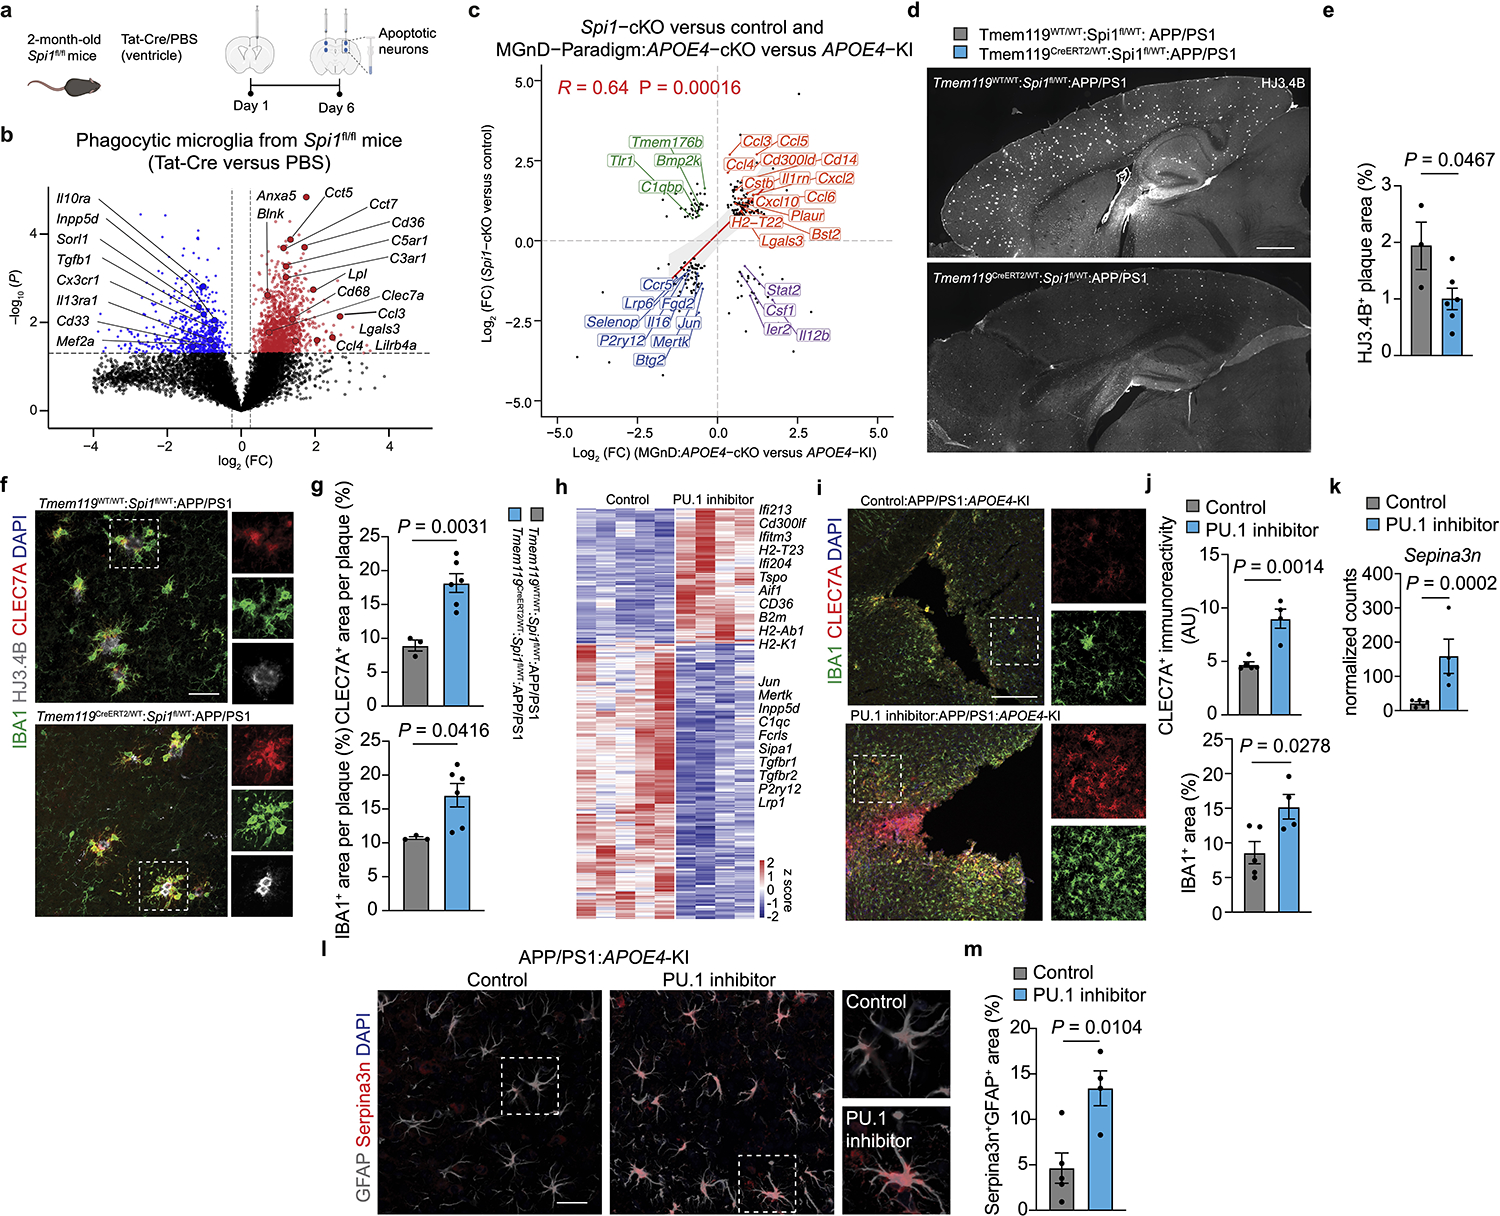
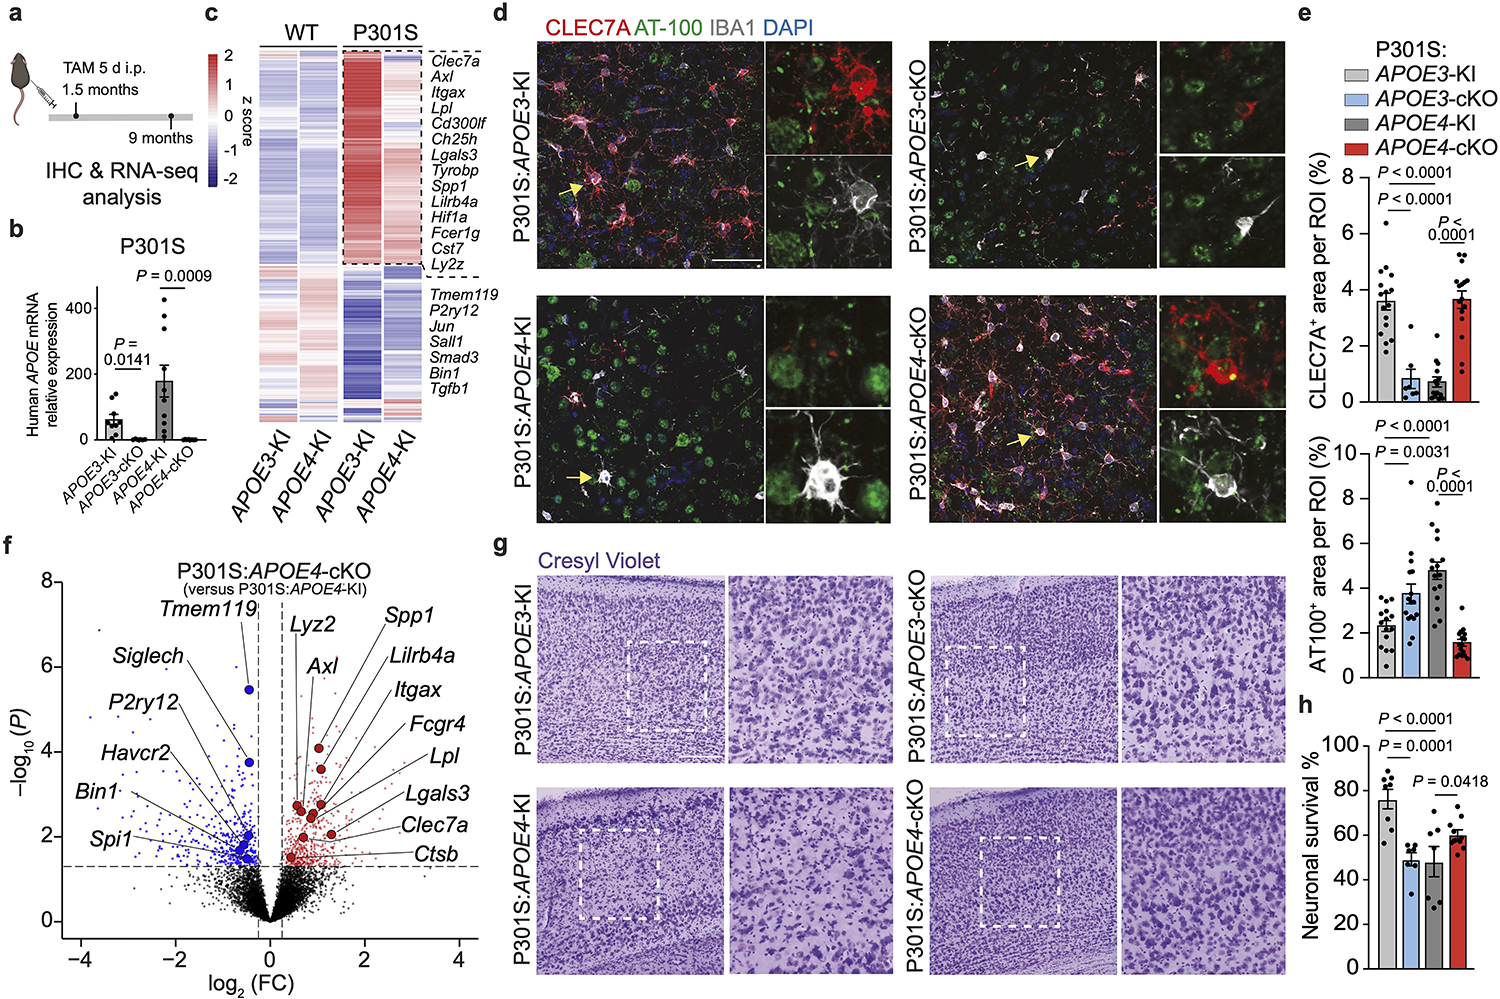
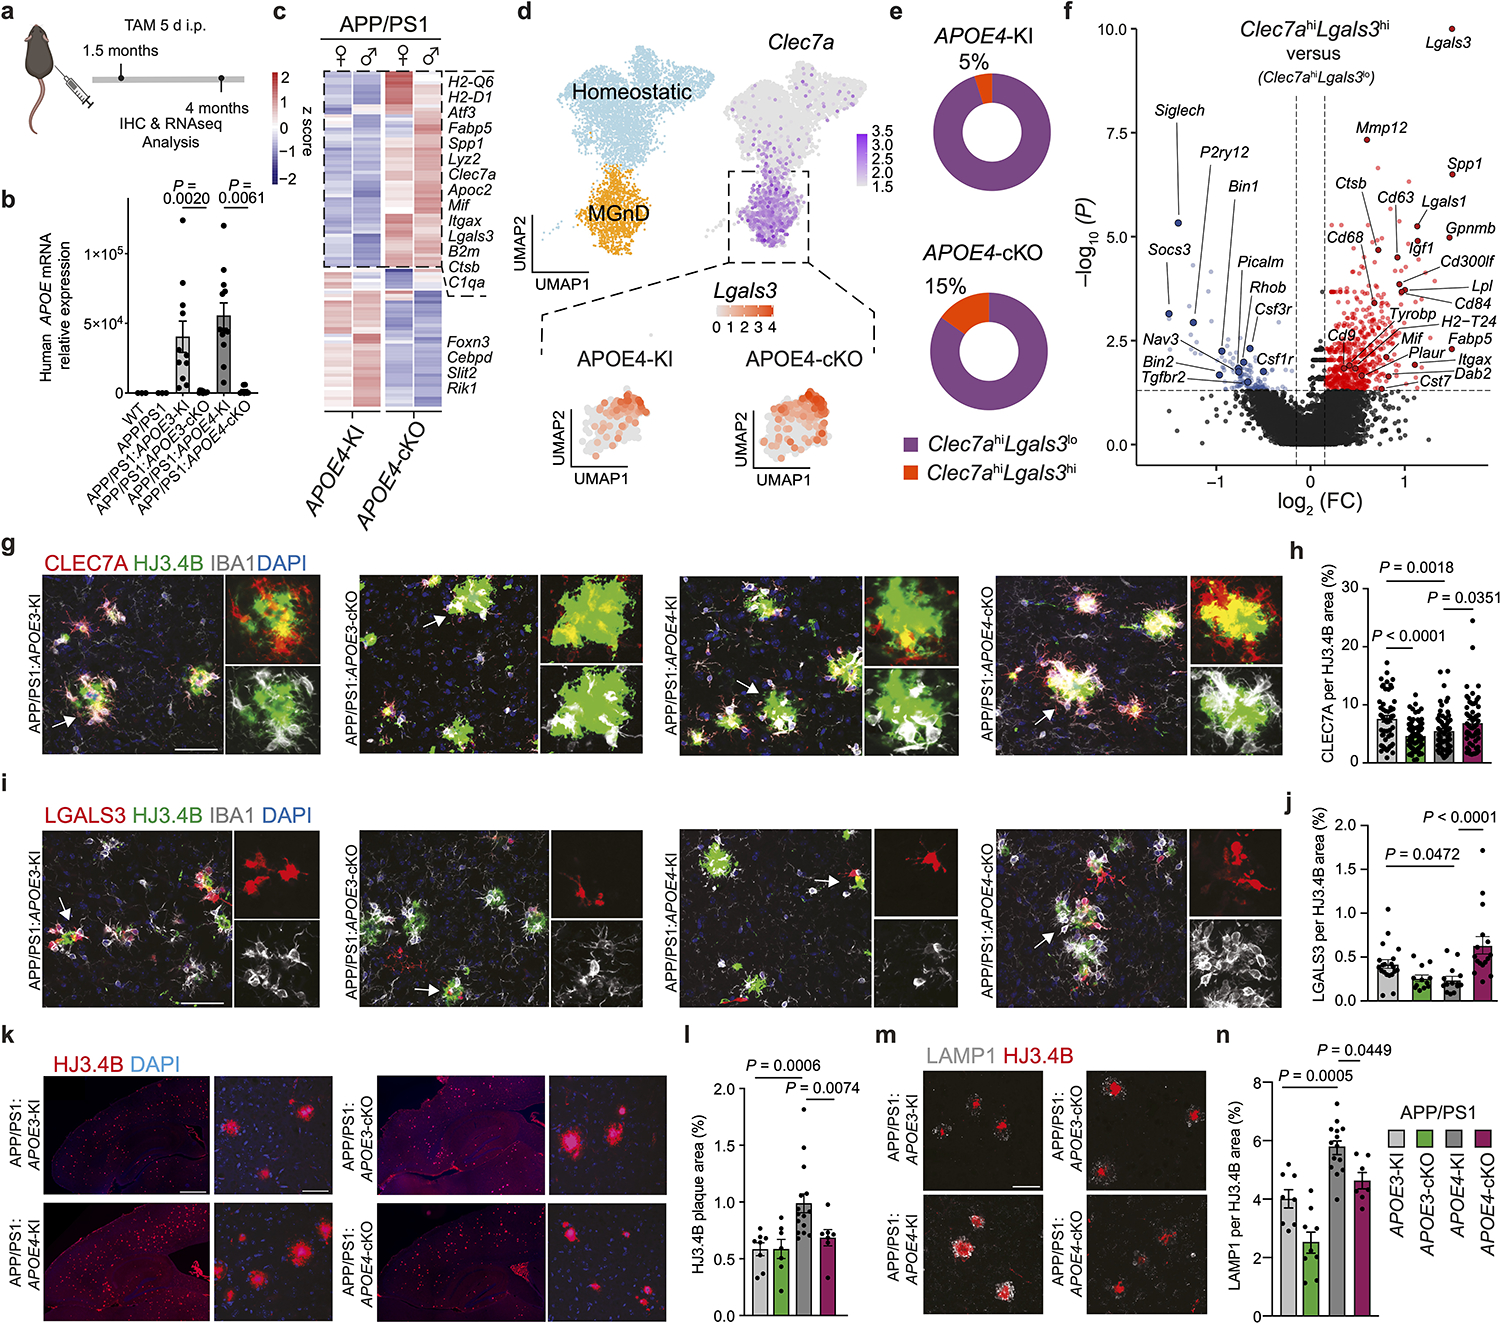
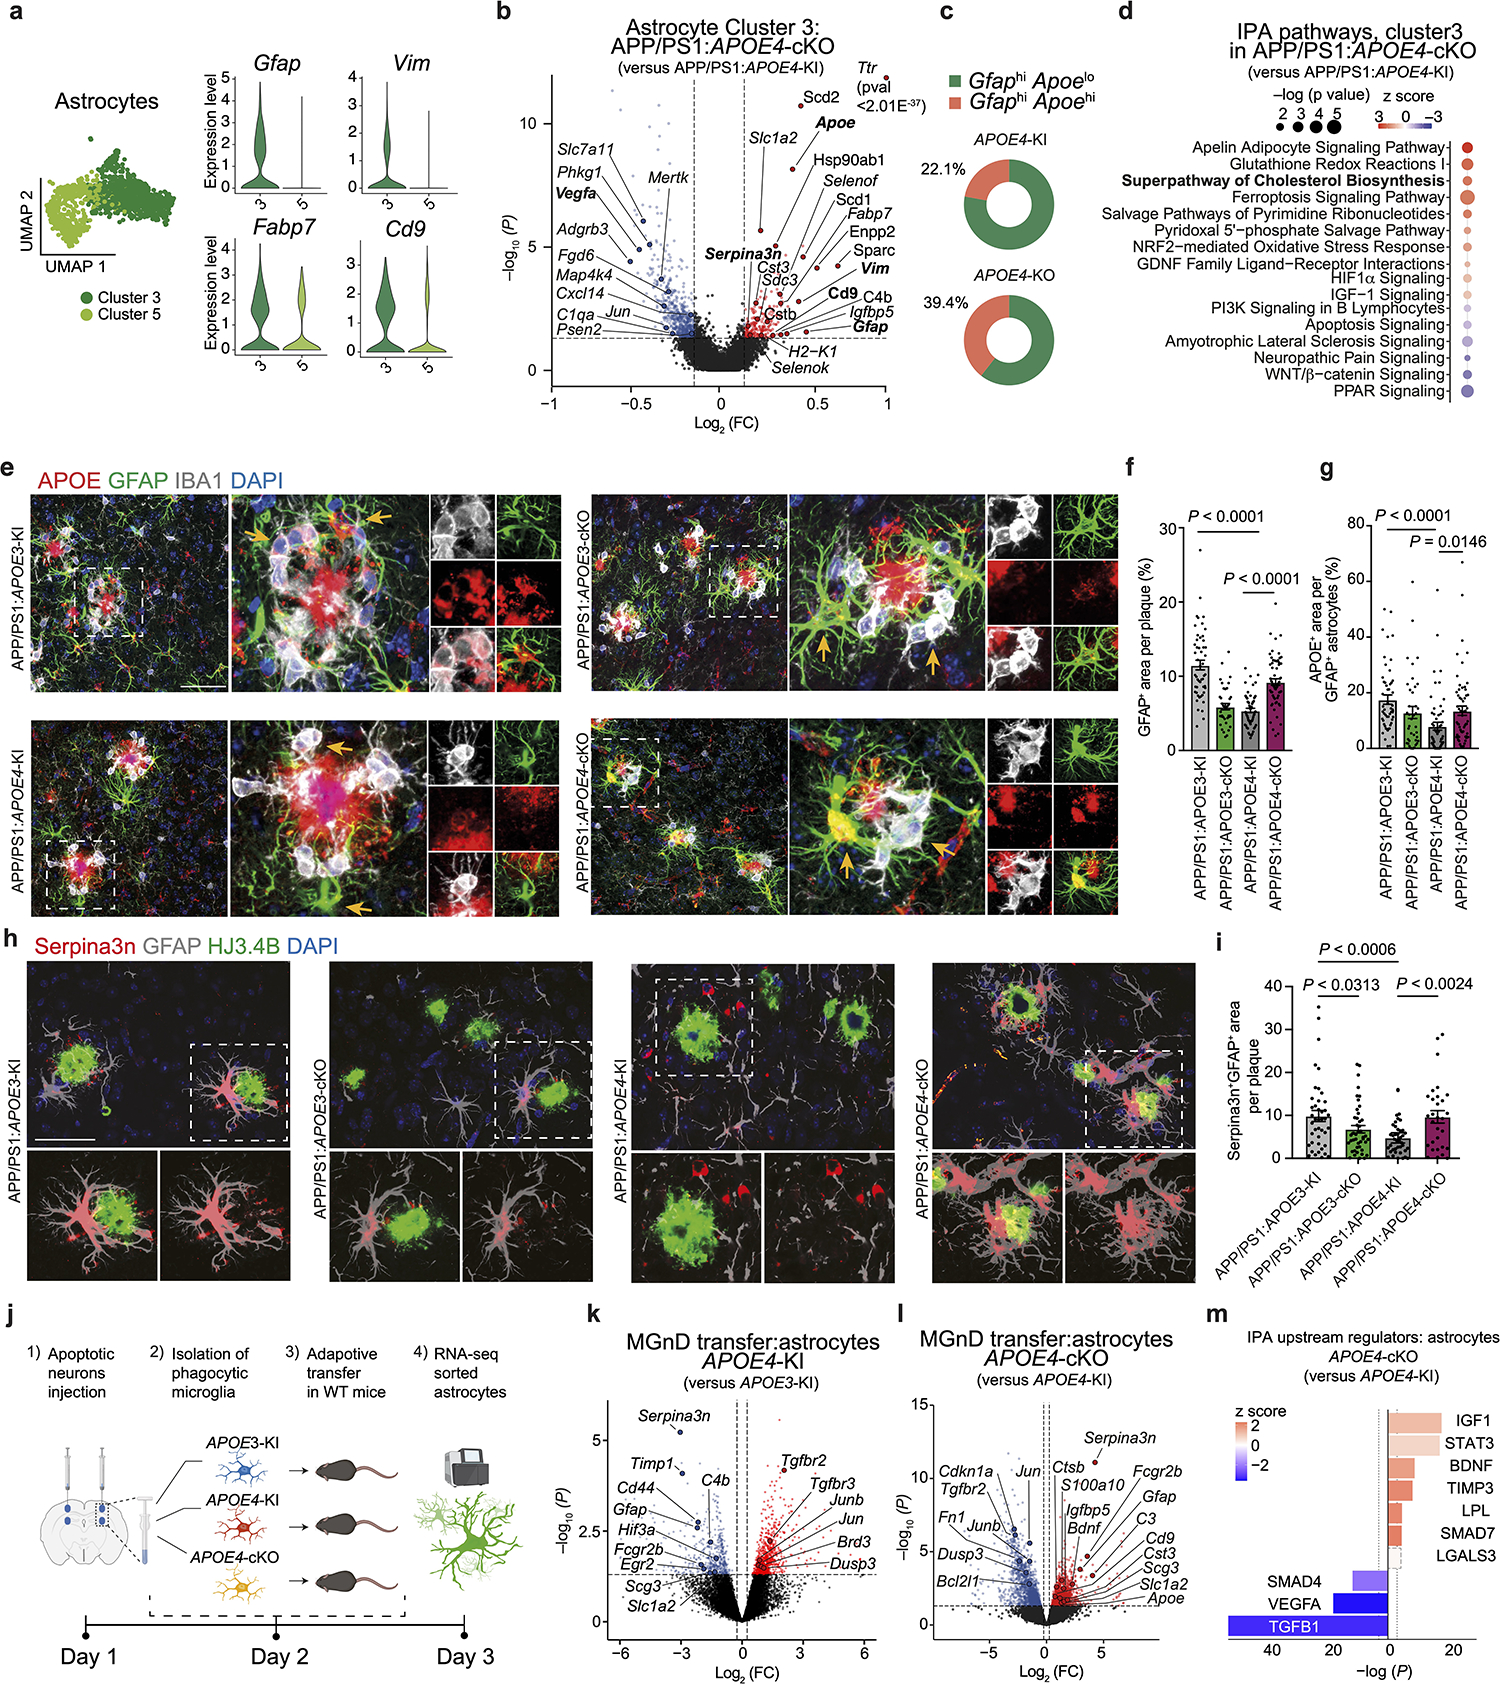
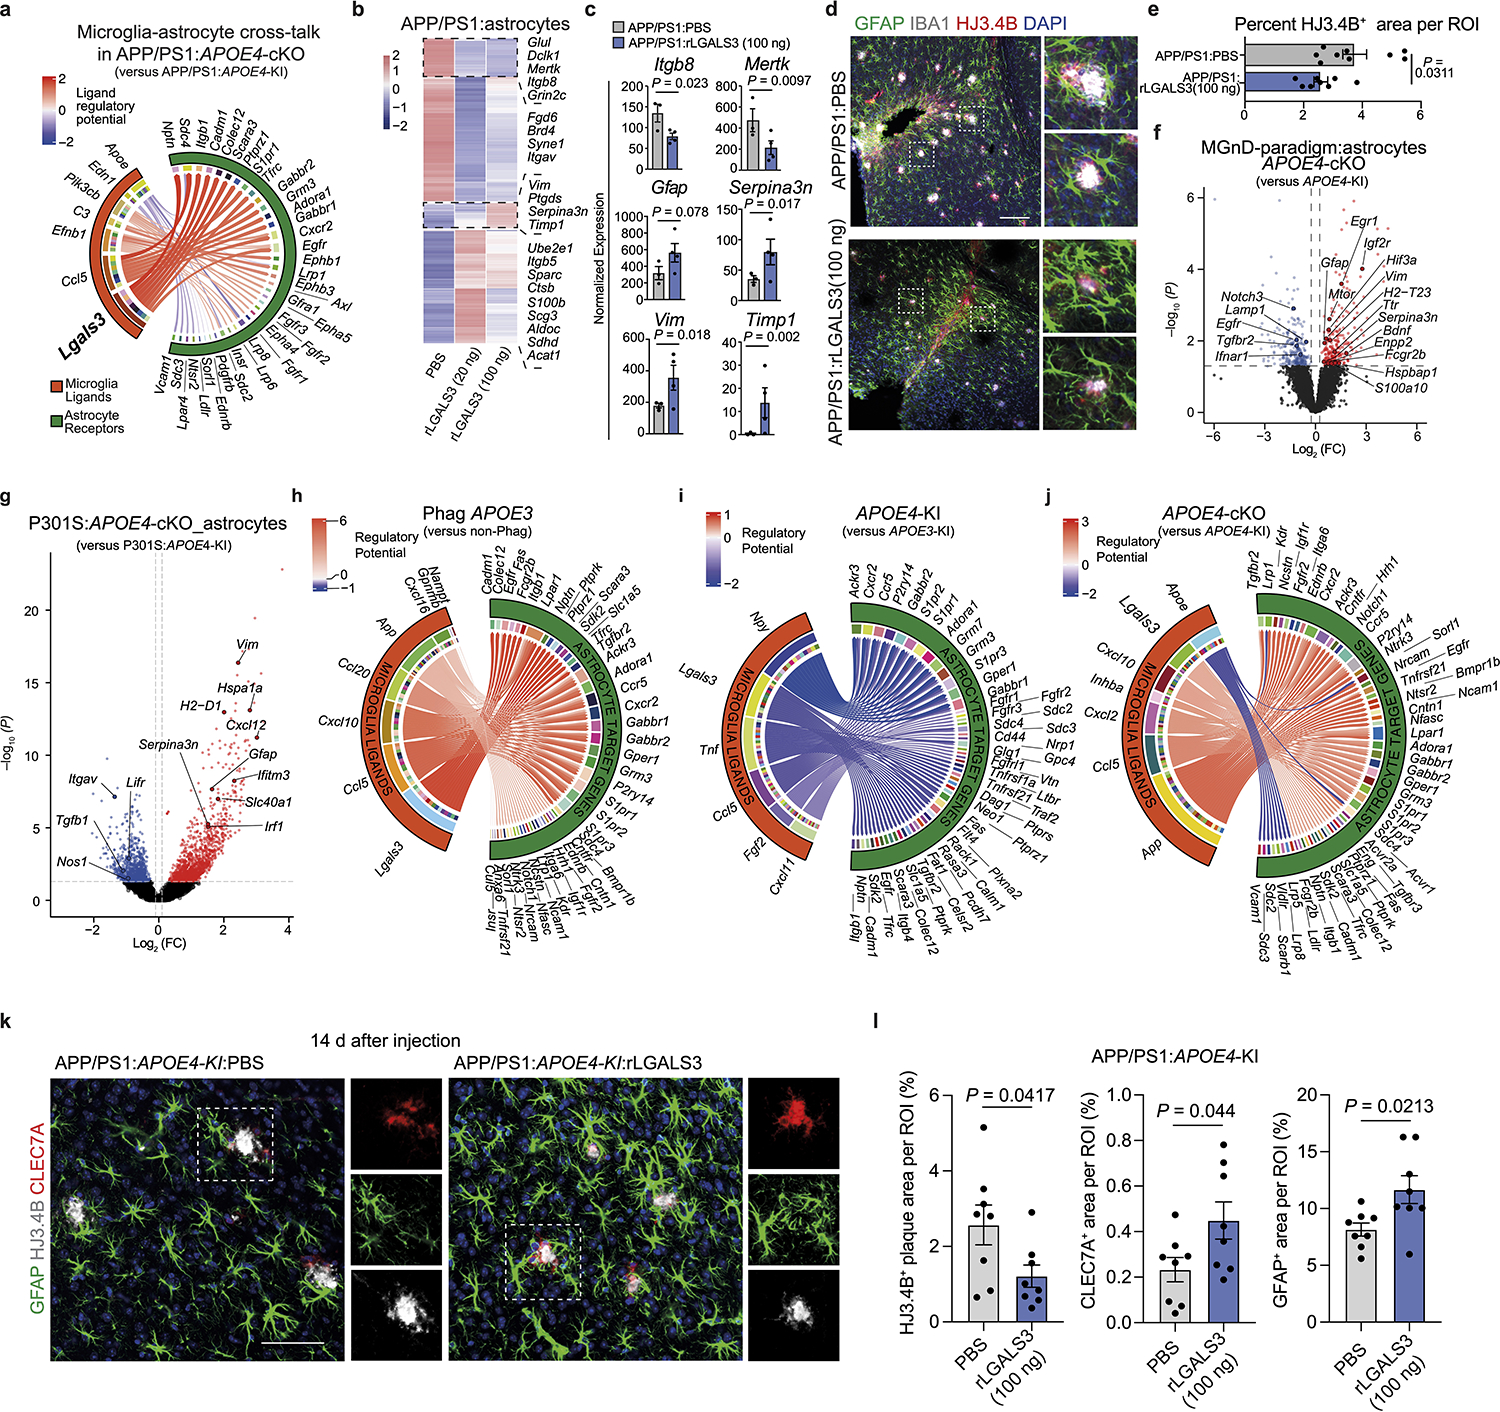
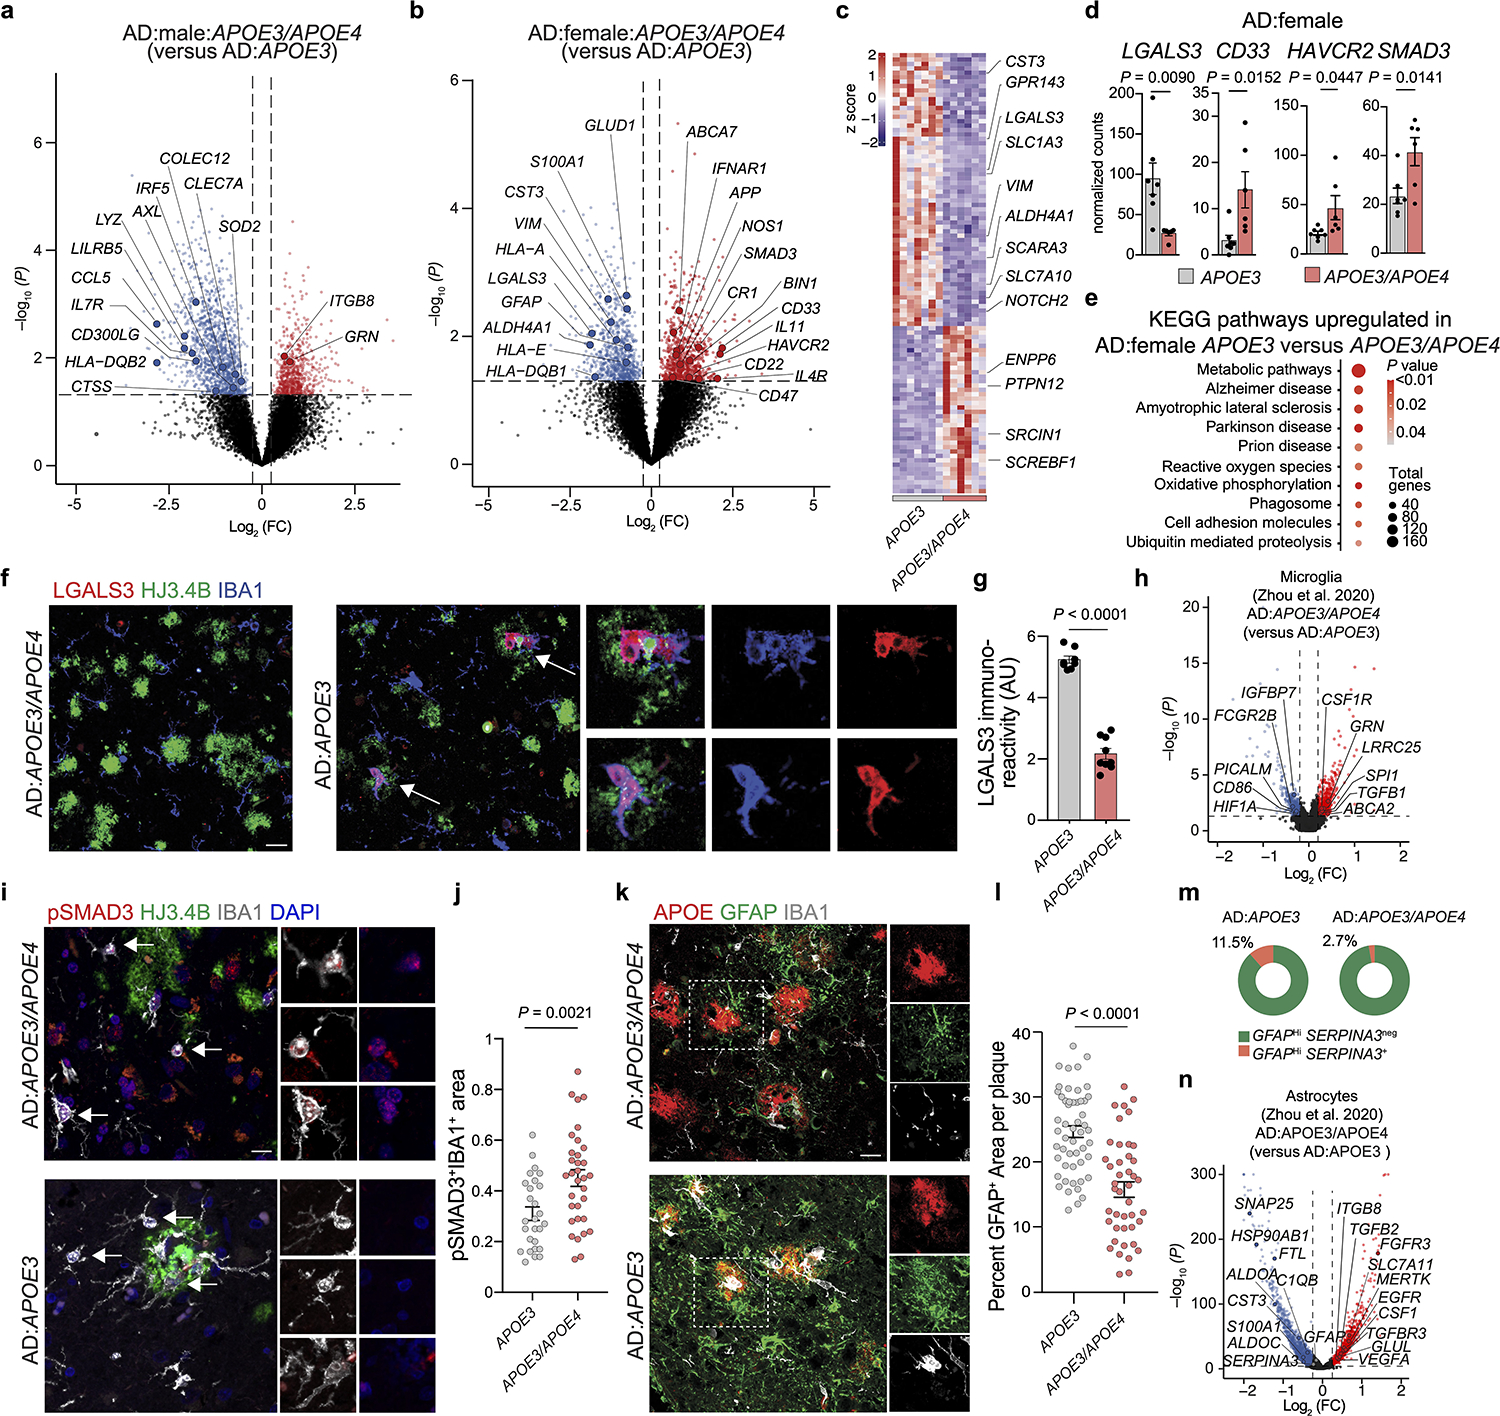
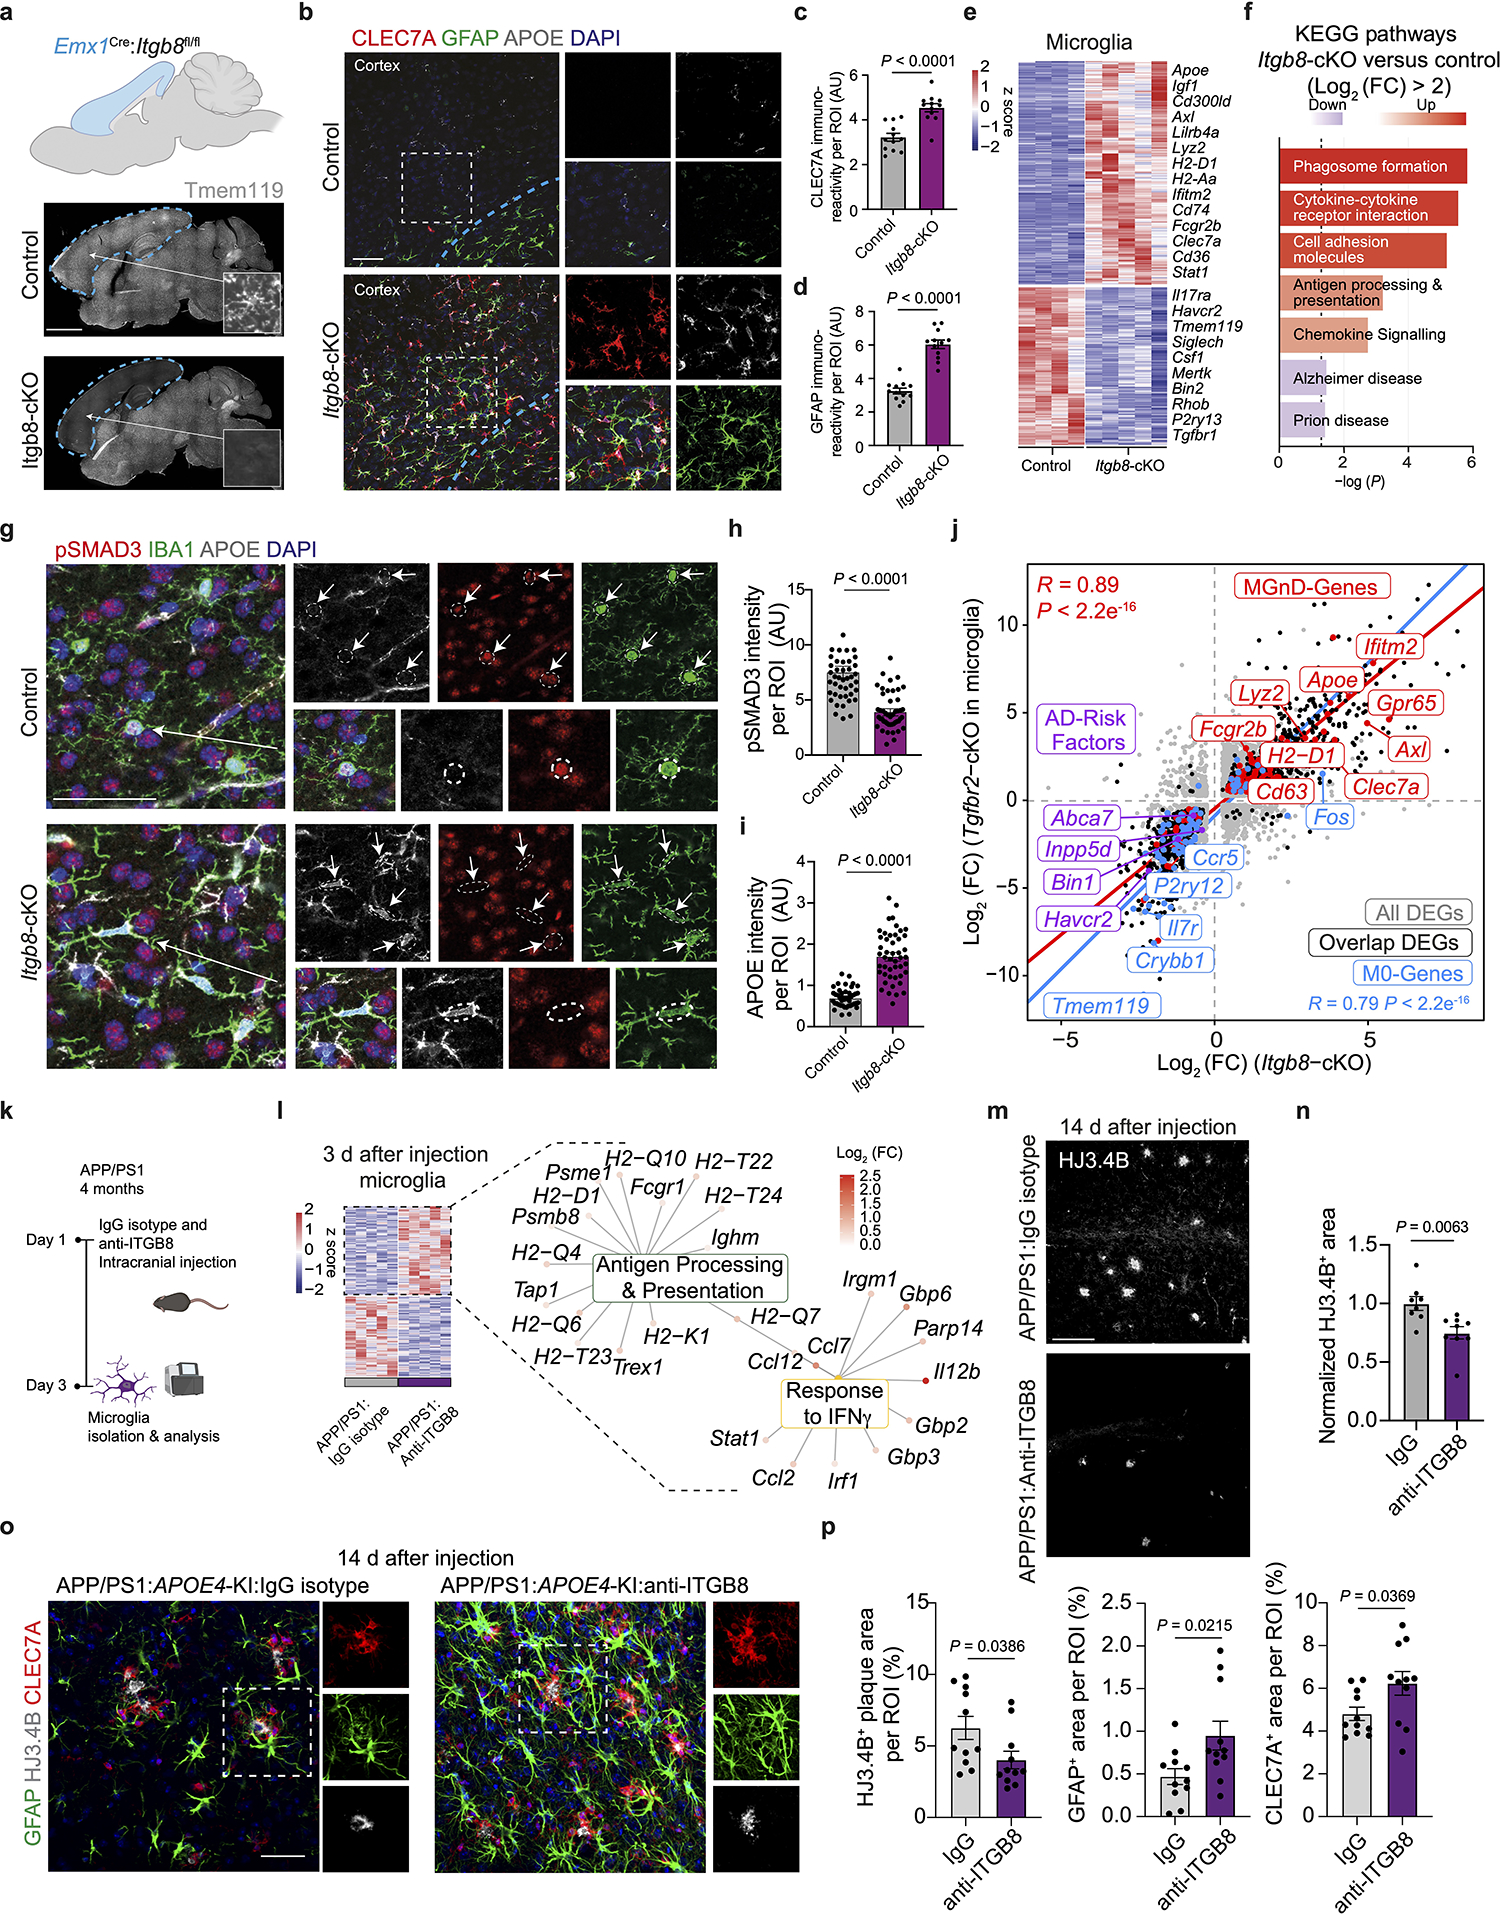
The APOE4 allele is the strongest genetic risk factor for late-onset Alzheimer's disease (AD). The contribution of microglial APOE4 to AD pathogenesis is unknown, although APOE has the most enriched gene expression in neurodegenerative microglia (MGnD). Here, we show in mice and humans a negative role of microglial APOE4 in the induction of the MGnD response to neurodegeneration. Deletion of microglial APOE4 restores the MGnD phenotype associated with neuroprotection in P301S tau transgenic mice and decreases pathology in APP/PS1 mice. MGnD-astrocyte cross-talk associated with β-amyloid (Aβ) plaque encapsulation and clearance are mediated via LGALS3 signaling following microglial APOE4 deletion. In the brains of AD donors carrying the APOE4 allele, we found a sex-dependent reciprocal induction of AD risk factors associated with suppression of MGnD genes in females, including LGALS3, compared to individuals homozygous for the APOE3 allele. Mechanistically, APOE4-mediated induction of ITGB8-transforming growth factor-β (TGFβ) signaling impairs the MGnD response via upregulation of microglial homeostatic checkpoints, including Inpp5d, in mice. Deletion of Inpp5d in microglia restores MGnD-astrocyte cross-talk and facilitates plaque clearance in APP/PS1 mice. We identify the microglial APOE4-ITGB8-TGFβ pathway as a negative regulator of microglial response to AD pathology, and restoring the MGnD phenotype via blocking ITGB8-TGFβ signaling provides a promising therapeutic intervention for AD.


Conflict of interest statement

Competing Interests: O.B., Z.Y. and N.R. are inventors of a patent licensed by Brigham and Women’s Hospital for use of LGALS3 for treatment of neurodegenerative diseases. O.B., Z.Y., N.R., X.Z., T.D.A. and D.S. are inventors for a patent licensed by Brigham and Women’s Hospital and University of California, San Francisco, for use of an ITGB8 blocker for treatment of neurodegenerative diseases. O.B. has a collaboration with GSK and Regulus Therapeutics, receives research funding from Sanofi and GSK and receives honoraria for lectures and consultancy from UCB, Camp4, Ono Pharma USA and General Biophysics. D.M.H. is an inventor on a patent licensed by Washington University to C2N Diagnostics on the therapeutic use of antibodies to tau and on a patent licensed to NextCure on antibodies to APOE. D.M.H. cofounded and is on the scientific advisory board of C2N Diagnostics. D.M.H. is on the scientific advisory board of Denali, Genentech and Cajal Neuroscience and consults for Alector. All other authors have no competing interests.

Figures

Extended Data Fig. 1 |
Extended Data Fig. 1 |. APOE4 impairs microglial response to acute neurodegeneration.
a, H3K9ac peak-plot heat map of microglia from 4-month-old APOE3-KI or APOE4-KI mice (n = 3 mice/group). b, H3K9ac peaks of key genes. c, Volcano plot of DEGs of phagocytic microglia isolated from APOE4-KI vs. APOE3-KI mice. DEGs were identified using DESeq2 analysis with an LRT (n = 4–6 mice/group, P < 0.05). d, Fold change induction of key MGnD genes expressed in phagocytic microglia relative to non-phagocytic microglia, isolated from APOE3-KI and APOE4-KI mice. DEGs were identified using DESeq2 analysis with an LRT and key MGnD genes were selected from Krasemann et al.. e, Violin plot of top-300 induced MGnD genes in phagocytic microglia isolated from APOE3-KI and APOE4-KI mice (Fig. 1g). f, Top-affected canonical pathways in phagocytic microglia compared to non-phagocytic microglia from APOE3-KI and APOE4-KI mice (P < 0.05). g, Quantification of phagocytic Iba1+ cell numbers from AN-injected APOE3-KI and APOE4-KI mice (n = 6 APOE3-KI mice, n = 7 APOE4-KI mice). h, Quantification of Iba1+ cells from AN-injected APOE3-KI and APOE4-KI mice (n = 6 APOE3-KI mice, n = 7 APOE4-KI mice). i, Circos plot illustrating ligand- receptor interactions in APOE4-cKO microglia compared to APOE4-KI microglia. Two-tailed Student’s t-test. Data were presented as mean ± s.e.m.
Extended Data Fig. 2 |
Extended Data Fig. 2 |. No differences of APOE expression between P301S:APOE3-KI and P301S:APOE4-KI mice.
a, Confocal images of GFAP, APOE and Iba1 in P301S:APOE3-KI and P301S:APOE4-KI mice. Scale bar: 50 μm. b, Quantification of APOE in the cortex (n = 5 mice/group). Two-tailed Student’s t-test. Data presented as mean ± s.e.m.
Extended Data Fig. 3 |
Extended Data Fig. 3 |. Targeting microglial APOE4 restores neurodegenerative microglia in APP/PS1 mice.
a, UMAP plot of unsupervised seurat clusters from scRNAseq analysis of brain cells isolated from APP/PS1:APOE4-KI and APP/PS1:APOE4-cKO mice (n = 2). b, UMAP plot of labelled cell types.c, Cell-specific genes used to identify cell types from seurat clusters. d, UMAP plot of microglia/myeloid cells re-clustered. e, Feature plot showing expression of border-associated macrophages genes. f, Heat map of DEGs representing the microglia/myeloid cluster. DEGs were identified using FindAllMarker Seurat function (P < 0.05). g, Feature plot showing co-expression of Lgals3 and Clec7a microglia. h, Ridgeplot of Clec7a and Lgals3 in APOE4-cKO and APOE4-KI in MGnD microglia showing gene expression cut-off for Clec7aHi (2.65) and Lgals3Hi (1.68) microglia.
Extended Data Fig. 4 |
Extended Data Fig. 4 |. Deletion of microglial APOE4 alleviates lipid dysregulation in APP/PS1 mice.
a, Heat map of lipids significantly altered by genotype in microglia isolated from APOE3-KI, APOE4-KI, APP/PS1:APOE3-KI, and APP/PS1:APOE4-KI. DEGs were identified using DESeq2 analysis with an LRT (n = 2 mice, P < 0.05). b, Confocal images of Plin2, Iba1 and HJ3.4B in APP/PS1:APOE3-KI, APP/PS1:APOE3-cKO, APP/PS1:APOE4-KI, and APP/PS1:APOE4-cKO mice. Scale bar: 50 μm. c, Quantification of Plin2+ area in Iba1+ cells (n = 15 cells from APP/PS1:APOE3-KI mice, n = 8 cells from APP/PS1:APOE3-cKO mice, n = 24 cells from APP/PS1:APOE4-KI mice, n = 16 cells from APP/PS1:APOE4-cKO mice). One-way ANOVA. Data presented as mean ± s.e.m.
Extended Data Fig. 5 |
Extended Data Fig. 5 |. Deletion of microglial APOE4 promotes astrocyte activation in APP/PS1 mice.
a, Heat map showing DEGs of clusters 3 and 5 (astrocyte clusters). DEGs were identified using FindMarkers Seurat function (P < 0.05, n = 2). b, UMAP projection of disease-associated astrocyte genes in APP/PS1:APOE4-KI and APP/PS1:APOE4-cKO mice. c, Donut charts showing percentage of GfapHi:Serpina3nLo, GfapHi:Serpina3nHi, GfapHi:VimLo, GfapHi:VimHi, GfapHi:Cd9Lo, and GfapHi:Cd9Hi microglia between APP/PS1:APOE4-KI and APP/PS1:APOE4-cKO mice.
Extended Data Fig. 6 |
Extended Data Fig. 6 |. Impaired induction of MGnD signature and astrocyte activation in APOE ε4 AD brains.
a, DEGs of female APOE ε3/3 carriers (n = 4) vs. APOE ε3/4 (n = 3) carriers analyzed from Olah et al.. DEGs were identified using FindMarkers Seurat function (P < 0.01). b, UMAP plot of brain scRNAseq showing Seurat clusters of AD:APOE ε3/3 carriers and AD:APOE ε3/4 carriers analyzed from dataset by Zhou et al.. c, UMAP plot indicating cell type assignment to clusters analyzed from dataset by Zhou et al.. d, Confocal images of IBA1 and HJ3.4B immunoreactivity and detection of INPP5D gene expression using RNAscope in AD:APOE ε3/4 carriers compared to AD:APOE ε3/3 carriers. e, Quantification of INPP5D fluorescence in IBA1+ microglia in AD:APOE ε3/4 carriers compared to AD:APOE ε3/3 carriers (n = 14 AD:APOE ε3/3 carriers, n = 16 AD:APOE ε3/4 carriers). f, Ridgeplot of GFAPHi vs. GFAPLo astrocytes analyzed from dataset by Zhou et al.. g, Confocal images of GFAP and HJ3.4B immunoreactivity and detection of ITGB8 gene expression using RNAscope in AD:APOE ε3/4 males compared to AD:APOE ε3/3 males. h,i, Quantification of ITGB8 fluorescence in ROI (h) and in GFAP+ astrocytes (i) in AD:APOE ε3/4 males compared to AD:APOE ε3/3 males (n = 7 AD:APOE ε3/3 carriers, n = 8 AD:APOE ε3/4 carriers). j, Confocal images of Gfap and HJ3.4B immunoreactivity and detection of Itgb8 mRNA expression using RNAscope in APP/PS1:APOE4-cKO mice compared to APP/PS1:APOE4-KI mice. k, Quantification of Itgb8 fluorescence in Gfap+ astrocytes (n = 10 ROIs from 3 APP/PS1:APOE4-KI mice, 18 ROIs from 5 APP/PS1:APOE4-cKO mice). Two-tailed unpaired Student’s t-test. Scale bar: 50 μm. Data were shown as mean ± s.e.m.
Extended Data Fig. 7 |
Extended Data Fig. 7 |. Expression of Itgb8 in the adult mouse brain.
a, Dot plot showing expression level of Itgb8 in multiple CNS cell types (adopted from Zhang et al.). b, Representative in situ image of Itgb8 in the cortex of adult mouse brain (Allen Brain Atlas: https://mouse.brain-map.org). n = 2 (the Allen Brain Atlas tested the Itgb8 probe on two brains; one sectioned sagitally and another sectioned coronally). Scale bar: 1 mm. c, Schematics of Itgb8−tdT transgenic mouse strain. d, Representative images of Itgb8-TdT, Sox9, Gfap (top); Itgb8-TdT, Pdgfra, Olig2 (middle); and Itgb8-TdT, NeuN, Olig2 (bottom). Arrowheads indicate magnified ROIs (n = 6). Data are representative of 2 independent experiments. Scale bar: 50 μm.
Extended Data Fig. 8 |
Extended Data Fig. 8 |. Blocking Itgb8 signaling enhances MGnD response and reduces AD pathology in APP/PS1 mice.
ac, Confocal images of Tmem119, Apoe, and Clec7a staining (a); P2ry12, Apoe, and Clec7a staining (b); Lgals3, Iba1, and Clec7a staining (c) in the cortex of Itgb8-cKO mice and littermate controls. Arrows indicate microglia. Data are representative of 2 independent experiments. Scale bar: 50 μm. d, Gene ontology network of increased DEGs in microglia from Itgb8-cKO mice compared to WT littermates. DEGs were identified using DESeq2 analysis with an LRT and gene ontology pathways selected with P < 0.05. e, PCA of each genotype. f, Heat map of DEGs of phagocytic- and non-phagocytic microglia isolated from WT and Itgb8-cKO mice. DEGs were identified using DESeq2 analysis with an LRT (n = 5–6 mice/group, P < 0.05). g, Gene ontology network of top pathways in phagocytic- and non-phagocytic microglia from Itgb8-cKO mice compared with WT mice. DEGs were identified using DESeq2 analysis with an LRT and gene ontology pathways selected with P < 0.05. h, FACS plot of Aβ phagocytosis in WT and Itgb8-cKO mice. Percentage calculated as Aβ42-Alexa Fluor 555+ out of Fcrls+CD11b+Ly6C microglia. i, Quantification of percentage of Aβ−42 phagocytic microglia in WT and Itgb8-cKO mice (n = 5 WT mice, n = 10 Itgb8-cKO mice). j, Confocal images of MHC II, Iba1, and HJ3.4B in APP/PS1 mice injected with anti-ITGB8 neutralizing antibody and IgG isotype control. Scale bar: 100 μm. k, Quantification of MHC II+ immunoreactivity at the injection site (n = 4 mice/group). Two-tailed Student’s t-test. Data were presented as mean ± s.e.m.
Extended Data Fig. 9 |
Extended Data Fig. 9 |. Microglial deletion of Smad2/3 induces MGnD phenotype.
a, Confocal images showing Iba1, Tmem119 and Cd68 staining in control and Smad2/3-cKO mice. Scale bar: 50 μm. b, Quantification of Cd68+ immunoreactivity (n = 5 WT mice, n = 4 Smad2/3-cKO mice). c, Confocal images of Iba1, Apoe and Gfap in control and Smad2/3-cKO mice. Scale bar: 50 μm. d, Quantification of Apoe+ and Gfap+ immunoreactivity (n = 4 mice/group).eh, Expression of key homeostatic and MGnD genes in microglia from Itgb8-cKO (n = 4–5 mice/group) (e), Smad2/3-cKO (n = 4 mice/group) (f), Tgfbr2-cKO (n = 3 mice/group) (g) and Nrros-KO (n = 5 mice/group) (h) relative to non-transgenic control mice. il, Expression levels of key AD-risk factor genes (Inpp5d, Havcr2 and Bin1) in microglia from Itgb8-cKO in microglia from Itgb8-cKO (n = 4–5 mice/ group) (i), Smad2/3-cKO (n = 4 mice/group) (j), Tgfbr2-cKO (n = 3 mice/group) (k) and Nrros-KO (n = 5 mice/group) (l), relative to non-transgenic control mice. Two-tailed Student’s t-test. Data were shown as mean ± s.e.m.
Extended Data Fig. 10 |
Extended Data Fig. 10 |. Microglial deletion of the homeostatic checkpoint Inpp5d facilitates plaque clearance via the induction of MGnD response.
a, Heat map of top-500 DEGs in WT:control vs. WT:Inpp5d-cKO vs. APP/ PS1:control vs. APP/PS1:Inpp5d-cKO microglia. DEGs were identified using DESeq2 analysis with an LRT (n = 2–5 mice/group, P < 0.05). b, Gene ontology analysis of DEGs for IFNγ response, antigen processing and presentation in microglia. DEGs were identified using DESeq2 analysis with an LRT and gene ontology pathways selected with P < 0.05. c, Representative images of Thioflavin-S staining. Scale bar: 1 mm (left), 50 μm (right). d, Quantification of Thioflavin-S staining in APP/PS1 (n = 7) and APP/PS1:Inpp5d-cKO (n = 7) mice. e, Confocal images of Iba1, Clec7a and HJ3.4B staining. Scale bar: 50 μm. f,g, Quantification of Clec7a (f) and Iba1 (g) immunoreactivity in association with Aβ plaques (n = 218 plaques from APP/PS1 mice, n = 115 plaques from APP/PS1:Inpp5d-cKO mice). h, Confocal images of Iba1, Lgals3 and HJ3.4B staining. Scale bar: 50 μm. i,j, Quantification of Lgals3 (i) and HJ3.4B (j) immunoreactivity in association with Aβ plaques (n = 141 plaques from APP/PS1 mice, n = 186 plaques from APP/PS1:Inpp5d-cKO mice for Lgals3, n = 7 mice for HJ3.4B). k, Confocal images of Lamp1 and HJ3.4B staining. Scale bar: 50 μm. l, Quantification of Lamp1 immunoreactivity in association with Aβ plaques (n = 126 plaques from APP/PS1 mice, n = 138 plaques from APP/PS1:Inpp5d-cKO mice). m, Confocal images of Iba1, Gfap and HJ3.4B staining. Scale bar: 50 μm. n, Quantification of Gfap immunoreactivity in association with Aβ plaques (n = 154 plaques from APP/PS1 mice, n = 127 plaques from APP/PS1:Inpp5d-cKO mice). Two-tailed Student’s t-test. Data were presented as mean ± s.e.m.
Fig. 1
Fig. 1. APOE4 impairs the microglial response to acute neurodegeneration.
a, Heat map of differentially expressed genes from APOE4-KI vs. APOE3-KI microglia at 4 months of age (n = 11–14 mice per group, P < 0.05). b, Spi1 normalized counts (n = 11–14 mice per group). c, Top, schematics of apoptotic neurons injection to the cortex and hippocampus of 8-months-old APOE3-KI and APOE4-KI mice; Bottom, sorting strategy 16 h after injection of phagocytic and non-phagocytic microglia (MG) for labeled apoptotic neurons; Figure created with Biorender.com; FSC, forward scatter. d, Gating strategy for FCRLS+CD11b+ microglia from the apoptotic neuron injection site in APOE3-KI and APOE4-KI mice. e, Bar plot showing the percentage of FCRLS+CD11b+ cells (n = 7 APOE3-KI mice, n = 9 APOE4-KI mice). f, Principal component analysis (PCA) of each group; APOE3:non-phag, APOE4:non-phag; APOE3:phag, APOE4:phag. g, Heat map of phagocytic and non-phagocytic microglia from APOE3-KI (E3) and APOE4-KI (E4) mice. Differentially expressed genes were identified using DESeq2 analysis with a likelihood ratio test (LRT; n = 4–6 mice per group, P < 0.05). h, Gene ontology analysis of differentially expressed genes for phagocytosis, autophagosome maturation, IFNγ signaling and antigen presentation (P < 0.05). i, Confocal microscopy images of IBA1, LAMP1 and apoptotic neurons (AN) at the injection sites. j, Quantification of LAMP1 immunoreactivity per IBA1+ cell (n = 6 APOE3-KI mice, n = 7 APOE4-KI mice); AU, arbitrary units. k, Confocal microscopy images of IBA1, LGALS3 and apoptotic neurons at the injection sites. l, Quantification of LGALS3+ area per region of interest (ROI) at the injection site (n = 12 ROIs from the APOE3-KI group, n = 9 ROIs from the APOE4-KI group). m, Schematics of tamoxifen (TAM) administration at 1.5 months of age and the injection of apoptotic neuron to cortex and hippocampus of 8-months-old APOE3-KI, APOE4-KI, APOE3-cKO and APOE4-cKO mice. Figure created with Biorender.com. n, Percentage of FCRLS+CD11b+ microglia in the injection site in APOE4-KI and APOE4-cKO mice (n = 4 mice per group). o, Heat map of non-phagocytic and phagocytic microglia isolated from APOE3-KI, APOE3-cKO, APOE4-KI, and APOE4-cKO injected with apoptotic neurons. Differentially expressed genes were identified using DESeq2 analysis with an LRT (n = 3–6 mice per group, P < 0.05). p, Confocal images of P2RY12, LGALS3, and apoptotic neurons from APOE4-KI and APOE4-cKO mice. q, Quantification of LGALS3+ area per ROI at injection sites (n = 4 mice per group). Data were analyzed by two-tailed Student’s t-test. Scale bars, 50 μm. Data are presented as mean ± s.e.m.
Fig. 2
Fig. 2. APOE4 impairs the microglial response to neurodegeneration via PU.1.
a, Schematics of Tat-Cre or PBS injection to the brains of Spi1fl/fl mice followed by injection of apoptotic neurons. Figure created with Biorender.com. b, Volcano plot showing differentially expressed genes in phagocytic microglia isolated from Spi1fl/fl mice treated with Tat-Cre or PBS. Differentially expressed genes were identified using DESeq2 analysis with an LRT (n = 5 mice per group, P < 0.05). c, Scatter plot comparing the differentially expressed genes of microglia from Spi1-cKO and APOE4-cKO mice. Differentially expressed genes were identified using DESeq2 analysis with an LRT (P < 0.05, log2 (fold change) (log2 (FC) of >0.25 or <–0.25). d, Representative images of brain sections from Tmem119WT/WT:Spi1fl/WT:APP/PS1 and Tmem119CreERT2/WT:Spi1fl/WT:APP/PS1 mice stained for HJ3.4B; scale bar, 1mm. e, Quantification of HJ3.4B+ area per ROI (n = 3 Tmem119WT/WT:Spi1fl/WT:APP/PS1 mice, n = 6 Tmem119CreERT2/WT:Spi1fl/WT:APP/PS1 mice). f, Confocal images of CLEC7A, HJ3.4B and IBA1 in Tmem119WT/WT:Spi1fl/WT:APP/PS1 and Tmem119CreERT2/WT:Spi1fl/WT:APP/PS1 mice; scale bar, 50 μm. g, Quantification of CLEC7A+ and IBA1+ area per plaque (n = 3 Tmem119WT/WT:Spi1fl/WT:APP/PS1 mice, n = 6 Tmem119CreERT2/WT:Spi1fl/WT:APP/PS1 mice). h, Heat map of differentially expressed genes from microglia isolated from PU.1 inhibitor versus vehicle control-injected APP/PS1:APOE4-KI mice. Differentially expressed genes were identified using DESeq2 analysis with an LRT (n = 4–5 mice per group, P < 0.05). i, Confocal images of IBA1 and CLEC7A in PU.1 inhibitor- and control-injected APP/PS1:APOE4-KI mice; scale bar, 200 μm. j, Quantification of CLEC7A immunoreactivity and IBA1+ area per ROI (n = 5 mice from control group, n = 4 mice from PU.1 inhibitor group). k, Normalized counts of Serpina3n in astrocytes isolated from PU.1 inhibitor- and vehicle control-injected APP/PS1:APOE4-KI mice (n = 5 mice from the control group, n = 4 mice from the PU.1 inhibitor group). l, Confocal images of GFAP and Serpina3n in PU.1 inhibitor- and vehicle control-injected APP/PS1:APOE4-KI mice; scale bar, 50 μm. m, Quantification of Serpina3n+GFAP+ area per ROI (n = 5 mice from the control group, n = 4 mice from the PU.1 inhibitor group). Data were analyzed by two-tailed Student’s t-test and are presented as mean ± s.e.m.
Fig. 3
Fig. 3. Deletion of microglial APOE4 restores MGnD response to chronic neurodegeneration and promotes neuroprotection.
a, Schematics of tamoxifen administration at 1.5 months of age and analysis of P301S mice at 9 months of age; Figure created with Biorender.com; i.p., intraperitoneal. b, RT-qPCR validation of human APOE expression in sorted microglia (n = 9 P301S:APOE3-KI mice, n = 6 P301S:APOE3-cKO mice, n = 10 P301S:APOE4-KI mice, n = 8 P301S:APOE4-cKO mice). c, Differentially expressed genes of aggregated samples for WT and tau (P301S) mice with APOE variants. Differentially expressed genes were identified using DESeq2 analysis with an LRT (n = 3–11 mice per group, P < 0.01). d, Confocal images of CLEC7A, phospho-tau (AT-100) and IBA1. Arrowheads indicate CLEC7A+ microglia associated with phospho-tau in the cortex in P301S:APOE3-KI, P301S:APOE3-cKO, P301S:APOE4-KI, and P301S:APOE4-cKO mice; Scale bar, 50 μm. e, Quantification of CLEC7A+ area and AT-100+ area in the cortex (n = 16 ROIs from P301S:APOE3-KI mice, n = 7 ROIs from P301S:APOE3-cKO mice, n = 14 ROIs from P301S:APOE4-KI mice, n = 16 ROIs from P301S:APOE4-cKO mice). f, Volcano plots of differentially expressed genes of P301S:APOE4-cKO versus P301S:APOE4-KI mice. Differentially expressed genes were identified using DESeq2 analysis with an LRT (n = 3–8 mice per group, P < 0.05). g, Representative images of Cresyl Violet staining of P301S mice carrying different APOE variants. Dashed squares indicate area of interest; Scale bar, 200 μm. h, Quantification of cortical neurons in WT and P301S mice carrying different APOE variants (n = 8 P301S:APOE3-KI mice, n = 7 P301S:APOE3-cKO mice, n = 7 P301S:APOE4-KI mice, n = 10 P301S:APOE4-cKO mice). Data were analyzed by one-way analysis of variance (ANOVA) and are presented as mean ± s.e.m.
Fig. 4
Fig. 4. Targeting microglial APOE4 restricts Aβ pathology in APP/PS1 mice.
a, Schematics of tamoxifen administration at 1.5 months of age and analysis of APP/PS1 mice at 4 months of age; Figure created with Biorender.com. b, RT-qPCR validation of human APOE expression in sorted microglia (n = 3 WT mice, n = 3 APP/PS1 mice, n = 11 APP/PS1:APOE3-KI mice, n = 11 APP/PS1:APOE3-cKO mice, n = 12 APP/PS1:APOE4-KI mice, n = 8 APP/PS1:APOE4-cKO mice). c, Heat map showing the top 100 differentially expressed genes in microglia isolated from APP/PS1:APOE4-KI versus APP/PS1:APOE4-cKO mice. Differentially expressed genes were identified using DESeq2 analysis with an LRT (n = 5–9 mice per group, P < 0.01). d, Uniform manifold approximation and projection (UMAP) plot of scRNA-seq analysis of microglia from both APP/PS1:APOE4-KI and APP/PS1:APOE4-cKO mice indicating subclusters of homeostatic microglia and MGnD. Dashed box indicates Clec7a+ MGnD co-expressing Lgals3 (n = 2 mice per group). e, Donut charts showing the percentage of Clec7ahiLgals3hi and Clec7ahiLgals3lo microglia. f, Volcano plot comparing Clec7ahiLgals3hi and Clec7ahiLgals3lo microglia. Differentially expressed genes were identified using FindMarkers Seurat function (P < 0.05). g, Confocal images of CLEC7A, IBA1 and HJ3.4B (plaques) in APP/PS1:APOE3-KI, APP/PS1:APOE3-cKO, APP/PS1:APOE4-KI, and APP/PS1:APOE4-cKO mice. Arrowheads indicate magnified ROI; scale bar, 50 μm. h, Quantification of CLEC7A immunoreactivity per plaque. (n = 55 plaques (APP/PS1:APOE3-KI), n = 73 plaques (APP/PS1:APOE3-cKO) n = 62 plaques (APP/PS1:APOE4-KI), n = 62 plaques (APP/PS1:APOE4-cKO)). i, Confocal images of LGALS3, IBA1 and HJ3.4B; scale bar, 50 μm. j, Quantification of LGALS3 immunoreactivity. (n = 20 plaques (APP/PS1:APOE3-KI), n = 12 plaques (APP/PS1:APOE3-cKO), n = 14 plaques (APP/PS1:APOE4-KI), n = 16 plaques (APP/PS1:APOE4-cKO)). k, Representative images of brain sections from all APOE genotypes stained for HJ3.4B; scale bar, 500 μm (left) and 50 μm (right). l, Quantification of cortical HJ3.4B+ plaque number per ROI (n = 8 APP/PS1:APOE3-KI mice, n = 7 APP/PS1:APOE3-cKO mice, n = 14 APP/PS1:APOE4-KI mice, n = 7 APP/PS1:APOE4-cKO mice. m, Confocal images of LAMP1 and HJ3.4B; scale bar, 50 μm. n, Quantification of LAMP1+ area in cortex (n = 8 APP/PS1:APOE3-KI mice, n = 7 APP/PS1:APOE3-cKO mice, n = 14 APP/PS1:APOE4-KI mice, n = 7 APP/PS1:APOE4-cKO mice). Data were analyzed by one-way ANOVA and are presented as mean ± s.e.m.
Fig. 5
Fig. 5. Targeting microglial APOE4 promotes astrocyte activation and their recruitment towards plaque in APP/PS1 mice.
a, UMAP of scRNA-seq analysis of astrocytes showing clusters 3 and 5. Violin plots of key activation genes (Gfap, Vim and Cd9 representing clusters 3 and 5) are shown on the right. b, Volcano plot of cluster 3. c, Donut charts showing the percentage of GfaphiApoelo and GfaphiApoehi astrocyte clusters. d, Top upregulated canonical pathways in astrocytes from cluster 3 identified using IPA. e, Confocal images of GFAP, IBA1, and human APOE in the cortex of 4-month-old mice. Arrows indicate human APOE immunoreactivity or its loss in GFAP+ and IBA1+ cells. f,g, Quantification of GFAP+ area (f) and APOE+ immunoreactivity in GFAP+ cells associated with plaques (g; n = 51 plaques from APP/PS1:APOE3-KI mice, n = 39 plaques from APP/PS1:APOE3-cKO mice, n = 59 plaques from APP/PS1:APOE4-KI mice, n = 61 plaques from APP/PS1:APOE4-cKO mice). h, Confocal images of Serpina3n, GFAP, and HJ3.4B. i, Quantification of Sepina3n+ immunoreactivity in GFAP+ cells (n = 42 plaques from APP/PS1:APOE3-KI mice, n = 44 plaques from APP/PS1:APOE3-cKO mice, n = 41 plaques from APP/PS1:APOE4-KI mice, n = 30 plaques from APP/PS1:APOE4-cKO mice). j, Schematics of experimental design of adoptive transfer of phagocytic microglia showing the isolation of MGnD from APOE3-KI, APOE4-KI and APOE4-cKO mice and injection to 2 months-old WT recipient mice, followed by isolation of astrocytes from recipient mice 16h later. Figure created with Biorender.com. k, Volcano plot showing differentially expressed genes in astrocytes isolated from WT recipient mice injected with MGnD sorted from APOE4-KI or APOE3-KI mice (n = 3 mice per group, P < 0.05). l, Volcano plot showing differentially expressed genes of astrocytes isolated from WT recipient mice injected with MGnD cells sorted from APOE4-cKO mice or APOE4-KI mice (n = 3 mice per group, P < 0.05). m, IPA of top-affected upstream regulators in WT astrocytes isolated from recipient mice following the injection of APOE4-cKO MGnD versus APOE4-KI MGnD (n = 3 mice per group, P < 0.05). Upstream regulators with a P value of < 0.05 were selected. Data were analyzed by one-way ANOVA and are presented as mean ± s.e.m.; scale bars, 50 μm.
Fig. 6
Fig. 6. Deletion of microglial APOE4 promotes astrocyte activation and their recruitment to plaque via LGALS3 in APP/PS1 and P301S mice.
a, Circos plot illustrating prioritized cross-talk between microglia ligands and astrocyte receptors. b, Heat map of the top 200 differentially expressed genes in astrocytes isolated from APP/PS1 mice injected with PBS, 20 ng and 100 ng of rLGALS3. Differentially expressed genes were identified using DESeq2 analysis with an LRT (n = 3–4 mice per group, P < 0.05). c, Normalized counts of key astrocytic genes isolated from APP/PS1 mice treated with PBS and 100ng rLGALS3 (n = 3 PBS-treated mice, n = 4 rLGALS3-treated mice). d, Confocal images of IBA1, GFAP, and HJ3.4B in APP/PS1 mice treated with PBS and 100ng of rLGALS3; scale bar, 200 μm. e, Quantification of plaque load at the injection site (n = 9 ROIs from PBS-treated mice, n = 8 ROIs from rLGALS3-treated mice). f, Volcano plot showing differentially expressed genes in astrocytes isolated from apoptotic neuron-injected 8-month-old APOE4-cKO mice compared to those isolated from APOE4-KI mice. Differentially expressed genes were identified using DESeq2 analysis with an LRT (n = 4 mice per group, P < 0.05). g, Volcano plot showing differentially expressed genes in astrocytes isolated from 9-month-old P301S:APOE4-cKO mice compared to those isolated from P301S:APOE4-KI mice. Differentially expressed genes were identified using DESeq2 analysis with an LRT (n = 4–7 mice per group, P < 0.05). hj, Circos plots illustrating prioritized ligand-receptor interactions between microglia and astrocytes, comparing phagocytic APOE3-KI versus non-phagocytic APOE3-KI conditions (h), phagocytic APOE4-KI versus APOE3-KI (i) and phagocytic APOE4-cKO versus APOE4-KI (j). Regulatory potential demonstrates directionality of comparison. k, Confocal images of GFAP, HJ3.4B and CLEC7A in APP/PS1:APOE4-KI mice treated with PBS or 100ng of rLGALS3; scale bar, 50 μm. l, Quantification of HJ3.4B, CLEC7A and GFAP (n = 8 ROIs from five mice per group). Data were analyzed by two-tailed Student’s t-test and are presented as mean ± s.e.m.
Fig. 7
Fig. 7. Impaired induction of the MGnD signature and astrocytes activation in individuals with AD that carry the APOE4 allele.
a,b, Volcano plot of bulk RNA-seq analysis of total brain tissue isolated from males (a) and females (b) showing selected differentially expressed genes in individuals that are heterozygous for the APOE3 and APOE4 alleles compared to those that are homozygous for the APOE3 allele (male n = 5–7 donors, female n = 6–7 donors, P < 0.05). c, Top 100 differentially expressed genes from female AD:heterozygous APOE3/APOE4 carriers compared to AD:homozygous APOE3 carriers (P < 0.05, n = 6–7 donors per group). d, Normalized counts of key affected genes (n = 7 AD:homozygous APOE3 carriers, n = 6 AD:heterozygous APOE3/APOE4 carriers). e, Top-affected KEGG pathways in female AD:homozygous APOE3 carriers compared to AD:heterozygous APOE3/APOE4 carriers. f, Confocal microscopy images of brain sections from females with AD that are homozygous for the APOE3 allele or heterozygous for the APOE3 and APOE4 alleles stained for LGALS3, HJ3.4B-plaque and IBA1. g, Quantification of LGALS3+ immunoreactivity (n = 8 AD:homozygous APOE3 carriers, n = 9 AD:heterozygous APOE3/APOE4 carriers). h, Volcano plot of microglial differentially expressed genes in AD:heterozygous APOE3/APOE4 carriers compared to AD:homozygous APOE3 carriers analyzed from dataset by Zhou et al. (n = 6 AD:homozygous APOE3 carriers, n = 4 AD:heterozygous APOE3/APOE4 carriers, P < 0.05). i, Confocal images of brain sections from female individuals with AD homozygous for the APOE3 allele or heterozygous for the APOE3 and APOE4 alleles stained for pSMAD3, IBA1, and HJ3.4B. j, Quantification of pSMAD3 immunoreactivity in IBA1+ cells (n = 27 cells from AD:homozygous APOE3 carriers, n = 33 cells from AD:heterozygous APOE3/APOE4 carriers ). k, Confocal microscopy images of GFAP in the brains of individuals with AD that are homozygous for the APOE3 allele or heterozygous for the APOE3 and APOE4 alleles. l, Quantification of GFAP immunoreactivity per plaque (n = 52 plaques from AD:homozygous APOE3 carriers, n = 43 plaques from AD:heterozygous APOE3/APOE4 carrier). m, Donut plots representing analysis from dataset by Zhou et al., showing the percentage of GFAPhiSERPINA3+ and GFAPhiSERPINA3 astrocyte clusters in AD:heterozygous APOE3/APOE4 carriers and AD:homozygous APOE3 carriers. n, Volcano plot of astrocytic differentially expressed genes of AD:heterozygous APOE3/APOE4 carriers compared to AD:homozygous APOE3 carriers analyzed from the dataset by Zhou et al. (n = 6 AD:homozygous APOE3 carriers, n = 4 AD:heterozygous APOE3/APOE4 carriers, P < 0.05). Arrows indicate ROIs for f and i. Data were analyzed by two-tailed Student’s t-test and are presented as mean ± s.e.m.; scale bars, 50 μm.
Fig. 8
Fig. 8. Blocking ITGB8-TGFβ signaling enhances MGnD response and reduces AD pathology in APP/PS1 mice.
a, Representative images of TMEM119 immunoreactivity in sagittal brains of Itgb8-cKO mice and control littermates. Arrows indicate magnified ROIs. b, Images of CLEC7A, GFAP, and APOE in Itgb8-cKO and control mice. c,d, Quantification of CLEC7A+(c) and GFAP+(d) immunoreactivity in the cortex (n = 12 ROIs per group). e, Heat map of differentially expressed genes for microglia isolated from Itgb8-cKO versus control mice (n = 4–5 mice per group, P < 0.05). f, Top KEGG pathways in Itgb8-cKO microglia versus control microglia. g, Images of pSMAD3, APOE, and IBA1 in Itgb8-cKO and control mice. h, Quantification of pSmad3 immunoreactivity in IBA1+ cells (n = 45 cells in the control group, n = 47 cells in the Itgb8-cKO group). i, Quantification of Apoe immunoreactivity in IBA1+ cells (n = 45 cells in the control group, n = 47 in the Itgb8-cKO group). j, Scatter plot comparing differentially expressed genes in microglia from Itgb8-cKO and Tgfbr2-cKO mice, described by Lund et al. (for Lund et al., n = 3 mice per group; for Itgb8-cKO, n = 4–5 mice per group; P < 0.05, Log2(fold change) of >0.25 or <–0.25). k, Schematics of the administration of neutralizing antibody to ITGB8 or IgG isotype control into the brains of APP/PS1 mice and analysis 3 d later. l, Heat map of microglia isolated from APP/PS1 mice treated with neutralizing antibody to ITGB8 or IgG isotype control and top Gene ontology pathways affected (n = 5 mice per group, P < 0.05). m, Images of HJ3.4B+ plaques at the injection site 14 days after the treatment of APP/PS1 mice with neutralizing antibody to ITGB8 or IgG isotype control. n, Quantification of HJ3.4B+ plaques at the injection sites (n = 8 IgG-treated mice, n = 9 anti-ITGB8-treated mice). o, Images of GFAP+, CLEC7A+, and HJ3.4B+ plaques at the injection site 14 days after the treatment of APP/PS1:APOE4 KI mice with neutralizing antibody to ITGB8 or IgG isotype control. p, Quantification of HJ3.4B+ plaques area and GFAP+ and CLEC7A+ area per ROI at the injection sites (n = 11 ROIs from 6–7 mice per group). Data were analyzed by two-tailed Student’s t-test and are shown as mean ± s.e.m.; scale bars, 2mm for a; 100 μm for b and m; 50 μm for g and o.

References

    1. Jansen IE et al. Genome-wide meta-analysis identifies new loci and functional pathways influencing Alzheimer’s disease risk. Nat Genet 51, 404–413 (2019). - PMC - PubMed
    1. Wightman DP et al. A genome-wide association study with 1,126,563 individuals identifies new risk loci for Alzheimer’s disease. Nat Genet 53, 1276–1282 (2021). - PMC - PubMed
    1. Nott A et al. Brain cell type-specific enhancer-promoter interactome maps and disease-risk association. Science 366, 1134–1139 (2019). - PMC - PubMed
    1. Krasemann S et al. The TREM2-APOE Pathway Drives the Transcriptional Phenotype of Dysfunctional Microglia in Neurodegenerative Diseases. Immunity 47, 566–581 e569 (2017). - PMC - PubMed
    1. Keren-Shaul H et al. A Unique Microglia Type Associated with Restricting Development of Alzheimer’s Disease. Cell 169, 1276–1290 e1217 (2017). - PubMed