. 2023 Oct;29(10):2643-2655.
doi: 10.1038/s41591-023-02553-8. Epub 2023 Sep 25.

Interaction between estrogen receptor-α and PNPLA3 p.I148M variant drives fatty liver disease susceptibility in women

Collaborators, Affiliations

Interaction between estrogen receptor-α and PNPLA3 p.I148M variant drives fatty liver disease susceptibility in women

Alessandro Cherubini et al. Nat Med. 2023 Oct.

Erratum in

Abstract

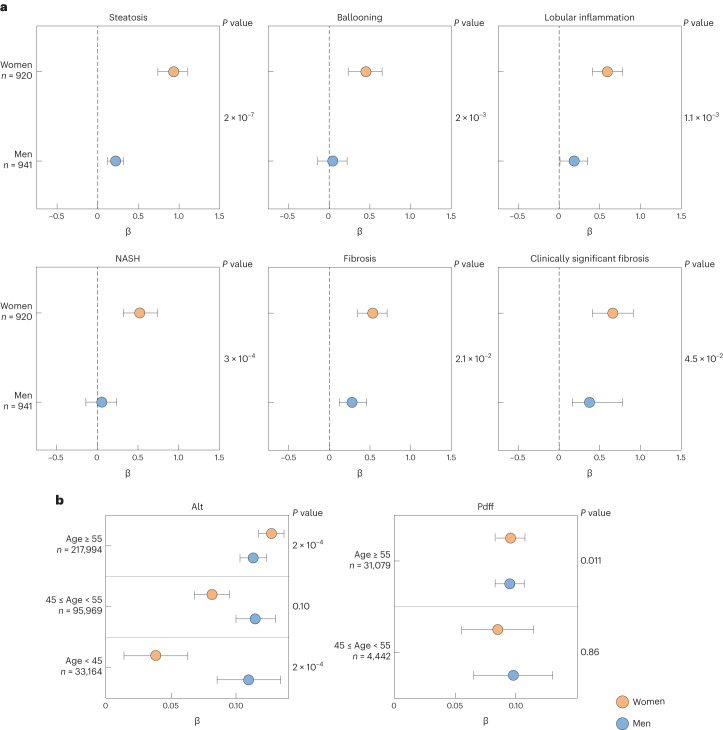
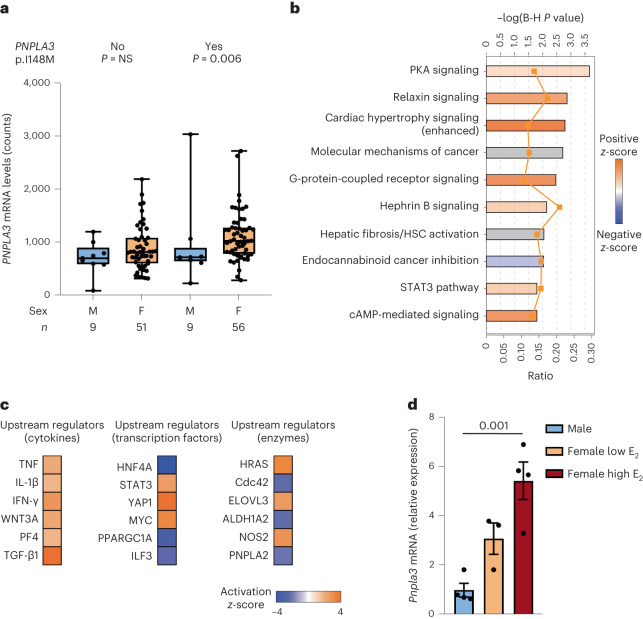
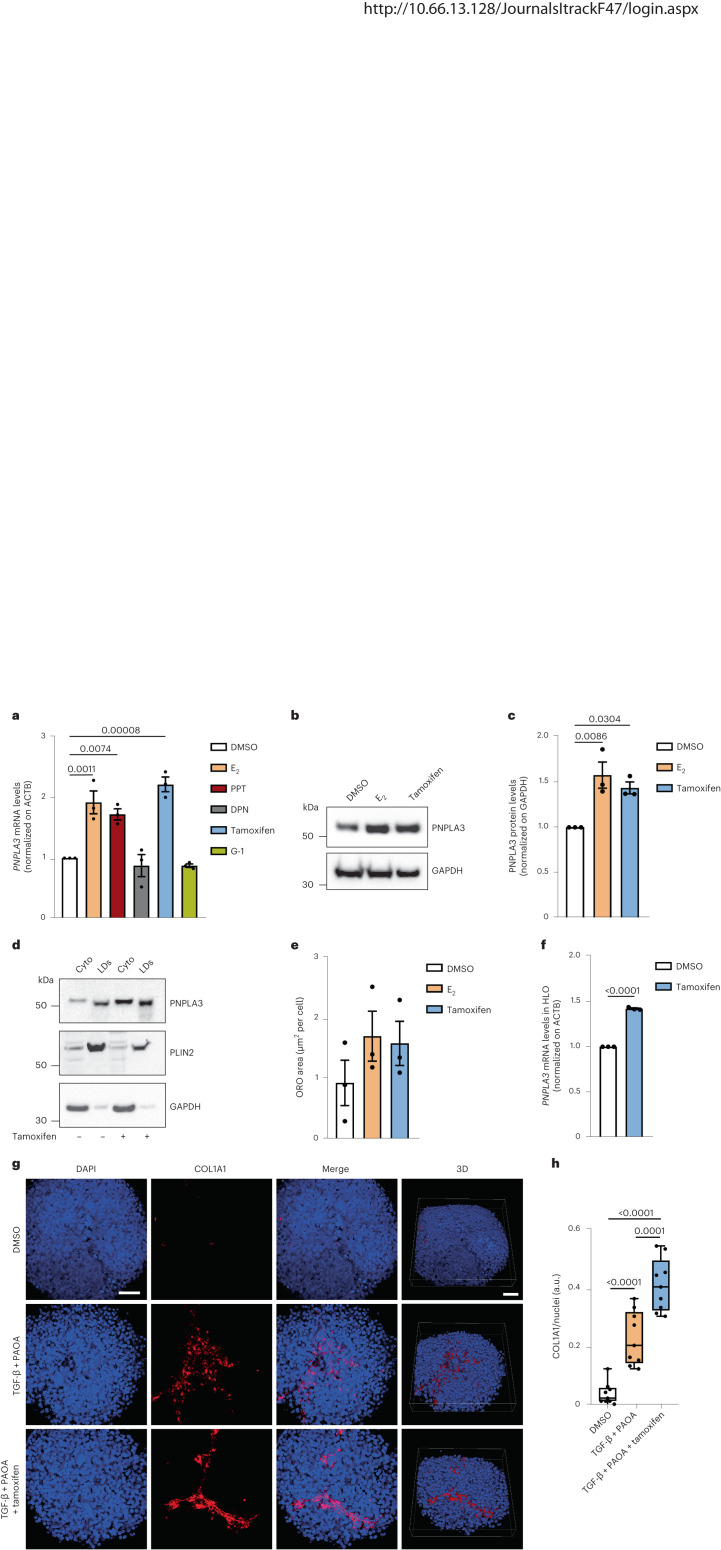
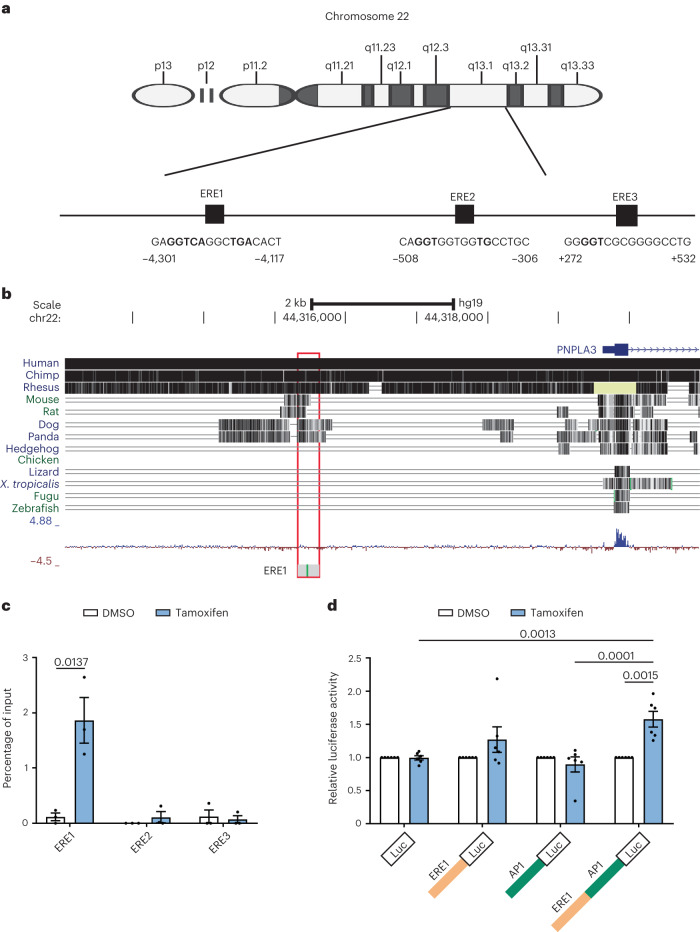
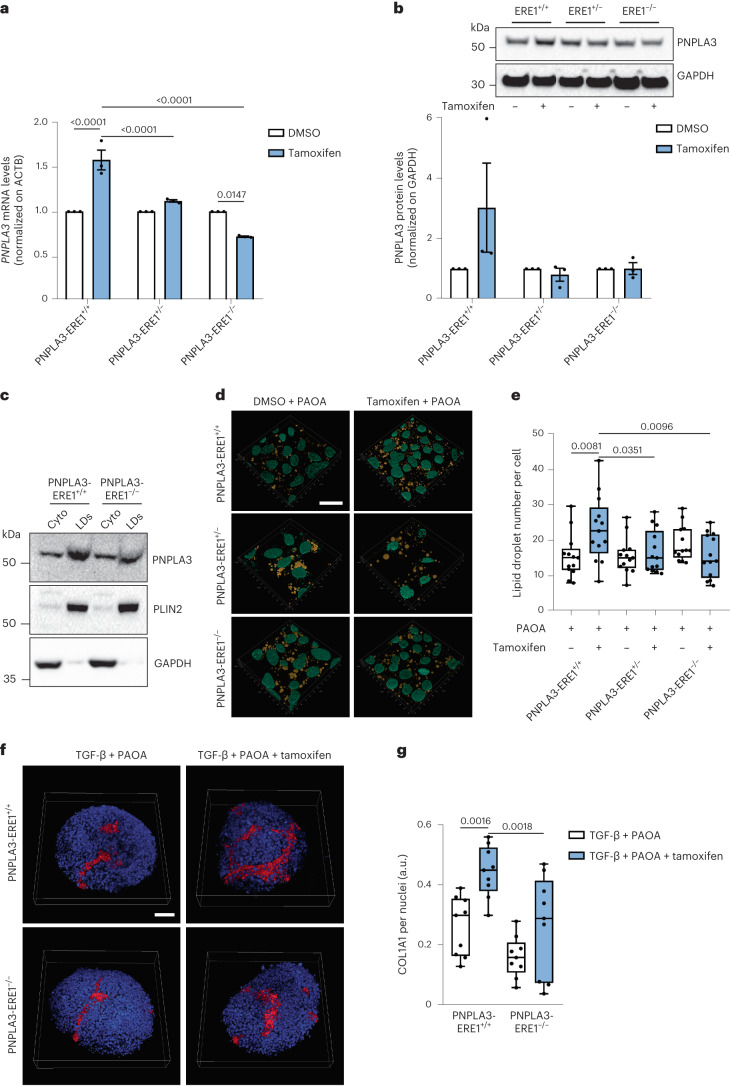
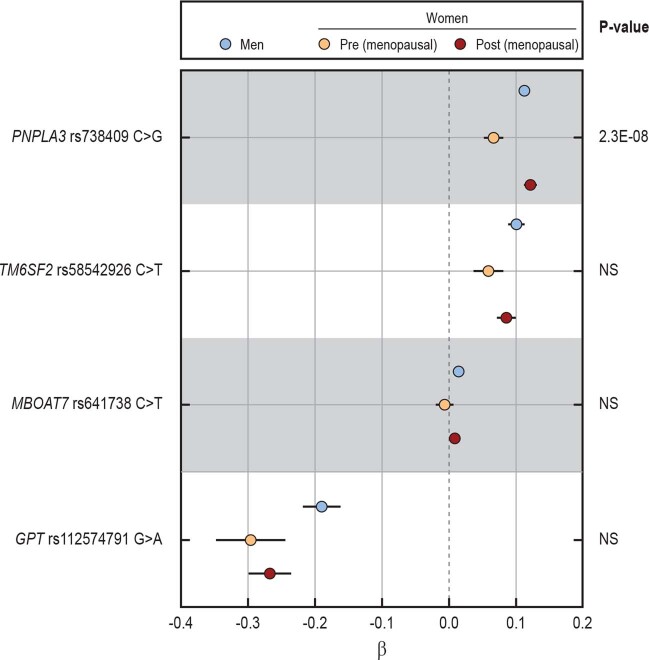
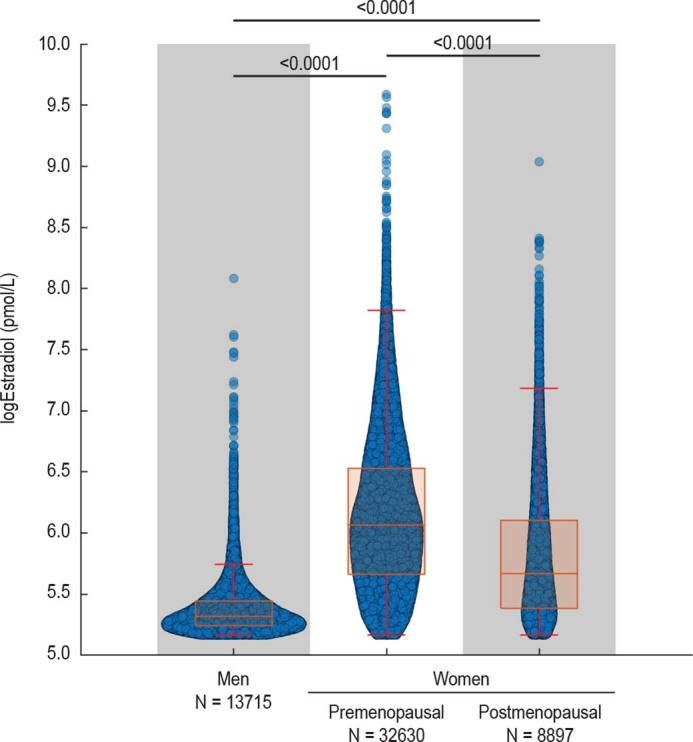
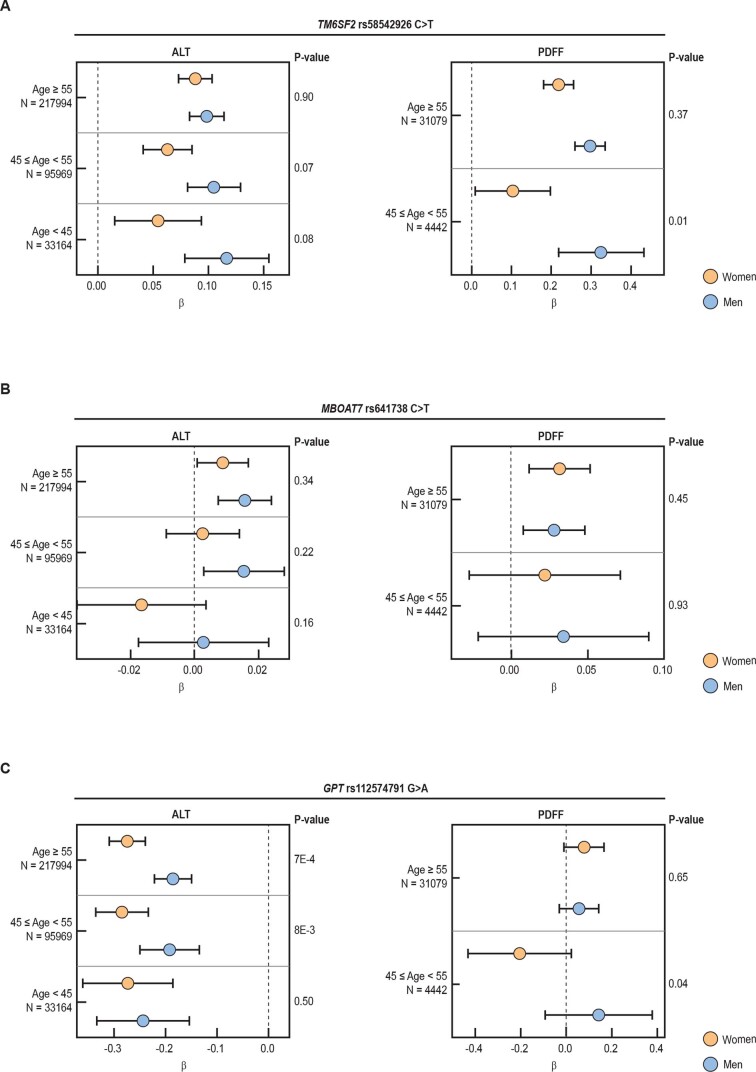
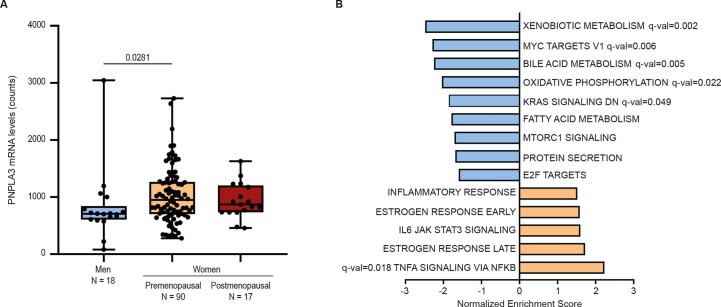
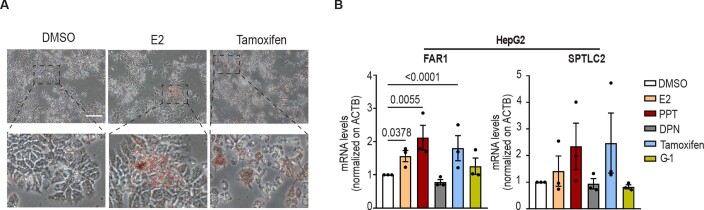
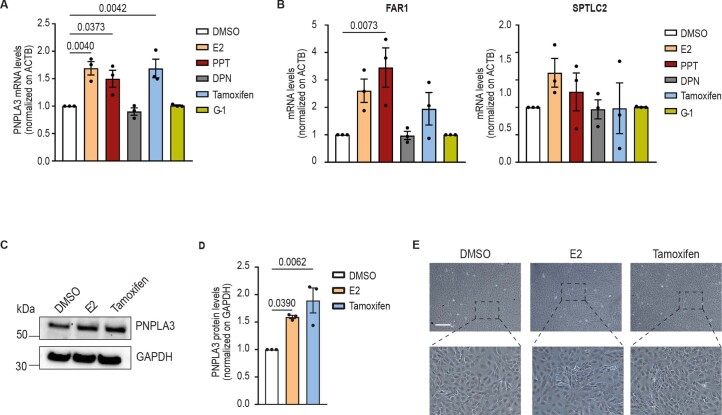
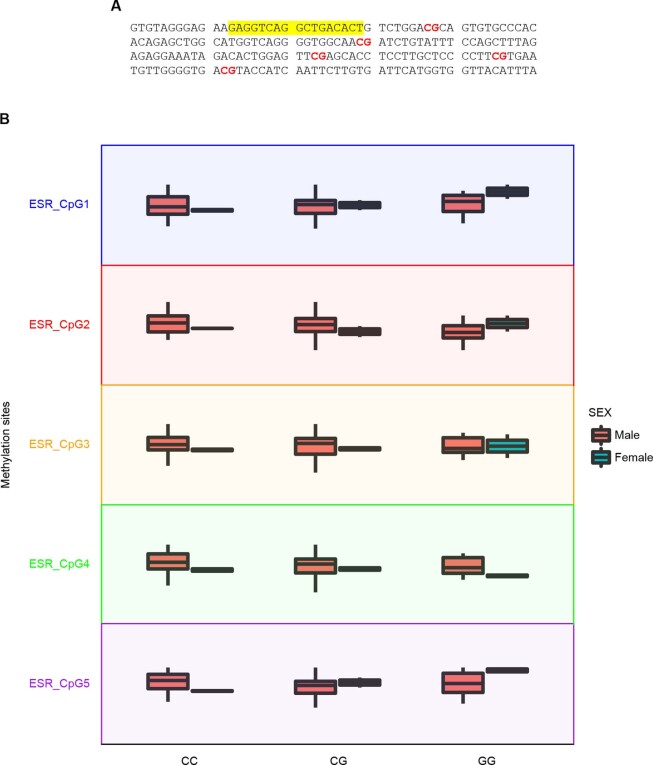
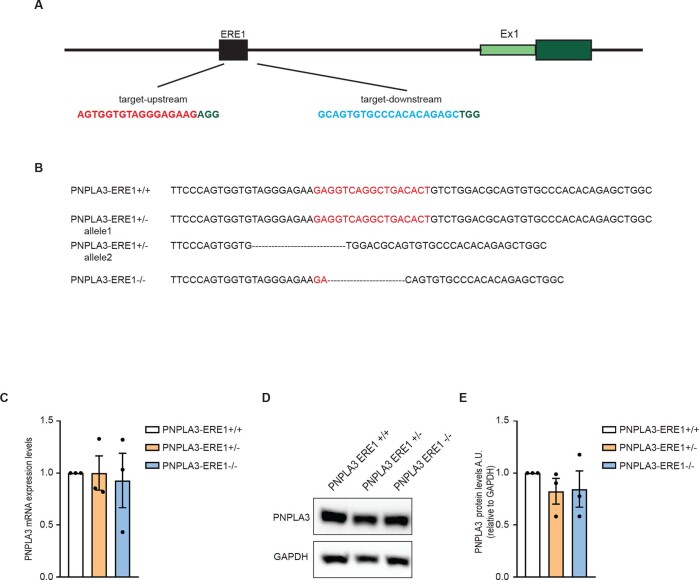
Fatty liver disease (FLD) caused by metabolic dysfunction is the leading cause of liver disease and the prevalence is rising, especially in women. Although during reproductive age women are protected against FLD, for still unknown and understudied reasons some develop rapidly progressive disease at the menopause. The patatin-like phospholipase domain-containing 3 (PNPLA3) p.I148M variant accounts for the largest fraction of inherited FLD variability. In the present study, we show that there is a specific multiplicative interaction between female sex and PNPLA3 p.I148M in determining FLD in at-risk individuals (steatosis and fibrosis, P < 10-10; advanced fibrosis/hepatocellular carcinoma, P = 0.034) and in the general population (P < 10-7 for alanine transaminase levels). In individuals with obesity, hepatic PNPLA3 expression was higher in women than in men (P = 0.007) and in mice correlated with estrogen levels. In human hepatocytes and liver organoids, PNPLA3 was induced by estrogen receptor-α (ER-α) agonists. By chromatin immunoprecipitation and luciferase assays, we identified and characterized an ER-α-binding site within a PNPLA3 enhancer and demonstrated via CRISPR-Cas9 genome editing that this sequence drives PNPLA3 p.I148M upregulation, leading to lipid droplet accumulation and fibrogenesis in three-dimensional multilineage spheroids with stellate cells. These data suggest that a functional interaction between ER-α and PNPLA3 p.I148M variant contributes to FLD in women.


Conflict of interest statement

The authors declare that they have no conflicts of interest relevant to the present study. L.V. has received speaking fees from MSD, Gilead, AlfaSigma and AbbVie, served as a consultant for Gilead, Pfizer, AstraZeneca, Novo Nordisk, Intercept, Diatech Pharmacogenetics, Ionis Pharmaceuticals, Boeringher Ingelheim and Resalis, and received research grants from Gilead. D.P. served as a consultant for, and has received speaking fees, travel grants and research grants from, Macopharma, Ortho Clinical Diagnostics, Grifols, Terumo, Immucor, Diamed and Diatech Pharmacogenetics.

Figures

Fig. 1
Fig. 1. Impact of PNPLA3 p.I148M variant on FLD susceptibility in women and men.
a, Forest plot of association (estimates ± 95% confidence interval (CI)) between PNPLA3 p.I148M variant and histological features of FLD in patients included in the Liver Biopsy Cohort stratified by sex (n = 1,861). b, Forest plot of association (estimates ± 95% CI) between PNPLA3 p.I148M variant with ALT levels and hepatic fat concentration as measured by MRI–PDFF in the UK Biobank cohort (n = 347,127), after further stratification for age (<45 years: premenopausal, 45–55 years: perimenopausal, ≥55 years: postmenopausal). The impact of the variant was estimated using generalized linear regression models, under an additive genetic model for the PNPLA3 variant, and were adjusted for age, BMI, T2D and recruitment modality. P values refer to the PNPLA3 p.I148M × sex interaction term (Table 1).
Fig. 2
Fig. 2. Estrogens regulate hepatic PNPLA3 mRNA expression.
a, Hepatic PNPLA3 expression in patients in the transcriptomic cohort (n = 125 individuals with obesity) stratified by sex and carriage of the PNPLA3 p.I148M variant. In the box and whisker plots, the line in the middle of the box represents the medians, tops and bottoms of the boxes the 25th and 75th quartiles, respectively, and the whiskers the minimum to maximum value. The impact of the variant was estimated using generalized linear regression models adjusted for age and batch. b, IPA of differentially regulated genes in women carrying the PNPLA3 p.I148M variant. Terms are reported with a P < 0.05 after a Benjamini–Hochberg (B-H) correction. PKA, Protein kinase A. c, Predicted activation state of upstream cytokines, transcription factors and enzymes in women carrying the p.I148M variant. d, The mRNA levels of Pnpla3 from RNA-seq analysis performed in the livers of male and female mice at low and high levels of E2. Data are presented as mean ± s.e.m. (n = 4 independent male and female high E2 mice; n = 3 independent female low E2 mice). One-way ANOVA was followed by Bonferroni’s post hoc test. Source data
Fig. 3
Fig. 3. Effect of estrogen-induced PNPLA3 expression on lipid droplet accumulation in human hepatocytes.
a, RT-qPCR analysis of PNPLA3 mRNA level in the human HepG2 cell line treated for 48 h with E2 (1 μM), PPT (1 μM), DPN (1 μM), tamoxifen (10 μM), G-1 (1 μM) and dimethyl sulfoxide (DMSO) as a negative control. b,c, Western blot analysis of PNPLA3 protein levels in HepG2 cells treated with E2 or tamoxifen and DMSO as a negative control (glyceraldehyde 3-phosphate dehydrogenase (GAPDH) used as loading control run on a different gel) (b) and relative quantification (c). d, Western blot analysis of PNPLA3, PLIN2 and GAPDH proteins in cytosolic and lipid droplet fractions obtained from cells treated for 48 h with fatty acids (oleic and palmitic acids, both at 250 μM) and tamoxifen or DMSO as a negative control. e, RT-qPCR analysis of PNPLA3 mRNA level in HLOs treated for 48 h with tamoxifen (10 μM) and DMSO as a negative control. f, Relative quantification of ORO staining for visualization of intracellular neutral lipids of HepG2 treated for 48 h with E2 (1 μM), tamoxifen (10 μM) and DMSO as a negative control. g, Immunofluorescence staining of DAPI (blue) and COL1A1 (red) of 3D spheroids (HepG2:LX-2, 24:1) treated for 48 h with a mix of palmitic and oleic acids (PAOA, 250 μM each), TGF-β (10 ng ml−1) and tamoxifen (10 μM) or DMSO as a negative control. Scale bar, 50 μm. h, Quantification of COL1A1 levels by ImageJ normalized to DAPI quantification. a.u., arbitrary units. Whiskers show minimum to maximum values, box bounds the 25th to 75th percentiles and the center the median value. Data in a, c and e are presented as mean ± s.e.m. (n = 3 independent experiments). One-way ANOVA followed by Bonferroni’s post hoc test were used. Data in f are represented as mean ± s.e.m. (n = 3 independent experiments). A two-sided, unpaired Student’s t-test was used. Data in h are mean ± s.e.m. (n = 9 from 3 independent experiments). A one-way ANOVA was followed by Bonferroni’s post hoc test. Source data
Fig. 4
Fig. 4. Prediction and identification of ER-α-binding sites at the promoter region of the PNPLA3 gene.
a, Representation of EREs located at the TSS and promoter region of the PNPLA3 gene. The coordinates are based on the GRCh37/hg19 build (National Center for Biotechnology Information (NCBI) reference sequence NC_000022.10). b, PNPLA3-ERE1 showing a high degree of conservation across other mammal genomes. The coordinates are based on the GRCh37/hg19 build (NCBI reference sequence NC_000022.10). c, ChIP in HepG2 treated for 24 h with tamoxifen (10 μM) or DMSO as a negative control. The levels of ER-α at the ERE1, ERE2 and ERE3 of the PNPLA3 gene were measured by RT-qPCR. Data are presented as mean ± s.e.m. (n = 3 independent experiments). The unpaired Student’s t-test was used. d, Luciferase (Luc) reporter activity analysis measuring the impact of tamoxifen on the transcriptional regulation of the PNPLA3 putative enhancer region. The sequence containing both ERE1 and AP-1 sequences or ERE1 and AP-1 alone was cloned above the luciferase construct. Data in c are mean ± s.e.m. (n = 3 independent experiments). A two-sided, unpaired Student’s t-test was used. Data in d are mean ± s.e.m. (n = 6 independent experiments). A two-way ANOVA was used followed by Bonferroni’s multiple-comparison test. Source data
Fig. 5
Fig. 5. PNPLA-ER1 deletion hampers ER-α-mediated lipid droplet accumulation in HepG2 hepatocytes.
a, RT-qPCR analysis of PNPLA3 mRNA levels in HepG2 PNPLA3-ERE1+/+, PNPLA3-ERE1+/− and PNPLA3-ERE1−/− cells treated for 48 h with tamoxifen (10 μM) or DMSO as a negative control. b, Western blot analysis of PNPLA3 protein levels in HepG2 PNPLA3-ERE1+/+, PNPLA3-ERE1+/− and PNPLA3-ERE1−/− cells treated for 48 h with tamoxifen (10 μM) or DMSO as a negative control. (GAPDH used as a loading control was run on a different gel.) c, Western blot analysis of PNPLA3, PLIN2 and GAPDH proteins in cytosolic and lipid droplet fractions obtained from cells treated for 48 h with fatty acids (palmitic and oleic acids, both at 250 μM) and tamoxifen or DMSO as a negative control. d, Immunofluorescence staining with DAPI (cyan) and lipid droplets stained with Nile Red (yellow) of HepG2, PNPLA3-ERE1+/− and PNPLA3-ERE1−/− cells treated for 48 h with a mix of palmitic and oleic acids (250 μM each) and tamoxifen (10 μM) or DMSO as a negative control. Scale bar, 20 μm. e, Quantification of lipid droplet number by ImageJ normalized to nuclei number. Whiskers show minimum to maximum values, box bounds the 25th to 75th percentiles and the center the median value. f, Immunofluorescence staining of DAPI (blue) and COL1A1 (red) of 3D spheroids (HepG2/LX-2, 24:1) treated for 48 h with a mix of palmitic and oleic acids (250 μM each), TGF-β (10 ng ml−l) and tamoxifen (10 μM) or DMSO as a negative control. Scale bar, 50 μm. g, Quantification of COL1A1 levels by ImageJ normalized to DAPI quantification. Whiskers show minimum to maximum values, box bounds the 25th to 75th percentiles and the center the median value. Data in a and b are mean ± s.e.m. (n = 3 independent experiments). In e the data are mean ± s.e.m. (n = 12 images from 3 independent experiments). In g the data are mean ± s.e.m. (n = 9 images from 3 independent experiments). A two-way ANOVA was used followed by Bonferroni’s post hoc test. Source data
Extended Data Fig. 1
Extended Data Fig. 1. Comparison of the impact of PNPLA3 with other risk variants on ALT levels in UKBB Cohort stratified by sex and menopause.
Forest plot of association (estimates ± 95% c.i.) between PNPLA3 p.I148M, TM6SF2 p.E167K, MBOAT7-TMC4 rs641738 C > G and GPT p.R107K variants with sex on ALT levels in individuals in UKBB Cohort (n = 347,127) stratified by sex and menopause status. The impact of the variant was estimated by ordinal, logistic or generalized linear regression models, where appropriate under an additive genetic model for the different genetic variants, and were adjusted for age, BMI, T2D and recruitment modality. The impact of the variant was estimated by generalized linear regression models, under an additive genetic model for the PNPLA3 variant, and were adjusted for age, BMI, T2D and recruitment modality.
Extended Data Fig. 2
Extended Data Fig. 2. Impact of sex and menopause status on estradiol levels in UKBB Cohort.
Violin plot showing estradiol levels in individuals in UKBB Cohort stratified by sex and menopause status. In the box and whisker plots, the line in the middle of the box represents the medians, tops and bottoms of the boxes represent the 25th and 75th quartiles respectively, and the whiskers showed the 5th and 95th percentile. The impact of sex and/or menopause status was estimated by unadjusted generalized linear regression models.
Extended Data Fig. 3
Extended Data Fig. 3. Impact of other genetic risk variants on ALT levels and hepatic fat in UKBB Cohort stratified for sex and age.
Forest plot of association (estimates ± 95% c.i.) between TM6SF2 p.E167K (Panel A), MBOAT7 rs641738 (Panel B) and GPT p.R107K (Panel C) variants with sex on ALT and hepatic fat (MRI-PDFF) levels in individuals in UKBB Cohort (n = 347,127) after stratification for age (<45: pre-menopausal, 45-55: perimenopausal, ≥55 post-menopausal). The impact of the genetic variants was estimated by generalized linear regression models, under an additive genetic model, and were adjusted for age, BMI, T2D and recruitment modality. Source data
Extended Data Fig. 4
Extended Data Fig. 4. Additional information on PNPLA3 expression according to age and sex and PNPLA3 targetpathways in women from the Transcriptomic cohort.
a) Hepatic PNPLA3 expression in patients in the Transcriptomic cohort stratified by sex and menopause status. In the box and whisker plots, the line in the middle of the box represents the medians, tops and bottoms of the boxes represent the 25th and 75th quartiles respectively, and the whiskers showed the 5th and 95th percentile; Kruskal-Wallis followed by Dunn’s post hoc test. b) Gene set enrichment analysis (GSEA) of pathways enriched in genes differentially expressed in women carrying PNPLA3 p.I148M variant; are considered only the terms with a p < 0.05. Source data
Extended Data Fig. 5
Extended Data Fig. 5. Impact of ERα agonists on intracellular lipids and lipotoxicity in HepG2 human hepatocytes.
A) Representative images of Oil Red O (ORO) staining for visualization of intracellular neutral lipids of HepG2 treated for 48 h with E2 (1 μM), tamoxifen (10 μM) and DMSO as negative control. Scale bar, 200 μM. B) qRT-PCR analysis of FAR1 and SPTLC2 mRNA level in human HepG2 cell line treated for 24 h with E2 (1 μM), PPT (1 μM), DPN (1 μM), tamoxifen (10 μM), G-1 (1 μM) and DMSO as negative control. Data in panels B are presented as mean ± SEM (n = 3 independent experiments); one-way ANOVA followed by Bonferroni’s post hoc test. Source data
Extended Data Fig. 6
Extended Data Fig. 6. Impact of ERα agonists on PNPLA3 expression, intracellular lipids and lipotoxicity in HepaRG human hepatocytes.
A) qRT-PCR analysis of PNPLA3 mRNA level in human HepaRG cell line treated for 24 h with E2 (1 μM), PPT (1 μM), DPN (1 μM), tamoxifen (10 μM), G-1 (1 μM) and DMSO as negative control. B) qRT-PCR analysis of FAR1 and SPTLC2 mRNA level in human HepaRG cell line treated for 24 h with E2 (1 μM), PPT (1 μM), DPN (1 μM), tamoxifen (10 μM), G-1 (1 μM) and DMSO as negative control. C) Western blot analysis of PNPLA3 protein levels in HepG2 cells treated with E2 or tamoxifen and DMSO as negative control and D) relative quantification. E) Representative images of Oil Red O (ORO) staining for visualization of intracellular neutral lipids of HepaRG treated for 48 h with E2 (1 μM), tamoxifen (10 μM) and DMSO as negative control. Scale bar, 200 μM. Data in panel A, B and D are presented as mean ± SEM (n = 3 independent experiments); one-way ANOVA followed by Bonferroni’s post hoc test. Source data
Extended Data Fig. 7
Extended Data Fig. 7. PNPLA3-ERE1 cfDNA methylation.
Impact of sex and carriage of PNPLA3 p.I148M variant on cfDNA methylation status of five different CpGs across the PNPLA3-ERE1 region in 90 participants of the Liver-Bible-2022 cohort. A) Schematic representation of CpG sites located immediately downstream of ERE1 (CpG1 at +24 bp, CpG2 at +66 bp, CpG3 at +110 bp, CpG4 at + 132 bp and CpG5 at + 149 bp). The ERE1 are underlined and CpGs in red. The region is chromosome 22: 44315438-44315637 (GRCh37/hg19 genome assembly). B) Boxplots showing CpG methylation ratio for each CpG in man (n = 85) and women (n = 6) stratified for PNPLA3 p.I148M genotype. In the box and whisker plots, the line in the middle of the box represents the medians, tops and bottoms of the boxes represent the 25th and 75th quartiles respectively, and the whiskers showed the 5th and 95th percentile. The impact of the PNPLA3 p.I148M variant on methylation was determined by generalized linear model (GLM), adjusted for sex. p=not significant for all comparisons. The impact of the variant was estimated by unadjusted generalized linear regression models, under an additive genetic model for the PNPLA3 variant.
Extended Data Fig. 8
Extended Data Fig. 8. Generation of PNPLA3-ERE1 knock-out HepG2 hepatocytes.
a) Schematic representation of PNPLA3 gene promoter and sgRNA used to delete PNPLA3-ERE1 elements. b) Schematic representation of PNPLA3-ERE1 sequence and sanger sequencing results confirming the deletion of ER1 in heterozygosity and homozygosity. c) PNPLA3 expression level in PNPLA3-ERE1+/+, PNPLA3-ERE1+/− and PNPLA3-ERE1−/− HepG2 hepatocytes. d) PNPLA3 Western blot and e) relative quantification in PNPLA3-ERE1+/+, PNPLA3-ERE1+/− and PNPLA3-ERE1−/− HepG2 hepatocytes. Data in panel C and D are presented as mean ± SEM (n = 3 independent experiments).

Similar articles

Cited by

References

    1. Byrne CD, Targher G. NAFLD: a multisystem disease. J. Hepatol. 2015;62:S47–S64. doi: 10.1016/j.jhep.2014.12.012. - DOI - PubMed
    1. Younossi ZM, et al. Global epidemiology of nonalcoholic fatty liver disease-meta-analytic assessment of prevalence, incidence, and outcomes. Hepatology. 2016;64:73–84. doi: 10.1002/hep.28431. - DOI - PubMed
    1. Eslam M, Sanyal AJ, George J, International Consensus Panel. MAFLD: a consensus-driven proposed nomenclature for metabolic associated fatty liver disease. Gastroenterology. 2020;158:1999–2014.e1. doi: 10.1053/j.gastro.2019.11.312. - DOI - PubMed
    1. Kleiner DE, et al. Design and validation of a histological scoring system for nonalcoholic fatty liver disease. Hepatology. 2005;41:1313–1321. doi: 10.1002/hep.20701. - DOI - PubMed
    1. Arrese M, et al. Insights into nonalcoholic fatty-liver disease heterogeneity. Semin. Liver Dis. 2021;41:421–434. doi: 10.1055/s-0041-1730927. - DOI - PMC - PubMed

Publication types