. 2023 Oct;4(10):874-885.
doi: 10.1038/s43016-023-00844-4. Epub 2023 Sep 25.

Fishing for subsistence constitutes a livelihood safety net for populations dependent on aquatic foods around the world

Affiliations

Fishing for subsistence constitutes a livelihood safety net for populations dependent on aquatic foods around the world

John Virdin et al. Nat Food. 2023 Oct.

Abstract

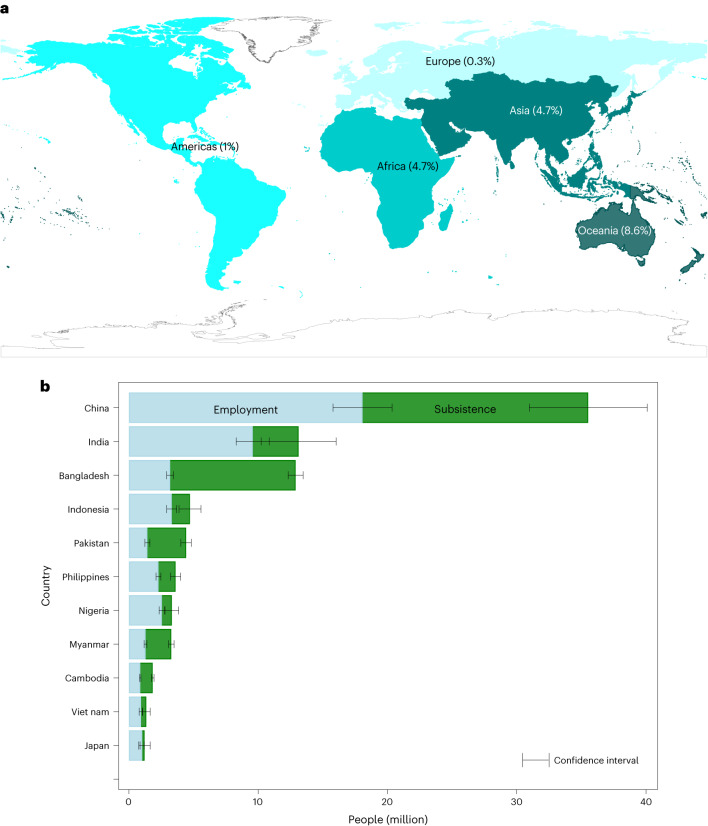
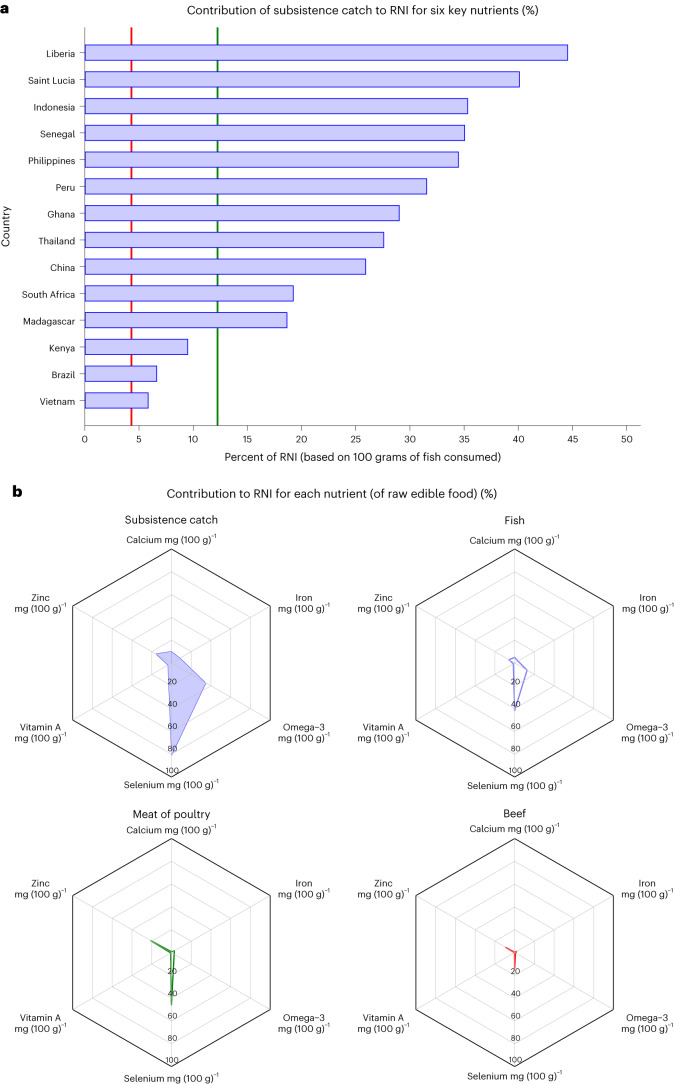
Fishing for subsistence constitutes a livelihood safety net for poverty, malnutrition and gender inequality for populations dependent upon aquatic foods around the world. Here we provide global estimates showing that almost the same amount of small-scale fishers engage in subsistence fishing at some point during the year as in commercial employment and use subsistence estimates to measure small-scale fisheries' livelihood safety net function. In 2016, we estimate that 52.8 million people were engaged in subsistence fishing at some point during the year, while another 60.2 million people were commercially employed (90% of global fisheries employment). From 14 country case studies, it was possible to estimate that the subsistence catch provided an average apparent intake of six nutrients critical for positive health outcomes, equivalent to 26% of the recommended daily nutrient intake for 112.5 million people, higher than the national average contribution of beef or poultry.


Conflict of interest statement

The authors declare no competing interests.

Figures

Fig. 1
Fig. 1. Geographic distribution of small-scale fisheries workersʼ employment and subsistence fishing activity for 2016.
a, Distribution of people engaged in small-scale fisheries employment and subsistence fishing activity as a proportion of total employment, by region. b, Ten countries with the most small-scale fisheries employment and those engaged in subsistence fishing activity. Data are presented as mean values ± (1.96 × (standard error of the mean)) (N = 186). Data extrapolated from household-based surveys for 78 countries. Credit: basemap in b, UNGIS, UNGSC, Field Missions (https://www.un.org/geospatial). Source data
Fig. 2
Fig. 2. Estimated participation in fisheries employment and subsistence activity by gender and region for 2016.
The red vertical line captures the share of small-scale fisheries (SSF) employment in total employment in fisheries. Table 1 provides 95% confidence intervals. Data extrapolated from household-based surveys for 78 countries. LSF, large-scale fisheries. Source data
Fig. 3
Fig. 3. Global distribution of subsistence activity within small-scale fisheries for 2016 and countries with ‘very high’ or ‘high’ vulnerability scores from the World Risk Index for 2021.
a, Correlation between the ratio of subsistence fish workers in a country and the country’s vulnerability score on the World Risk Index. Dots are scaled to overall size of fishery engagement in each country. b, Distribution of concentrations of subsistence fish workers in the harvesting segment of small-scale fisheries. c, Degree of national vulnerability to climate according to the World Risk Index. Data for subsistence fish workers and persons employed in harvesting SSF extrapolated from household-based surveys for 78 countries (see Source Data Fig. 3 for full names of abbreviated countries). Credit: basemaps in b,c, UNGIS, UNGSC, Field Missions (https://www.un.org/geospatial). Source data
Fig. 4
Fig. 4. Share of the population engaging in subsistence fishing activity, by main economic sector and labour force status based on data from seven countries.
These examples cover different years based on data availability from household-based surveys: Kiribati, 2015; Lao PDR, 2017; Senegal, 2012; Cambodia, 2013; South Africa, 2017; Bangladesh 2013; Myanmar, 2019. Persons engaged in subsistence fishing activity were classified according to their economic sector of employment and labour force status (Methods provide more detail). Source data
Fig. 5
Fig. 5. Average contribution of marine and inland subsistence catches to the daily RNI for six nutrients in 14 country case studies.
a, Mean of six nutrients, calculated by averaging the percent contribution to the RNI of the six nutrients presented in b. The vertical lines represent the average percent contribution of the six nutrients to the RNI across the entire population of the same 14 countries for: (1) beef (red line) and (2) poultry (green line). b, Average contribution of marine and inland subsistence catches to the daily RNI for six nutrients across the 14 countries analysed (Brazil, China, Ghana, Indonesia, Kenya, Liberia, Madagascar, Peru, Philippines, Saint Lucia, Senegal, South Africa, Thailand and Vietnam), as derived from the nutrient values of all species that form the aggregate volume of subsistence catch in each country, as compared to the average contribution from total small-scale fisheries catch (fish), meat and poultry to the national population in the same 14 countries. Note that the percentage nutrient composition of the subsistence catch and total small-scale fisheries catch is similar; these only appear different in b because they are distributed over different population sizes (subsistence fish catch being smaller). The portion size for fish, beef and poultry (that is, apparent per capita consumption) was derived by considering the total population in the 14 countries under study. In contrast, the portion size for subsistence catch was determined solely based on the population engaged in subsistence fishing. Across these 14 countries, the estimated average apparent per capita consumption of subsistence catch is 74.4 grams per day. The apparent per capita consumption of fish, poultry and beef is estimated at 35.7, 51.5 and 15.5 grams, respectively. Source data

References

    1. Bennett A, et al. Recognize fish as food in policy discourse and development funding. Ambio. 2021;50:981–989. doi: 10.1007/s13280-020-01451-4. - DOI - PMC - PubMed
    1. Cooley, S. et al. in: Climate Change 2022: Impacts, Adaptation and Vulnerability (eds Pörtner, H.-O. et al.) (Cambridge Univ. Press, 2022).
    1. Smith H, Basurto X. Defining small-scale fisheries and examining the role of science in shaping perceptions of who and what counts: A systematic review. Front. Mar. Sci. 2019;6:236. doi: 10.3389/fmars.2019.00236. - DOI
    1. Béné C, Hersoug B, Allison EH. Not by rent alone: analyzing the pro-poor functions of small-scale fisheries in developing countries. Dev. Policy Rev. 2010;28:325–358. doi: 10.1111/j.1467-7679.2010.00486.x. - DOI
    1. Béné, C. Small-scale Fisheries: Assessing Their Contribution to Rural Livelihoods in Developing Countries. FAO Fisheries Circular No. 1008 (FAO, 2006).

Grants and funding