

Objective detection of visual field defects with multifrequency VEPs
- PMID: 37749441
- PMCID: PMC10879258
- DOI: 10.1007/s10633-023-09949-4
Objective detection of visual field defects with multifrequency VEPs
Abstract
Purpose: To correlate multifrequency pattern reversal VEPs in quadrants (QmfrVEPs) with perimetric field losses for objective detection of visual field losses.
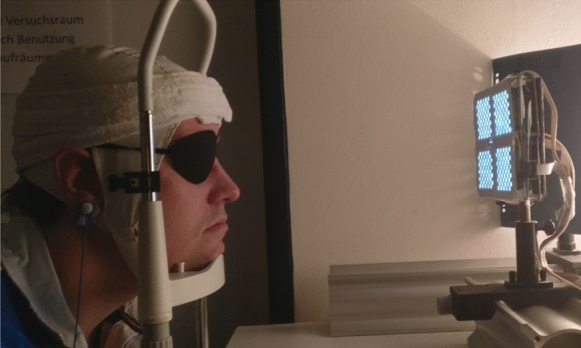
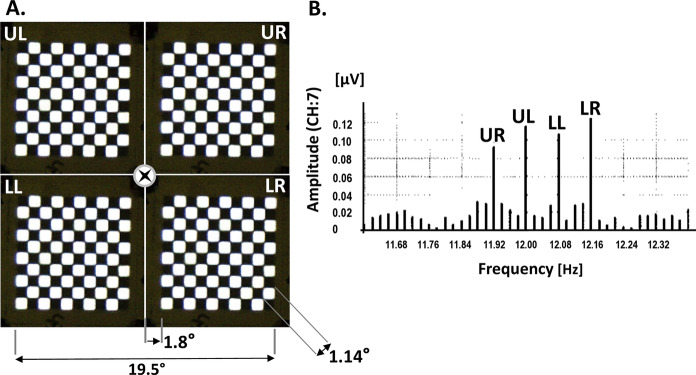
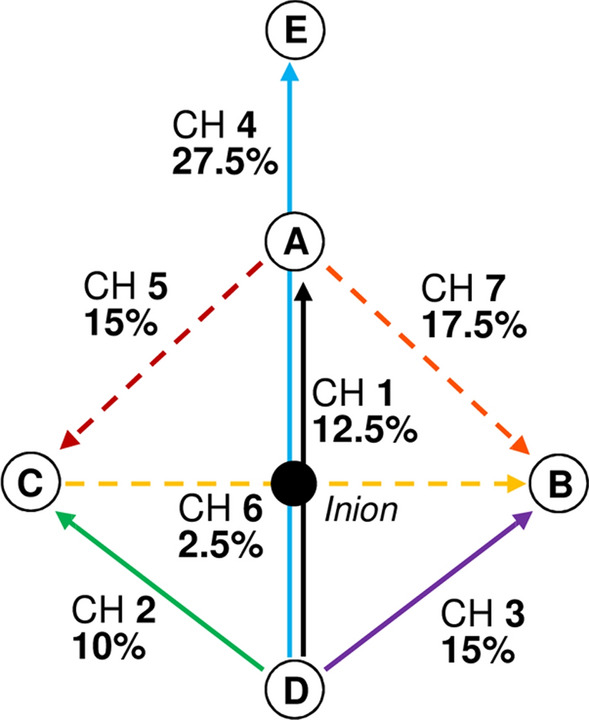
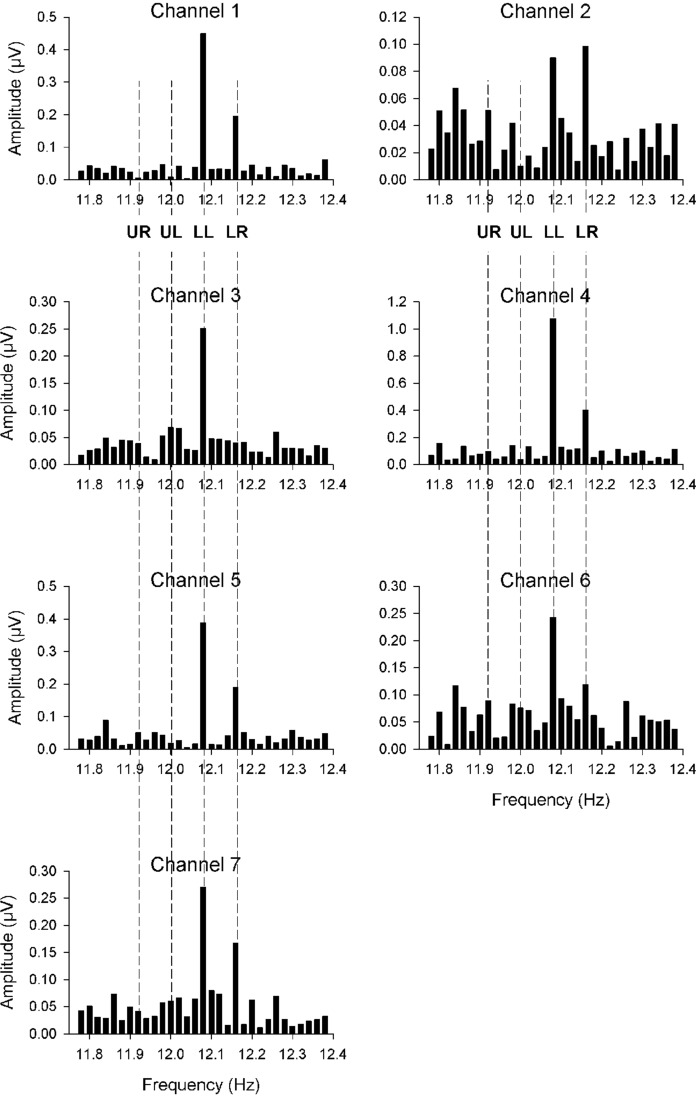
Methods: QmfrVEP measurements were performed using four LED-based checkerboard stimulators to stimulate the four quadrants of the visual field. QmfrVEPs were measured monocularly in 5 normal subjects and in 5 glaucoma patients who showed losses in conventional Octopus perimetry. The pattern reversal frequency varied slightly between the stimulators: (11.92, 12.00, 12.08 and 12.16 reversals/sec). The responses to the different stimuli were identified by discrete Fourier analysis. VEPs were recorded using different electrode configurations, and the recording with the highest signal-to-noise ratio (SNR) was used for further analysis.
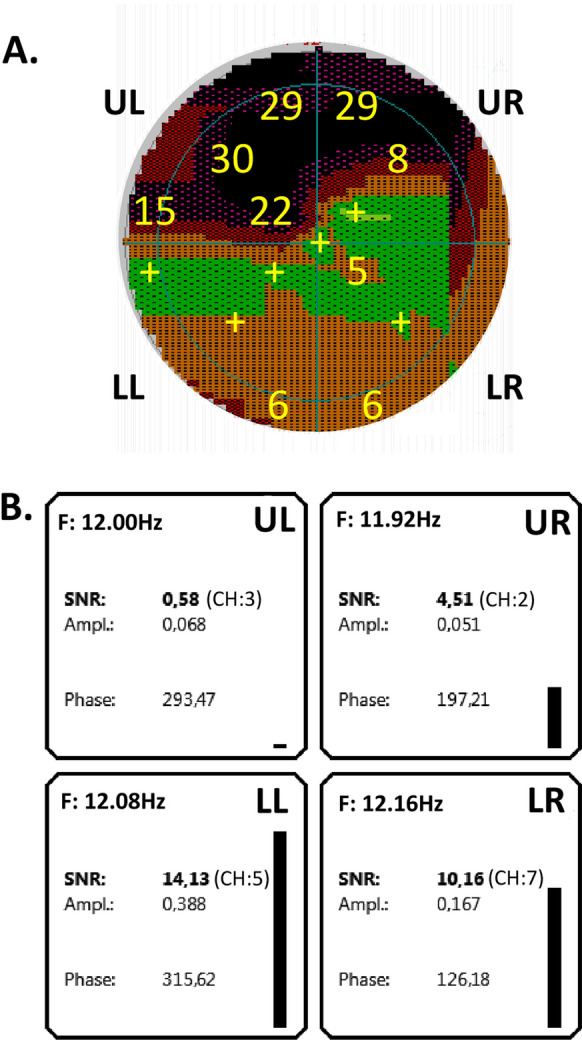
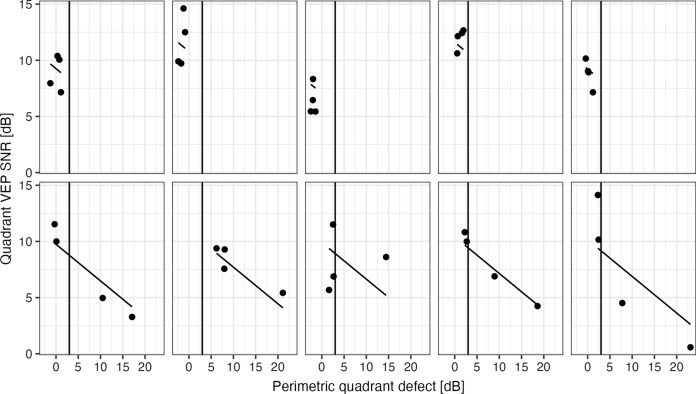
Results: QmfrVEP responses from the different quadrants can be reliably measured and separated using the 0.08 reversals/sec interstimulus reversal frequency differences. The signal-to-noise ratio in the four quadrants was significantly correlated with the equivalent visual field losses obtained with perimetry (Spearman rank correlation: P < 0.001). In the five glaucoma patients, the SNR was reduced in 15 out of the 16 quadrants with a perimetric defect, in comparison to the results in quadrants of healthy subjects. This confirms the sensitivity of the procedure.
Conclusion: QmfrVEP responses can be measured reliably. This pilot study suggests that high SNR values exclude visual field defects and that focal defects can be identified in glaucoma patients.
Trial registration: www.
Clinicaltrials: gov . NCT00494923.
Keywords: Objective visual field test; Pattern reversal; Quadrant multifrequency VEP; Signal-to-noise ratio; Steady state.
© 2023. The Author(s).
Conflict of interest statement
The authors declare that they have no conflicts of interest. The authors have no commercial interest in the equipment used in this work.
Figures
Similar articles
-
Steady-State Visually Evoked Potentials Elicited by Multifrequency Pattern-Reversal Stimulation.Transl Vis Sci Technol. 2019 Feb 28;8(1):24. doi: 10.1167/tvst.8.1.24. eCollection 2019. Transl Vis Sci Technol. 2019. PMID: 30834172 Free PMC article.
-
Objective perimetry using a four-channel multifocal VEP system: correlation with conventional perimetry and thickness of the retinal nerve fibre layer.Br J Ophthalmol. 2012 Apr;96(4):554-9. doi: 10.1136/bjophthalmol-2011-300844. Epub 2011 Nov 24. Br J Ophthalmol. 2012. PMID: 22116959 Clinical Trial.
-
Objective perimetry in glaucoma.Ophthalmology. 2000 Dec;107(12):2283-99. doi: 10.1016/s0161-6420(00)00367-5. Ophthalmology. 2000. PMID: 11097611
-
Multifocal VEP and ganglion cell damage: applications and limitations for the study of glaucoma.Prog Retin Eye Res. 2003 Mar;22(2):201-51. doi: 10.1016/s1350-9462(02)00061-7. Prog Retin Eye Res. 2003. PMID: 12604058 Review.
-
The diagnostic significance of the multifocal pattern visual evoked potential in glaucoma.Curr Opin Ophthalmol. 1999 Apr;10(2):140-6. doi: 10.1097/00055735-199904000-00011. Curr Opin Ophthalmol. 1999. PMID: 10537765 Review.
References
MeSH terms
Associated data
LinkOut - more resources
Full Text Sources
Medical
