Phylogeography and ecological niche modeling implicate multiple microrefugia of Swertia tetraptera during quaternary glaciations
- PMID: 37749488
- PMCID: PMC10521563
- DOI: 10.1186/s12870-023-04471-w
Phylogeography and ecological niche modeling implicate multiple microrefugia of Swertia tetraptera during quaternary glaciations
Abstract
Background: Climate fluctuations during the Pleistocene and mountain uplift are vital driving forces affecting geographic distribution. Here, we ask how an annual plant responded to the Pleistocene glacial cycles.
Methods: In this study, we analyzed the population demographic history of the annual herb Swertia tetraptera Maxim (Gentianaceae) endemic to Qinghai-Tibetan Plateau (QTP). A total of 301 individuals from 35 populations of S. tetraptera were analyzed based on two maternally inherited chloroplast fragments (trnL-trnF and trnS-trnG). Phylogeographic analysis was combined with species distribution modeling to detect the genetic variations in S. tetraptera.
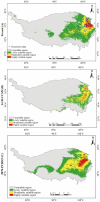
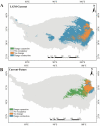
Results: The genetic diversity of S. tetraptera was high, likely due to its wide natural range, high proportion of endemic haplotypes and evolutionary history. Fifty-four haplotypes were identified in S. tetraptera. Only a few haplotypes were widespread (Hap_4, Hap_1, Hap_3), which were dispersed throughout the present geographical range of S. tetraptera, while many haplotypes were confined to single populations. The cpDNA dataset showed that phylogeographic structuring was lacking across the distribution range of S. tetraptera. Analyses of molecular variance showed that most genetic variation was found within populations (70.51%). In addition, the relationships of the haplotypes were almost completely unresolved by phylogenetic reconstruction. Both mismatch distribution analysis and neutrality tests showed a recent expansion across the distribution range of S. tetraptera. The MaxEnt analysis showed that S. tetraptera had a narrow distribution range during the Last Glacial Maximum (LGM) and a wide distribution range during the current time, with predictions into the future showing the distribution range of S. tetraptera expanding.
Conclusion: Our study implies that the current geographic and genetic distribution of S. tetraptera is likely to have been shaped by Quaternary periods. Multiple microrefugia of S. tetraptera existed during Quaternary glaciations. Rapid intraspecific diversification and hybridization and/or introgression may have played a vital role in shaping the current distribution patterns of S. tetraptera. The distribution range of S. tetraptera appeared to have experienced contraction during the LGM; in the future, when the global climate becomes warmer with rising carbon dioxide levels, the distribution of S. tetraptera will expand.
Keywords: Haplotypes; Phylogeographic structure; Qinghai-Tibetan Plateau; Quaternary glaciations; Refugia; Swertia tetraptera; cpDNA trnS-trnG.
© 2023. BioMed Central Ltd., part of Springer Nature.
Conflict of interest statement
The authors declare no competing interests.
Figures


Similar articles
-
Phylogeographic structure of Hippophae tibetana (Elaeagnaceae) highlights the highest microrefugia and the rapid uplift of the Qinghai-Tibetan Plateau.Mol Ecol. 2010 Jul;19(14):2964-79. doi: 10.1111/j.1365-294X.2010.04729.x. Epub 2010 Jun 25. Mol Ecol. 2010. PMID: 20584145
-
Rapid Intraspecific Diversification of the Alpine Species Saxifraga sinomontana (Saxifragaceae) in the Qinghai-Tibetan Plateau and Himalayas.Front Genet. 2018 Sep 18;9:381. doi: 10.3389/fgene.2018.00381. eCollection 2018. Front Genet. 2018. PMID: 30279701 Free PMC article.
-
Genetic differentiation and historical dynamics of the endemic species Rheum pumilum on the Qinghai-Tibetan Plateau inferred from phylogeography implications.BMC Plant Biol. 2025 Feb 7;25(1):162. doi: 10.1186/s12870-025-06164-y. BMC Plant Biol. 2025. PMID: 39915721 Free PMC article.
-
Phylogeography reveals the complex impact of the Last Glacial Maximum on New Zealand's terrestrial biota.J R Soc N Z. 2022 May 26;54(1):8-29. doi: 10.1080/03036758.2022.2079682. eCollection 2024. J R Soc N Z. 2022. PMID: 39439472 Free PMC article. Review.
-
Common patterns in the molecular phylogeography of western palearctic birds: a comprehensive review.J Ornithol. 2021;162(4):937-959. doi: 10.1007/s10336-021-01893-x. Epub 2021 May 13. J Ornithol. 2021. PMID: 34007780 Free PMC article. Review.
References
-
- Zhang YL, Li B, Zheng D. A discussion on the boundary and area of the Tibetan Plateau in China. Geogr Res. 2002;21:1–10.
-
- Zheng D, Yao TD. Progress in research on formation and evolution of Tibetan Plateau with its envir onment and resource effects. Chin Basic Sci. 2004;2:15–21.
-
- Huang W, Ji H. Discovery of Hipparion of fauna in Xizang. Chin Sci Bull. 1979;24:885–5.
-
- Spicer RA, Harris NBW, Widdowson M, et al. Constant elevation of southern Tibet over the past 15 million years. Nature. 2003;421:622–4. - PubMed
-
- Myers N, Mittermeier RA, da Mittermeier CG. Fonseca GAB& Kent J. Biodiversity hotspots for conservation priorities. Nature. 2000;403:853–8. - PubMed
MeSH terms
Grants and funding
LinkOut - more resources
Full Text Sources

