

Milk thistle nano-micelle formulation promotes cell cycle arrest and apoptosis in hepatocellular carcinoma cells through modulating miR-155-3p /SOCS2 /PHLDA1 signaling axis
- PMID: 37749575
- PMCID: PMC10521506
- DOI: 10.1186/s12906-023-04168-5
Milk thistle nano-micelle formulation promotes cell cycle arrest and apoptosis in hepatocellular carcinoma cells through modulating miR-155-3p /SOCS2 /PHLDA1 signaling axis
Abstract
Background: Hepatocellular Carcinoma (HCC) is a prevalent form of liver cancer that causes significant mortality in numerous individuals worldwide. This study compared the effects of milk thistle (MT) and nano-milk thistle (N-MT) on the expression of the genes that participate in apoptosis and cell cycle pathways in Huh-7 and HepG2 cells.
Methods: IC50 values of MT and N-MT were determined using the MTT assay. Huh-7 and HepG2 cell lines (containing mutant and wild-type TP53 gene, respectively) were incubated with MT and N-MT for 24h and 48h and the impact of MT and N-MT on the proliferation of these cell lines was evaluated through a comparative analysis. Cell cycle and apoptosis were assessed by flow cytometry after 24h and 48h treatment in the cell lines mentioned. Real-time PCR was used to analyze miR-155-3p, PHLDA1, SOCS2, TP53, P21, BAX, and BCL-2 expression in the cell lines that were being treated.
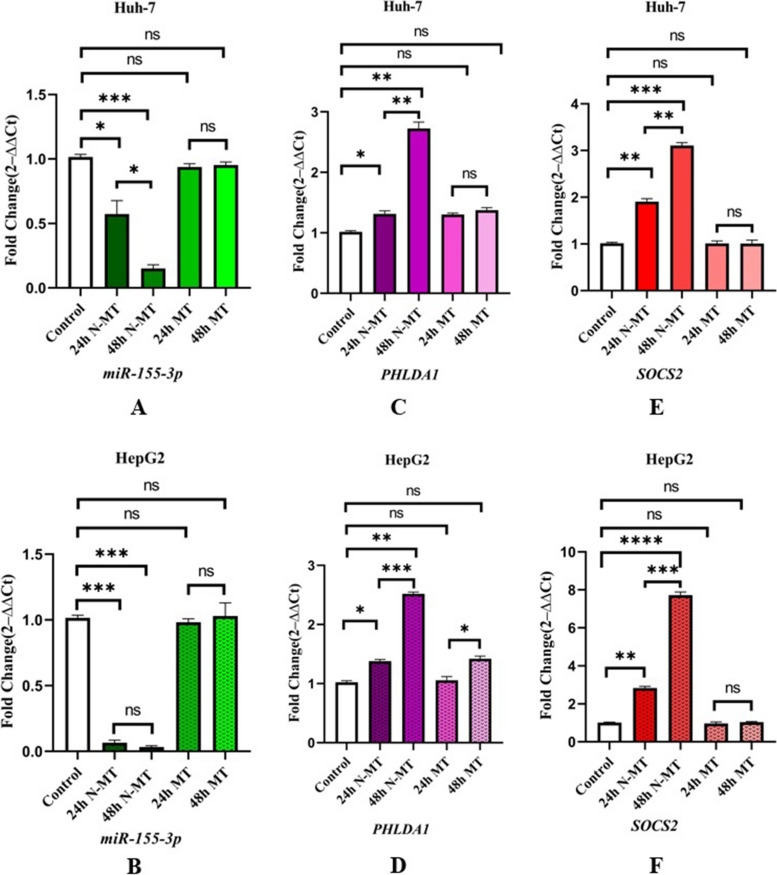
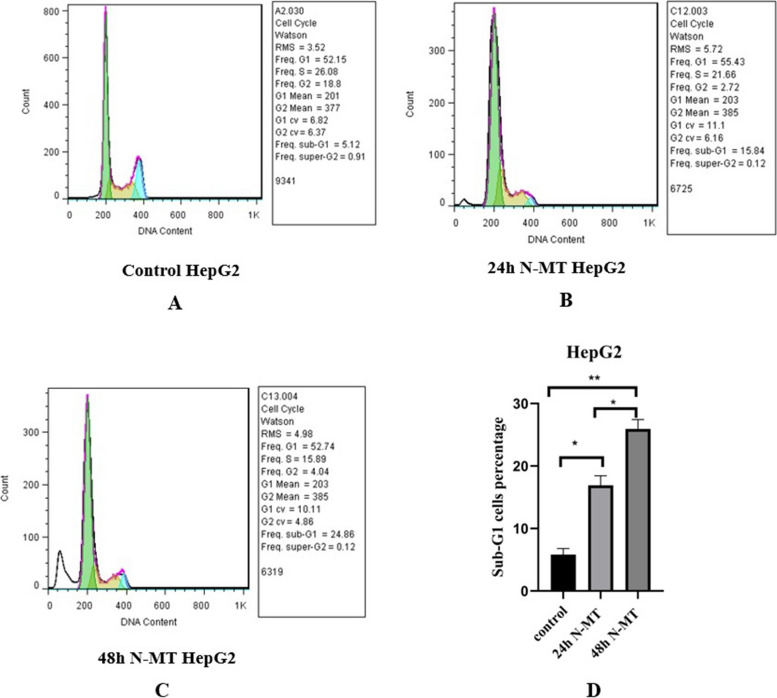
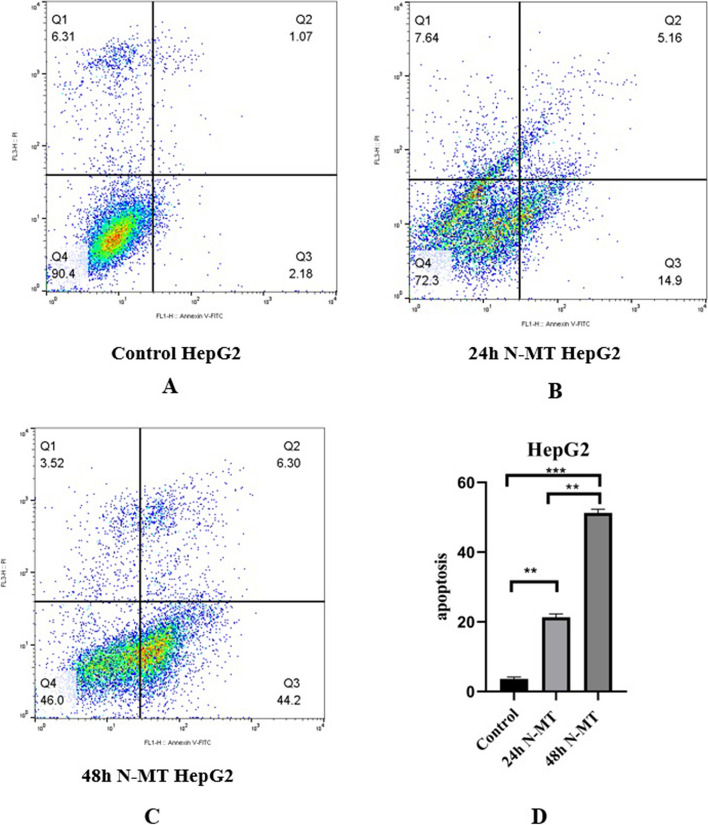
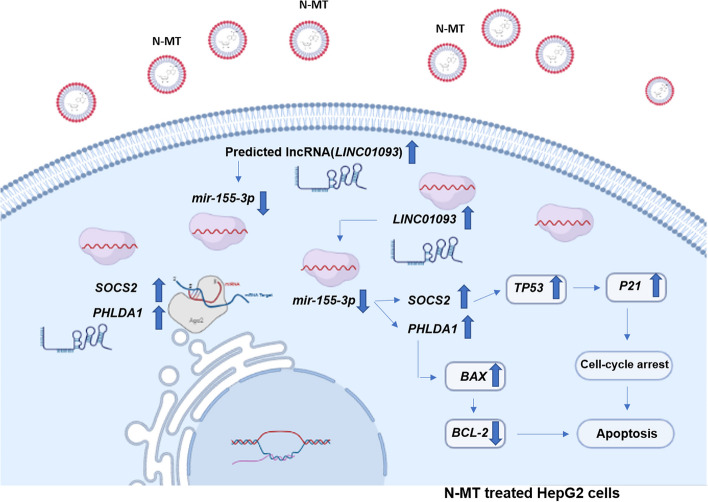
Results: N-MT reduces cancer cell growth in a time and concentration-dependent manner, which is more toxic compared to MT. Huh-7 was observed to have IC50 values of 2.35 and 1.7 μg/ml at 24h and 48h, and HepG2 was observed to have IC50 values of 3.4 and 2.6 μg/ml at 24 and 48h, respectively. N-MT arrested Huh-7 and HepG2 cells in the Sub-G1 phase and induced apoptosis. N-MT led to a marked reduction in the expression of miR-155-3p and BCL-2 after 24h and 48h treatments. Conversely, PHLDA1, SOCS2, BAX, and P21 were upregulated in the treated cells compared to untreated cells, which suggests that milk thistle has the potential to regulate these genes. N-MT reduced the expression of TP53 in Huh-7 cells after mentioned time points, while there was a significant increase in the expression of the TP53 gene in HepG2 cells. No gene expression changes were observed in MT-treated cells after 24h and 48h.
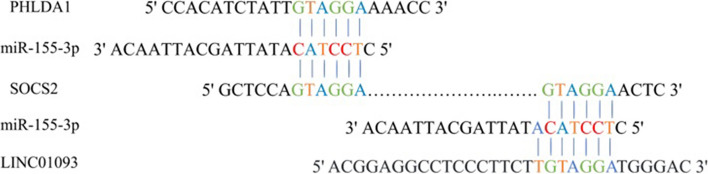
Conclusion: N-MT can regulate cancer cell death by arresting cell cycle and inducing apoptosis. This occurs through the alteration of apoptotic genes expression. A reduction in the expression of miR-155-3p and increase in the expression of SOCS2 and PHLDA1 after N-MT treatment showed the correlation between miR-155-3p and PHLDA1/SOCS2 found in bioinformatics analysis. While N-MT increased TP53 expression in HepG2, reduced it in Huh-7. The findings indicate that N-MT can function intelligently in cancer cells and can be a helpful complement to cancer treatment.
Keywords: Apoptosis; Cell cycle arrest; Nano-milk thistle; Noncoding RNA.
© 2023. BioMed Central Ltd., part of Springer Nature.
Conflict of interest statement
The authors declare no competing interests.
Figures


Similar articles
-
Expanding on roles of pleckstrin homology-like domain family A member 1 protein.Cell Tissue Res. 2025 Jan;399(1):9-25. doi: 10.1007/s00441-024-03942-2. Epub 2024 Dec 4. Cell Tissue Res. 2025. PMID: 39630301 Free PMC article. Review.
-
Midazolam inhibits proliferation and accelerates apoptosis of hepatocellular carcinoma cells by elevating microRNA-124-3p and suppressing PIM-1.IUBMB Life. 2020 Mar;72(3):452-464. doi: 10.1002/iub.2171. Epub 2019 Oct 25. IUBMB Life. 2020. PMID: 31651086
-
Down-regulation of EVA1A by miR-103a-3p promotes hepatocellular carcinoma cells proliferation and migration.Cell Mol Biol Lett. 2022 Oct 22;27(1):93. doi: 10.1186/s11658-022-00388-8. Cell Mol Biol Lett. 2022. PMID: 36273122 Free PMC article.
-
A novel all-trans retinoic acid derivative 4-amino‑2‑trifluoromethyl-phenyl retinate inhibits the proliferation of human hepatocellular carcinoma HepG2 cells by inducing G0/G1 cell cycle arrest and apoptosis via upregulation of p53 and ASPP1 and downregulation of iASPP.Oncol Rep. 2016 Jul;36(1):333-41. doi: 10.3892/or.2016.4795. Epub 2016 May 9. Oncol Rep. 2016. PMID: 27177208
-
Milk Thistle.2020 Jan 21. LiverTox: Clinical and Research Information on Drug-Induced Liver Injury [Internet]. Bethesda (MD): National Institute of Diabetes and Digestive and Kidney Diseases; 2012–. 2020 Jan 21. LiverTox: Clinical and Research Information on Drug-Induced Liver Injury [Internet]. Bethesda (MD): National Institute of Diabetes and Digestive and Kidney Diseases; 2012–. PMID: 31644124 Free Books & Documents. Review.
Cited by
-
Expanding on roles of pleckstrin homology-like domain family A member 1 protein.Cell Tissue Res. 2025 Jan;399(1):9-25. doi: 10.1007/s00441-024-03942-2. Epub 2024 Dec 4. Cell Tissue Res. 2025. PMID: 39630301 Free PMC article. Review.
-
Synergistic effect of curcumin and tamoxifen loaded in pH-responsive gemini surfactant nanoparticles on breast cancer cells.BMC Complement Med Ther. 2024 Sep 20;24(1):337. doi: 10.1186/s12906-024-04631-x. BMC Complement Med Ther. 2024. PMID: 39304876 Free PMC article.
-
A review of the botany, phytochemistry, pharmacology, synthetic biology and comprehensive utilization of Silybum marianum.Front Pharmacol. 2024 Jul 11;15:1417655. doi: 10.3389/fphar.2024.1417655. eCollection 2024. Front Pharmacol. 2024. PMID: 39055491 Free PMC article. Review.
References
-
- Llovet J, Zucman-Rossi J, Pikarsky E, Sangro B, Schwartz M, Sherman M, et al. Hepatocellular carcinoma. Nature reviews Disease primers. 2016; 2: 16018. Epub 2016/05/10. PubMed PMID: 27158749. 10.1038/nrdp; 2016. - PubMed
MeSH terms
Substances
LinkOut - more resources
Full Text Sources
Medical
Research Materials
Miscellaneous
