. 2023 Aug 31;32(4):285-301.
doi: 10.5607/en23015.

Gallic Acid Ameliorates Cognitive Impairment Caused by Sleep Deprivation through Antioxidant Effect

Affiliations

Gallic Acid Ameliorates Cognitive Impairment Caused by Sleep Deprivation through Antioxidant Effect

Xiaogang Pang et al. Exp Neurobiol. .

Abstract

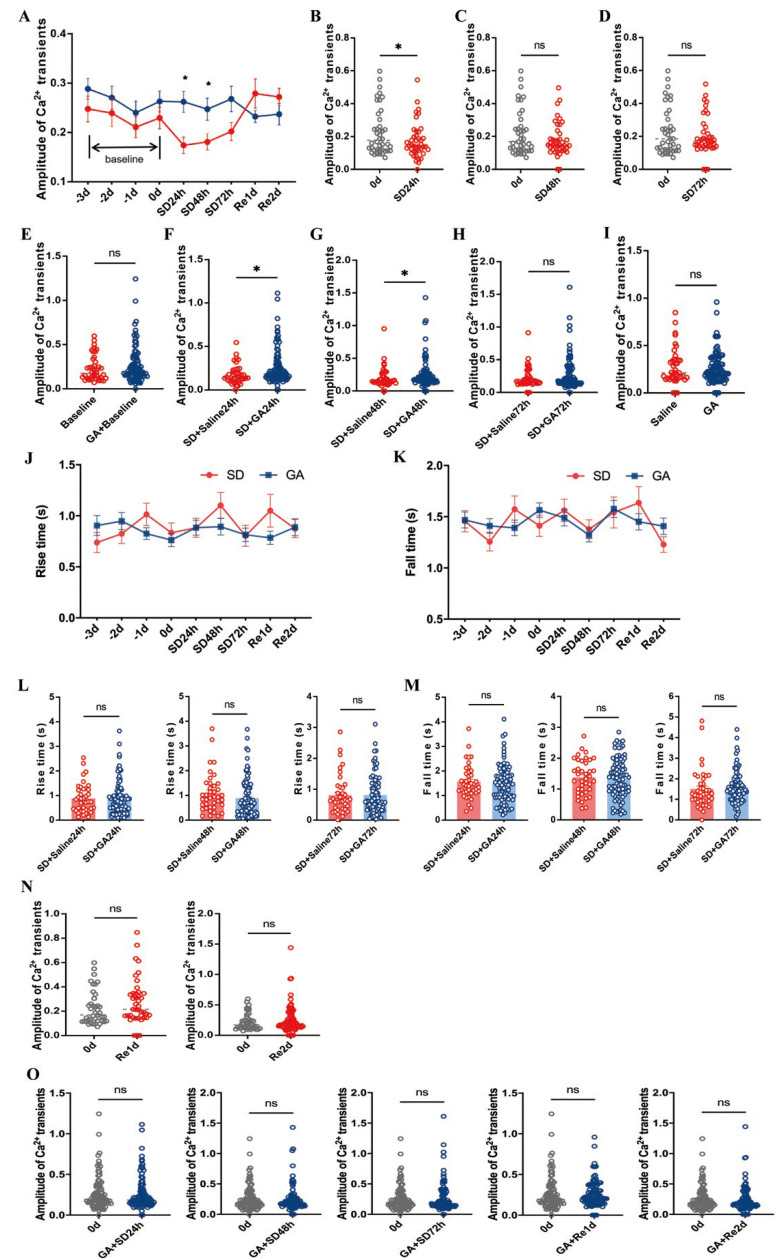
Sleep deprivation (SD) has a profound impact on the central nervous system, resulting in an array of mood disorders, including depression and anxiety. Despite this, the dynamic alterations in neuronal activity during sleep deprivation have not been extensively investigated. While some researchers propose that sleep deprivation diminishes neuronal activity, thereby leading to depression. Others argue that short-term sleep deprivation enhances neuronal activity and dendritic spine density, potentially yielding antidepressant effects. In this study, a two-photon microscope was utilized to examine the calcium transients of anterior cingulate cortex (ACC) neurons in awake SD mice in vivo at 24-hour intervals. It was observed that SD reduced the frequency and amplitude of Ca2+ transients while increasing the proportions of inactive neurons. Following the cessation of sleep deprivation, neuronal calcium transients demonstrated a gradual recovery. Moreover, whole-cell patch-clamp recordings revealed a significant decrease in the frequency of spontaneous excitatory post-synaptic current (sEPSC) after SD. The investigation also assessed several oxidative stress parameters, finding that sleep deprivation substantially elevated the level of malondialdehyde (MDA), while simultaneously decreasing the expression of Nuclear Factor erythroid 2-Related Factor 2 (Nrf2) and activities of Superoxide dismutase (SOD) in the ACC. Importantly, the administration of gallic acid (GA) notably mitigated the decline of calcium transients in ACC neurons. GA was also shown to alleviate oxidative stress in the brain and improve cognitive impairment caused by sleep deprivation. These findings indicate that the calcium transients of ACC neurons experience a continuous decline during sleep deprivation, a process that is reversible. GA may serve as a potential candidate agent for the prevention and treatment of cognitive impairment induced by sleep deprivation.

Keywords: ACC; Gallic acid; Oxidative stress; Sleep deprivation.


Conflict of interest statement

CONFLICT OF INTEREST

The authors declare that they have no competing interests.

Figures

Fig. 1
Fig. 1
Gallic acid (GA) improved spatial learning and memory deficits in sleep-deprived mice. (A) Time line of the experiment. Blue line, time period of GA; Red line indicates sleep deprivation for 72 h. (B) Percentage of distance in the Y-maze novel arm. Control vs. SD+Saline, p<0.001; SD+Saline vs. SD+GA, p<0.001. (C) Time in the Y-maze novel arm. Control vs. SD+Saline, p=0.032; SD+Saline vs. SD+GA, p=0.027. (D) Summary of spontaneous alternations in the Y-maze. Control vs. SD+Saline, p=0.529; SD vs. SD+GA, p>0.05. (E) The mean velocity in the Y-maze. Control vs. SD+Saline, p>0.05; SD+Saline vs. SD+GA, p>0.05. All data are shown as mean±SEM., *p<0.05, ***p<0.01, ns, not significant, one-way ANOVA with Tukey’s test. Control mice, n=14; SD+Saline mice, n=17; SD+GA mice, n=14.
Fig. 2
Fig. 2
GCaMP6f performance in the mouse anterior cingulate cortex (ACC). (A) Time line of the experiment. Green arrow, virus injection time; Blue line, time period of GA; Red line, sleep deprivation for 72 h; Green line indicates two-photon imaging time course. (B) Cartoon of virus injection sites. (C) Representative micrograph showing the site of GCaMP6f injection into ACC. (D) Schematic of two-photon imaging process. (E) Layer 2/3 cortical neurons imaged in vivo and activity maps. The neurons in the red dot are examples. (F) The spontaneous Ca2+ transients of neurons in (E) maps (scale bar, 10 um).
Fig. 3
Fig. 3
GA limited the decrease of Ca2+ transients’ frequency and the underactive neurons fractions at SD stage and remission stage in vivo. (A) Neurons in Layer II/III (300~450 um) of ACC imaged in vivo and activity maps in 0 days before, 3 days SD and one day after SD (from left to right) in SD (top) and GA mice (down), (Red line: The blood vessel, scale bar, 20 um). (B) The overall trend of the average frequency of Ca2+ transients during the whole experiment. Data are shown as mean±SEM., **p<0.01, Two-way ANOVA with Bonferroni’s test. (C) The fractions of <3 Ca2+ transients/min in SD and GA mice. Two-tailed unpaired t-test. 0 d Baseline vs. 3 d SD+Saline, p<0.001; Baseline vs. GA-Baseline, p=0.543; 3 d SD: SD+Saline vs. SD+GA, p=0.012; GA+Baseline vs. 3 d SD+GA, p=0.360. (D) The average frequency of Ca2+ transients in SD 24 h, SD 48 h, SD 72 h, recover 1 d and recover 2 d compare with baseline time 0 d. Two-tailed paired t-test. 0 d Baseline vs. 24 h SD+Saline, p=0.024; 0 d Baseline vs. SD 48 h, p=0.004; 0 d vs. SD 72 h, p<0.001; 0 d vs. Re1d, p=0.019; 0 d vs. Re2d, p=0.082 (E) The average frequency of Ca2+ transients in 0 day, SD 24 h, SD 48 h, SD 72 h, recover 1 d in SD+Saline and SD+GA mice. Two-tailed unpaired t-test. 0 d: Baseline vs. GA+Baseline, p=0.747; SD 24 h: SD+Saline vs. SD+GA, p=0.104; SD 48 h: SD+Saline vs. SD+GA, p=0.315; SD 72 h: SD+Saline vs. SD+GA, p=0.002; recover 1 d: Saline vs. GA, p=0.194. n=42 cells in 6 SD+Saline mice, (F) The average frequency of Ca2+ transients in SD+GA group in SD 24 h, SD 48 h, SD 72 h, recover 1 d and recover 2 d compare with baseline time 0 d. Two-tailed paired t-test. 0 d Baseline vs. 24 h SD+GA, p=0.076; 0 d Baseline vs. 48 h SD+GA, p=0.002; 0 d Baseline vs. 72 h SD+GA, p=0.019; 0 d Baseline vs. Re1d SD+GA, p=0.066; 0 d Baseline vs. Re2d SD+GA, p=0.116, n=95 cells in 5 GA-treated mice. All data are shown as mean±SEM., ***p<0.001, **p<0.01, *p<0.05, ns, not significant. (G) The fractions of <3 Ca2+ transients/min in SD and GA mice. SD :SD+Saline. GA: SD+GA.
Fig. 4
Fig. 4
GA modulated the change of calcium transient amplitude induced by SD. (A) Mean calcium transient amplitude of imaged regions daily after GA induction. SD 24 h: SD+Saline vs. SD+GA, p=0.038; SD 48 h: SD+Saline vs. SD+GA, p=0.02. (B~D) The mean amplitude of Ca2+ transients in SD 24 h, SD 48 h, SD 72 h compare with baseline time 0 d. Two-tailed paired t-test. 0 d Baseline vs. SD+Saline 24 h, p=0.039; 0 d Baseline vs. SD+Saline 48 h, p=0.336; 0 d Baseline vs. SD+Saline 72 h, p=0.740. (E~I) The mean amplitude of Ca2+ transients in 0 day, SD 24 h, SD 48 h, SD 72 h, recover 1 d in SD+Saline and SD+GA mice. Kolmogorov-Smirnov test. 0 d: Baseline vs. GA+Baseline, p=0.446; SD 24 h: SD+Saline vs. SD+GA, p=0.038; SD 48 h: SD+Saline vs. SD+GA, p=0.020; SD 72 h: SD+Saline vs. SD+GA, p=0.750; recover 1 d: Saline vs. GA, p=0.699 (J~K) The rise time (J) and fall time (K) of Ca2+ transients during the whole experiment. (L) The rise time of Ca2+ transients in SD 24 h, SD 48 h, SD 72 h in SD+Saline and SD+GA mice. Two-tailed unpaired t-test. SD 24 h: SD+Saline (40 cells) vs. SD+GA (91 cells), p=0.989; SD 48 h: SD+Saline (39 cells) vs. SD+GA (90 cells), p=0.168; SD 72 h: SD+Saline (39 cells) vs. SD+GA (88 cells), p=0.931. (M) The fall time of Ca2+ transients in SD 24 h, SD 48 h, SD 72 h in SD and GA mice. Two-tailed unpaired t-test. SD 24 h: SD+Saline (40 cells) vs. SD+GA (91 cells), p=0.609; SD 48 h: SD+Saline (39 cells) vs. GA (90 cells), p=0.634; SD 72 h: SD+Saline (40 cells) vs. SD+GA (88 cells), p=0.648. n=6 SD mice, n=5 GA-treated mice. All data are shown as mean±SEM., *p<0.05, ns, not significant. (N) The mean amplitude of Ca2+ transients in recover 1 d, recover 2 d compare with baseline time 0 d in the SD+Saline group. Re 1 d vs. 0 d in SD+Saline mice. p=0.071; Re 2 d vs. 0 d in SD mice. p=0.15. (O) The mean amplitude of Ca2+ transients in SD 24 h, SD 48 h, SD 72 h, recover 1 d, recover 2 d, compare with 0 d baseline in SD+GA mice. 24 h: 0 d Baseline vs. SD+GA, p=0.977; 48 h: 0 d Baseline vs. SD+GA, p=0.562; 72 h: 0 d Baseline vs. SD+GA, p=0.871; Re 1 d: 0 d Baseline vs. SD+GA, p=0.819; Re 2 d: 0 d Baseline vs. SD+GA, p=0.393. n=42 cells in 6 SD+Saline mice, n=95 cells in 5 SD+GA mice. All data are shown as mean±SEM., ns, not significant, Two-tailed paired t-test.
Fig. 5
Fig. 5
The synchronization and functional connectivity of cortical network in SD and GA mice. (A) Raster plots depicting changes in activity (ΔF/F) over time for a representative correlation matrix quantifying network synchronization between each cell and every other. (B) Representative correlation matrices quantifying functional connectivity between each cell and every other spine. (C, D) The network synchronization and mean cell-cell correlation during the whole experiment. n=42 cells in 6 SD mice, n=95 cells in 5 GA-treated mice. All data are shown as mean±SEM. ns, not significant, two-way ANOVA with Bonferroni correction. SD: SD+Saline. GA: SD+GA. (E) The network synchronization in SD 24 h, p=0.923; SD 48 h, p=0.744 and SD 72 h, 0.958. n=6 mice in SD+Saline group, n=5 mice in SD+GA mice. (F) The functional connectivity of cortical network. SD 24 h, p=0.6; SD 48 h, p=0.569 and SD 72 h, p= 0.872. n=6 mice in SD+Saline group, n=5 mice in SD+GA group. All data are shown as mean±SEM. ns, not significant, two-tailed unpaired t-test.
Fig. 6
Fig. 6
GA reverse SD-induced synaptic impairment and the change of oxidative stress factor. (A) Sample traces showing sEPSCs. (B) There are no changes of average sEPSC amplitude both in each group. Kolmogorov-Smirnov test, Control vs. SD+Saline, p=0.819; SD+Saline vs. SD+GA, p=0.819. Saline, SD+Saline, SD+GA group, n=20 cells in 5 mice of each group. Control+GA group, n=10 cells in 4 mice. (C)The frequency of sEPSCs is decreased by SD and GA reversed this to control level. One-way ANOVA with Tukey’s multiple comparisons test. Control vs. SD+Saline, p =0.05; SD+Saline vs. SD+GA, p =0.04; Control vs. Control+GA, p=0.762. Control, SD+Saline, SD+GA group, n=20 cells in 5 mice of each group. Control+GA group, n=10 cells in 4 mice (D) Sample traces showing sIPSCs. (E, F) The inhibition synaptic transmission in pyramidal neurons is not affected by SD and GA. Amplitude: Kolmogorov-Smirnov test, Control vs. SD+Saline, p=0.847; SD+Saline vs. SD+GA, p=0.99. Frequency: one-way ANOVA with Tukey’s test. Control vs. SD+Saline, p=0.739; SD+Saline vs. SD+GA, p=0.996; Control vs. Control+GA, p=0.443. n=12 cells in 4 Control mice, n=12 cells in 4 SD+Saline mice, n=9 cells in 4 SD+GA mice, n=10 cells in 4 Control+GA mice. (G, H) The levels of MDA and the activity of SOD detected by spectrophotometric method. One-way ANOVA with Tukey’s test. MDA: Control vs. Control+SD, p=0.047; Control+SD vs. SD+GA, p<0.001. n=16 mice per group. SOD: Control vs. Control+SD, p<0.001; Control+SD vs. SD+GA, p<0.001. n=15 mice per group. (I) The expression of Nrf2 in the cortex detected by Elisa. One-way ANOVA with Tukey’s test. Control vs. Control+SD, p=0.049; Control+SD vs. SD+GA, p=0.005. n=a. All data are shown as mean±SEM. ***p<0.001, **p<0.01, *p<0.05, ns, not significant.

Similar articles

Cited by

References

    1. Havekes R, Abel T. The tired hippocampus: the molecular impact of sleep deprivation on hippocampal function. Curr Opin Neurobiol. 2017;44:13–19. doi: 10.1016/j.conb.2017.02.005. - DOI - PMC - PubMed
    1. Li W, Ma L, Yang G, Gan WB. REM sleep selectively prunes and maintains new synapses in development and learning. Nat Neurosci. 2017;20:427–437. doi: 10.1038/nn.4479. - DOI - PMC - PubMed
    1. Noble W, Spires-Jones TL. Sleep well to slow Alzheimer's progression? Science. 2019;363:813–814. doi: 10.1126/science.aaw5583. - DOI - PubMed
    1. Hossain MF, Wang N, Chen R, Li S, Roy J, Uddin MG, Li Z, Lim LW, Song YQ. Exploring the multifunctional role of melatonin in regulating autophagy and sleep to mitigate Alzheimer's disease neuropathology. Ageing Res Rev. 2021;67:101304. doi: 10.1016/j.arr.2021.101304. - DOI - PubMed
    1. Lu C, Lv J, Jiang N, Wang H, Huang H, Zhang L, Li S, Zhang N, Fan B, Liu X, Wang F. Protective effects of genistein on the cognitive deficits induced by chronic sleep deprivation. Phytother Res. 2020;34:846–858. doi: 10.1002/ptr.6567. - DOI - PubMed