. 2023 Oct;248(20):1732-1744.
doi: 10.1177/15353702231198067. Epub 2023 Sep 26.

GPER1 contributes to T3-induced osteogenesis by mediating glycolysis in osteoblast precursors

Affiliations

GPER1 contributes to T3-induced osteogenesis by mediating glycolysis in osteoblast precursors

Ying Xue et al. Exp Biol Med (Maywood). 2023 Oct.

Abstract

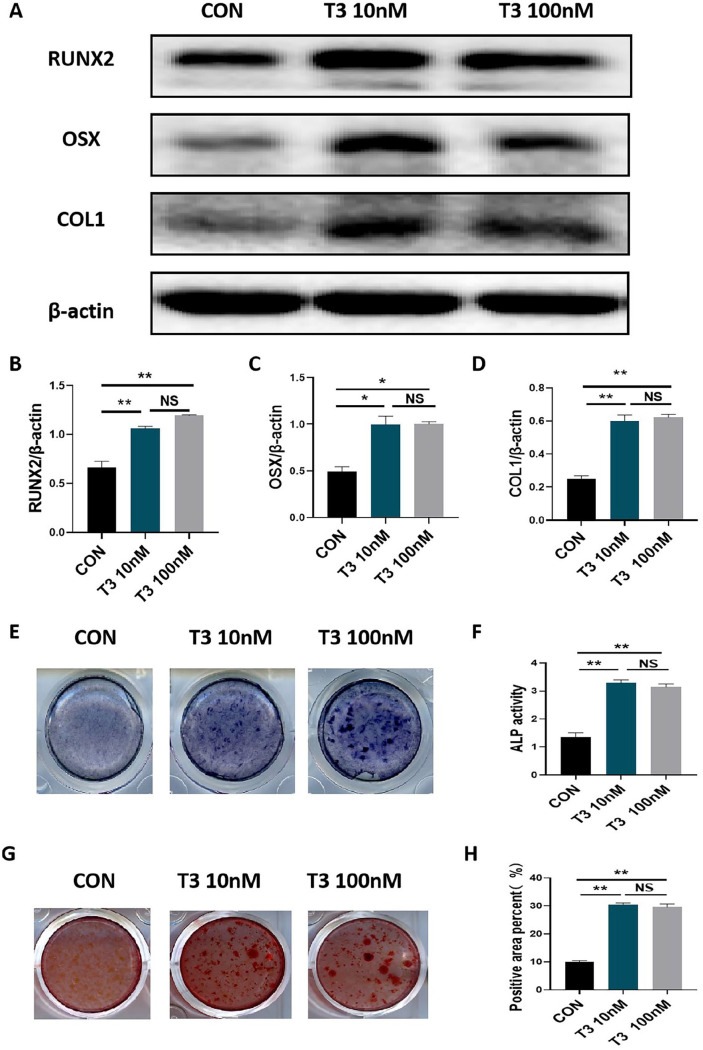
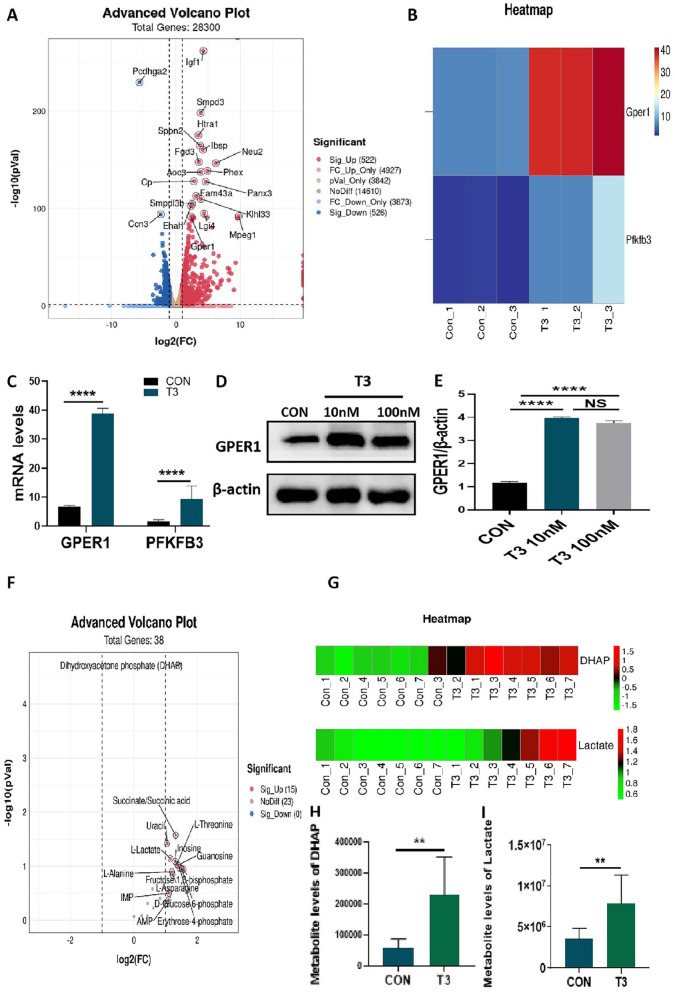
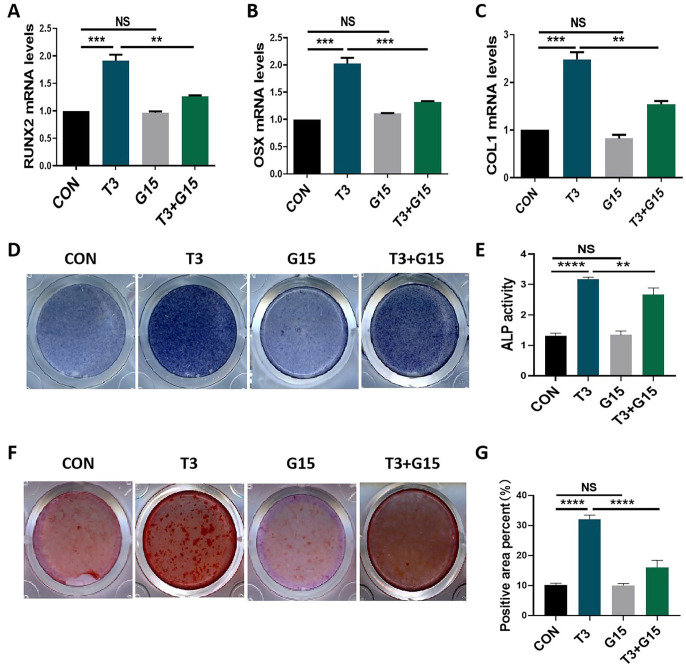
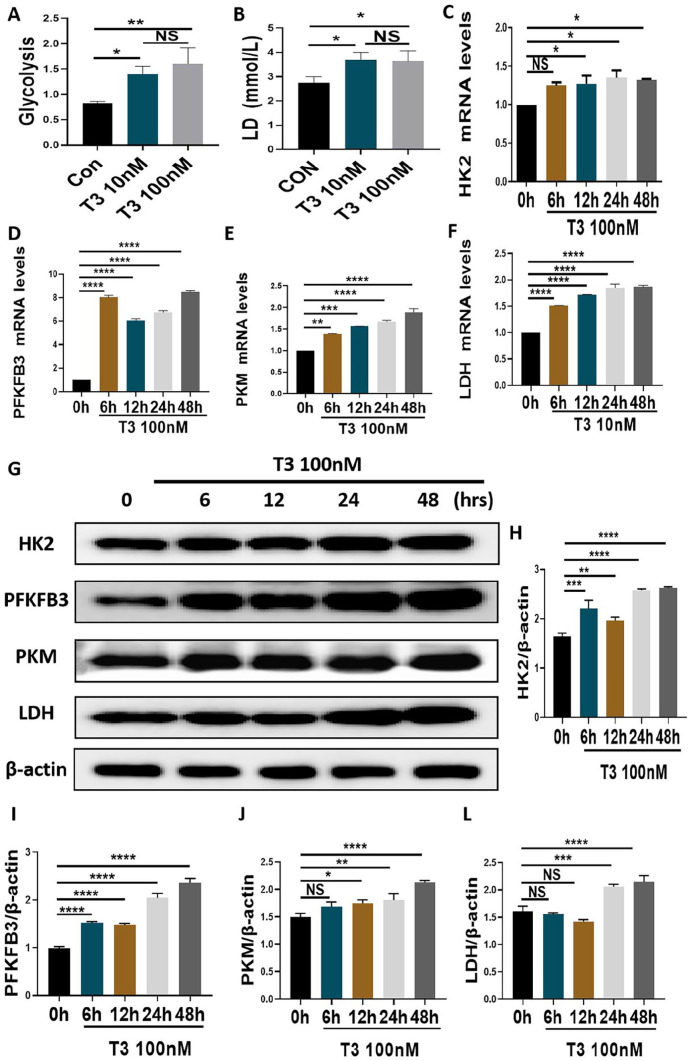
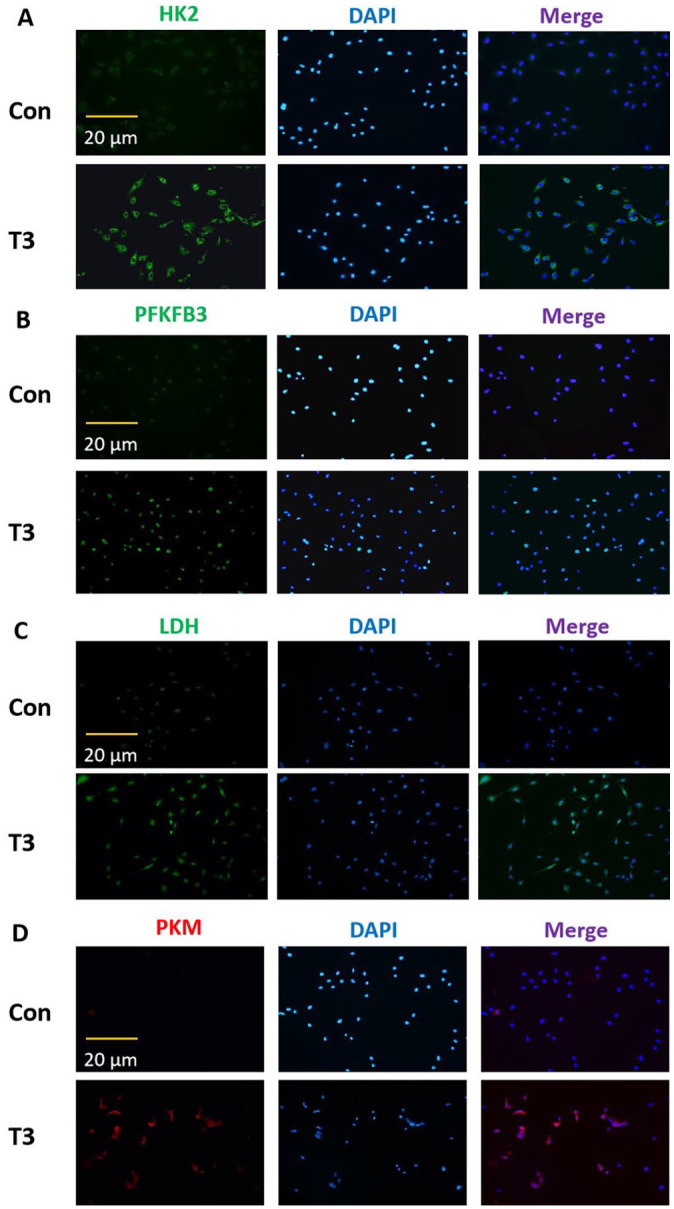
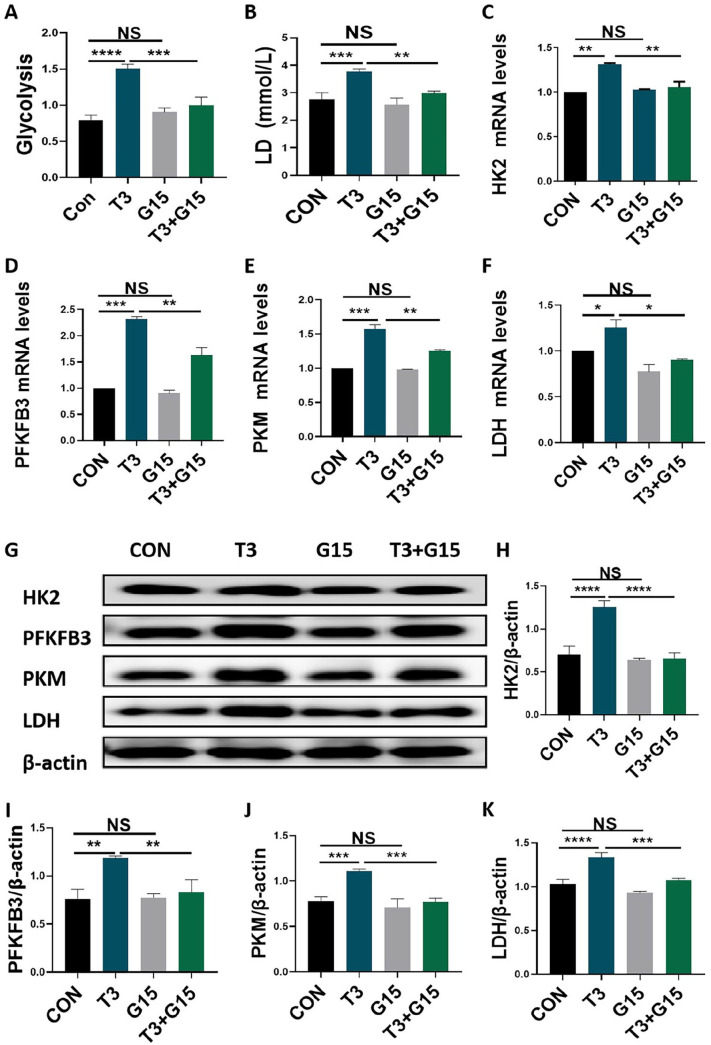
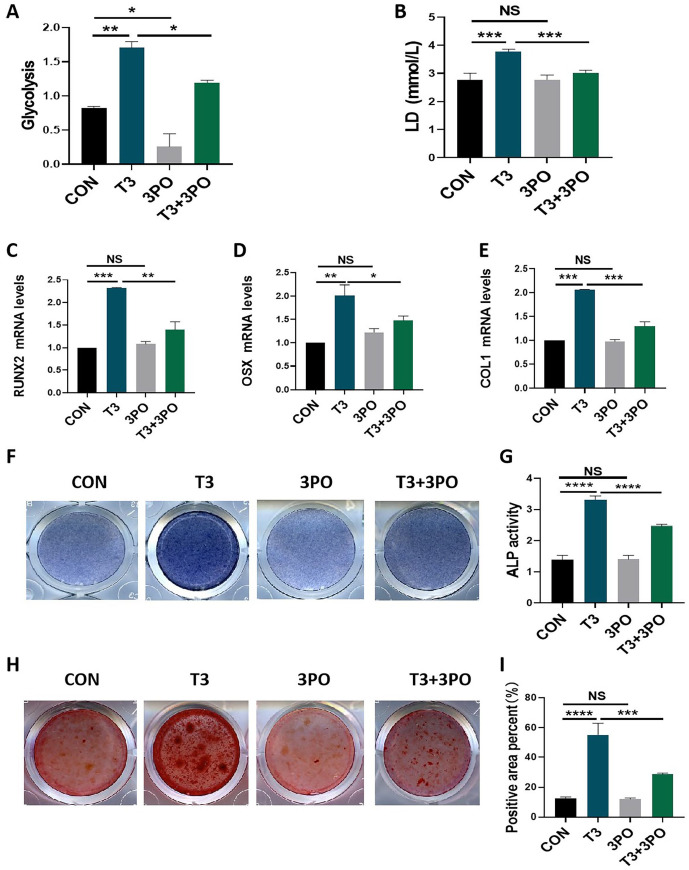
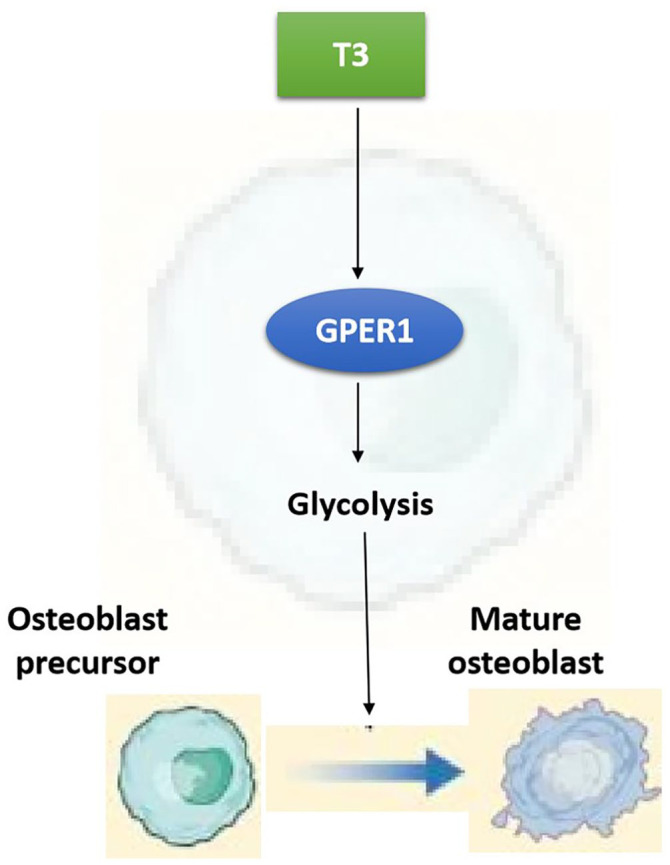
Triiodothyronine (T3) is critical to osteogenesis, which is the key factor in bone growth. Our transcriptomic and metabolomic analysis results indicated that T3 leads to enhanced expression of G protein-coupled estrogen receptor 1 (GPER1) as well as increases in glycolysis metabolite levels. Accordingly, our study aimed to explore the role of GPER1-mediated glycolysis in T3-regulated osteogenesis. The MC3T3-E1 cell line was used as an osteoblast precursor model. After treatment with T3, a GPER1-specific antagonist (G15) and inhibitor of glycolysis (3PO) were used to explore the roles of GPER1 and glycolysis in T3-regulated osteogenesis, as measured by ALP activity, Alizarin red staining intensity and osteogenic molecule expression. Our results showed that T3 promoted osteogenesis-related activity, which was reversed by treatment with G15. In addition, T3 enhanced the glycolytic potential and production of lactic acid (LD) in MC3T3-E1 cells, and treatment with G15 restored the aforementioned effects of T3. Ultimately, the pharmacological inhibition of glycolysis with 3PO blocked the ability of T3 to enhance osteogenic activities. In conclusion, GPER1 mediates glycolysis in osteoblast precursors, which is critical for T3-promoted osteogenesis.

Keywords: GPER1; MC3T3-E1; T3; glycolysis; osteogenesis.


Conflict of interest statement

Declaration of Conflicting InterestsThe author(s) declared no potential conflicts of interest with respect to the research, authorship, and/or publication of this article.

Figures

Figure 1.
Figure 1.
T3 promoted osteoblastic differentiation and mineralization. (A to D) MC3T3-E1 cells were treated with 0, 10, and 100 nM T3 for 7 days under osteogenic induction, and the protein expression of COL1, RUNX2, and OSX proteins were analyzed. Bar chart showing the protein levels of COL1, RUNX2, and OSX normalized to β-actin level. (E and F) ALP staining and activity in MC3T3-E1 cells treated with the indicated treatments for 7 days under osteogenic induction (Unit of ALP activity: King U/GPROT). (G and H) Alizarin red staining in MC3T3-E1 cells treated with the indicated treatments for 21 days under osteogenic induction. Bar chart showing the percentage of positive areas stained. Data are presented as mean ± SEM from three independent experiments. NS: not significant; Con: control group. *P < 0.05, **P < 0.01.
Figure 2.
Figure 2.
Transcriptomic and metabolomic analysis of T3-treated MC3T3-E1 cells. (A) Volcano plot representing differential expression analysis of genes regarding transcriptome sequencing between control and T3-treated groups (n = 3, each group). The X-axis showed log2-fold change in expression, and the negative log10 of the P value was plotted on the Y-axis. Each gene was represented by one point on the graph. (B) Heat map represented the differential expression analysis of GPER1 and PFKFB3 between two groups (n = 3, each group). (C) The mRNA levels of GPER1 and PFKFB3 in the two groups displayed by transcriptome sequencing. (D and E) MC3T3-E1 cells were treated with 0, 10, and 100 nM T3 for 48 h, and the protein expression of GPER1 were analyzed. Bar chart showing the protein level of GPER1 normalized to β-actin level. (F) Volcano plot representing differential expression metabolites in metabolomic analysis between control and T3-treated groups (n = 7, each group). The X-axis showed log2-fold change in expression, and the variable importance in projection (VIP) was plotted on the Y-axis. Each metabolite was represented by one point on the graph. (G) Heat map represented the differential expression analysis of DHAP and LD between two groups (n = 7, each group). (H and I) The metabolite levels DHAP and LD in the two groups displayed by metabolomic analysis. NS: not significant; Con: control group. **P < 0.01, ****P < 0.0001.
Figure 3.
Figure 3.
The promotion of osteogenic activities by T3 was reversed by G15 treatment. (A to C) MC3T3-E1 cells were treated with 100 nM T3 along with or without 10 μM G15 for 7 days under osteogenic induction, and the mRNA levels of COL1, RUNX2, and OSX were analyzed. (D and E) ALP staining and activity in MC3T3-E1 cells treated with the indicated treatments for 7 days under osteogenic induction (Unit of ALP activity: King U/GPROT). (F) Alizarin red staining in MC3T3-E1 cells treated with the indicated treatments for 21 days under osteogenic induction. (G) Bar chart showing the percentage of positive areas stained. Data are presented as mean ± SEM from three independent experiments. NS: not significant; Con: control group. **P < 0.01, ***P < 0.001, ****P < 0.0001.
Figure 4.
Figure 4.
T3 upregulated glycolytic activities in MC3T3-E1 cells. (A and B) MC3T3-E1 cells were treated with 0, 10, and 100 nM T3 for 48 h, and the glycolytic potential and LD production in the supernatant were analyzed. (C to F) The mRNA expression of HK2, PFKFB3, PKM, and LDH in MCT3-E1 cells treated with indicated treatments. (G) The protein expression of HK2, PFKFB3, PKM, and LDH in MCT3-E1 cells treated with indicated treatments. (H to K) The bar chart shows the relative expression of HK2, PFKFB3, PKM, and LDH normalized to β-actin level. Data are presented as mean ± SEM from three independent experiments. NS: not significant; Con: control group; hrs: hours. *P < 0.05, **P < 0.01, ***P < 0.001, ****P < 0.0001.
Figure 5.
Figure 5.
The immunofluorescent results of altered glycolytic activities in MC3T3-E1 cells. After treatment with 0 or 100 nM T3 for 48 h, and the fluorescent intensity of HK2, PFKFB3, LDH, and PKM in the cytoplasm were evaluated by immunofluorescence staining (scale = 20 μm). Data are representative images among six independent samples with unanimous results. Con: control group.
Figure 6.
Figure 6.
T3 upregulation of glycolytic activities in of MC3T3-E1 cells were reversed by G15 treatment. (A and B) MC3T3-E1 cells were treated with 100 nM T3 along with or without 10 μM G15 for 48 h, and the glycolytic potential and LD production in the supernatant were analyzed. (C to F) The mRNA expression of HK2, PFKFB3, PKM, and LDH in MCT3-E1 cells treated with indicated treatments as described in (A and B). (G) The protein expression of HK2, PFKFB3, PKM, and LDH in MCT3-E1 cells treated with indicated treatments as described in (A and B). (H–K) The bar chart shows the relative expression of HK2, PFKFB3, PKM, and LDH normalized to β-actin level. Data are presented as mean ± SEM from three independent experiments. NS: not significant; Con: control group. *P < 0.05, **P < 0.01, ***P < 0.001, ****P < 0.0001.
Figure 7.
Figure 7.
T3-promoted osteogenic activities were blocked by 3PO addition. (A and B) MC3T3-E1 cells were treated with 100 nM T3 along with or without 10 μM 3PO for 48 h, and the glycolytic potential and LD production in the supernatant were analyzed. (C to E) The mRNA levels of COL1, RUNX2, and OSX in MCT3-E1 cells treated with 100 nM T3 along with or without 10 μM 3PO for 7 days under osteogenic induction. (F and G) ALP staining and activity in MC3T3-E1 cells treated with the indicated treatments for 7 days under osteogenic induction (Unit of ALP activity: King U/GPROT). (H) Alizarin red staining in MC3T3-E1 cells treated with the indicated treatments for 21 days under osteogenic induction. (I) Bar chart showing the percentage of positive areas stained. Data are presented as mean ± SEM from three independent experiments. NS: not significant; Con: control group. **P < 0.01, ***P < 0.001, ****P < 0.0001.
Figure 8.
Figure 8.
The working model diagram of T3-promoted osteogenesis through GPER1-mediated glycolysis. Briefly, T3 can enhance GPER1 expression, thereby promoting glycolysis in osteoblast precursors, which leads to the differentiation of osteoblast precursors into mature osteoblasts.

References

    1. Boersma B, Otten BJ, Stoelinga GB, Wit JM. Catch-up growth after prolonged hypothyroidism. Eur J Pediatr 1996;155:362–7 - PubMed
    1. Crawford JD. Long-term growth in juvenile acquired hypothyroidism: the failure to achieve normal adult stature. N Engl J Med 1988;318:599–602 - PubMed
    1. Banovac K, Koren E. Triiodothyronine stimulates the release of membrane-bound alkaline phosphatase in osteoblastic cells. Calcif Tissue Int 2000;67:460–5 - PubMed
    1. Gouveia CH, Schultz JJ, Bianco AC, Brent GA. Thyroid hormone stimulation of osteocalcin gene expression in ROS 17/2.8 cells is mediated by transcriptional and post-transcriptional mechanisms. J Endocrinol 2001;170:667–75 - PubMed
    1. Varga F, Spitzer S, Klaushofer K. Triiodothyronine (T3) and 1,25-dihydroxyvitamin D3 (1,25D3) inversely regulate OPG gene expression in dependence of the osteoblastic phenotype. Calcif Tissue Int 2004;74:382–7 - PubMed

Publication types

Substances