. 2023 Sep 14;3(1):vbad124.
doi: 10.1093/bioadv/vbad124. eCollection 2023.

The Free Lunch is not over yet-systematic exploration of numerical thresholds in maximum likelihood phylogenetic inference

Affiliations

The Free Lunch is not over yet-systematic exploration of numerical thresholds in maximum likelihood phylogenetic inference

Julia Haag et al. Bioinform Adv. .

Abstract

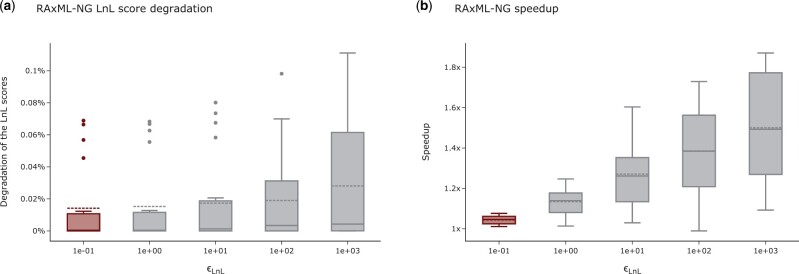
Summary: Maximum likelihood (ML) is a widely used phylogenetic inference method. ML implementations heavily rely on numerical optimization routines that use internal numerical thresholds to determine convergence. We systematically analyze the impact of these threshold settings on the log-likelihood and runtimes for ML tree inferences with RAxML-NG, IQ-TREE, and FastTree on empirical datasets. We provide empirical evidence that we can substantially accelerate tree inferences with RAxML-NG and IQ-TREE by changing the default values of two such numerical thresholds. At the same time, altering these settings does not significantly impact the quality of the inferred trees. We further show that increasing both thresholds accelerates the RAxML-NG bootstrap without influencing the resulting support values. For RAxML-NG, increasing the likelihood thresholds ϵLnL and ϵbrlen to 10 and 103, respectively, results in an average tree inference speedup of 1.9 ± 0.6 on Data collection 1, 1.8 ± 1.1 on Data collection 2, and 1.9 ± 0.8 on Data collection 2 for the RAxML-NG bootstrap compared to the runtime under the current default setting. Increasing the likelihood threshold ϵLnL to 10 in IQ-TREE results in an average tree inference speedup of 1.3 ± 0.4 on Data collection 1 and 1.3 ± 0.9 on Data collection 2.

Availability and implementation: All MSAs we used for our analyses, as well as all results, are available for download at https://cme.h-its.org/exelixis/material/freeLunch_data.tar.gz. Our data generation scripts are available at https://github.com/tschuelia/ml-numerical-analysis.


Conflict of interest statement

None declared.

Figures

Figure 1.
Figure 1.
Influence of the ϵLnL setting on the LnL scores and runtime of RAxML-NG tree inferences. (a) Influence of the ϵLnL setting on the LnL scores of RAxML-NG. The highlighted box indicates the default setting. The y-axis shows the LnL score degradation per inferred tree in percent relative to the LnL score of the best-known tree. Higher percentages indicate worse LnL scores. (b) Influence of the ϵLnL setting on the RAxML-NG tree inference runtimes. The highlighted box indicates the default setting. The y-axis shows the speedup relative to the average runtime under the default setting.
Figure 2.
Figure 2.
Influence of the ϵbrlen setting on the LnL scores and runtime of RAxML-NG tree inferences. (a) Influence of the ϵbrlen setting on the LnL scores of RAxML-NG. The highlighted box indicates the default setting. The y-axis shows the LnL score degradation per inferred tree in percent relative to the LnL score of the best-known tree. Higher percentages indicate worse LnL scores. (b) Influence of the ϵbrlen setting on the RAxML-NG tree inference runtimes. The highlighted box indicates the default setting. The y-axis shows the speedup relative to the average runtime under the default setting.
Figure 3.
Figure 3.
Influence of simultaneously changing both likelihood epsilon settings on the LnL scores and runtime of the RAxML-NG tree inference. (a) Influence of simultaneously changing both likelihood epsilon settings on the LnL scores of RAxML-NG. The highlighted box indicates the default combination. The y-axis shows the LnL score degradation per inferred tree in percent relative to the LnL score of the best-known tree. Higher percentages indicate worse LnL scores. (b) Influence of simultaneously changing both likelihood epsilon settings on the RAxML-NG tree inference runtimes. The highlighted box indicates the default combination. The y-axis shows the speedup relative to the average runtime under the default combination.
Figure 4.
Figure 4.
Influence of the ϵLnL setting on the LnL scores and runtimes of IQ-TREE tree inferences. (a) Influence of the ϵLnL setting on the LnL scores of IQ-TREE. The highlighted box indicates the default setting. The y-axis shows the LnL score degradation per inferred tree in percent relative to the LnL score of the best-known tree. Higher percentages indicate worse LnL scores. (b) Influence of the ϵLnL setting on IQ-TREE tree inference runtimes. The highlighted box indicates the default setting. The y-axis shows the speedup relative to the average runtime under the default setting.
Figure 5.
Figure 5.
Influence of simultaneously changing both likelihood epsilon settings on the bootstrap support values and runtime of the RAxML-NG bootstrap. (a) Influence of simultaneously changing both likelihood epsilon settings on the bootstrap support values. The highlighted box indicates the default combination. The y-axis shows the Pearson correlation coefficients between support values for all ML trees across all analyzed datasets. (b) Influence of simultaneously changing both likelihood epsilon settings on the RAxML-NG bootstrapping runtimes. The highlighted box indicates the default combination. The y-axis shows the speedup relative to the runtime under the default combination. This figure shows all MSAs (no outlier filtering).

References

    1. Brent RP. An algorithm with guaranteed convergence for finding a zero of a function. Comput J 1971;14:422–5. 10.1093/comjnl/14.4.422 - DOI
    1. Cavalli-Sforza LL, Edwards AWF.. Phylogenetic analysis. Models and estimation procedures. Evolution 1967;21:550–70. 10.1111/j.1558-5646.1967.tb03411.x - DOI - PubMed
    1. Chor B, Tuller T.. Maximum likelihood of evolutionary trees: hardness and approximation. Bioinformatics 2005;21:i97–106. 10.1093/bioinformatics/bti1027 - DOI - PubMed
    1. Corey DM, Dunlap WP, Burke MJ.. Averaging correlations: expected values and bias in combined Pearson rs and Fisher’s z transformations. J Gen Psychol 1998;125:245–61. 10.1080/00221309809595548 - DOI
    1. Farris JS. Methods for computing wagner trees. Syst Biol 1970;19:83–92. 10.1093/sysbio/19.1.83 - DOI