

Investigating Balloon-Vessel Contact Pressure Patterns in Angioplasty: In Silico Insights for Drug-Coated Balloons
- PMID: 37751027
- PMCID: PMC10632265
- DOI: 10.1007/s10439-023-03359-y
Investigating Balloon-Vessel Contact Pressure Patterns in Angioplasty: In Silico Insights for Drug-Coated Balloons
Abstract
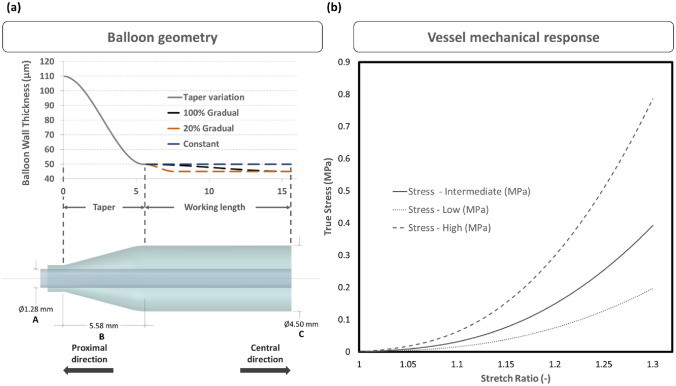
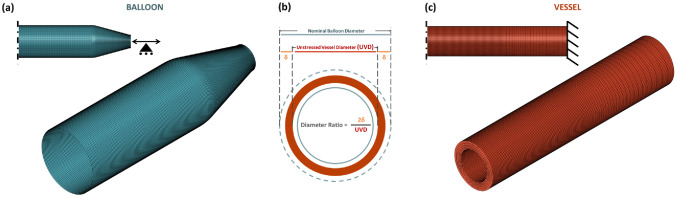
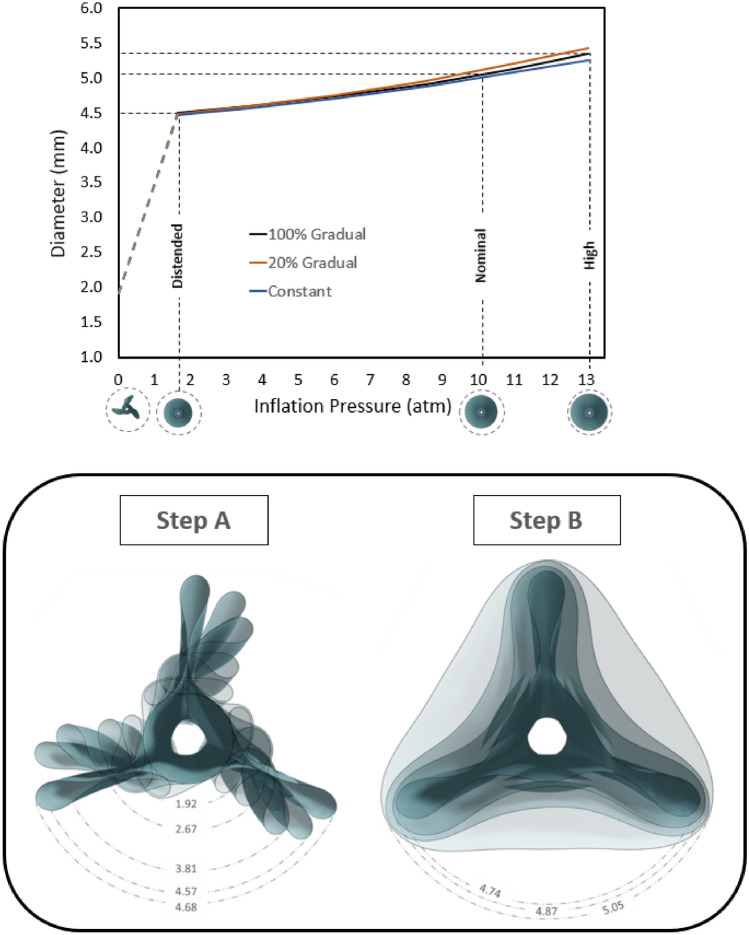
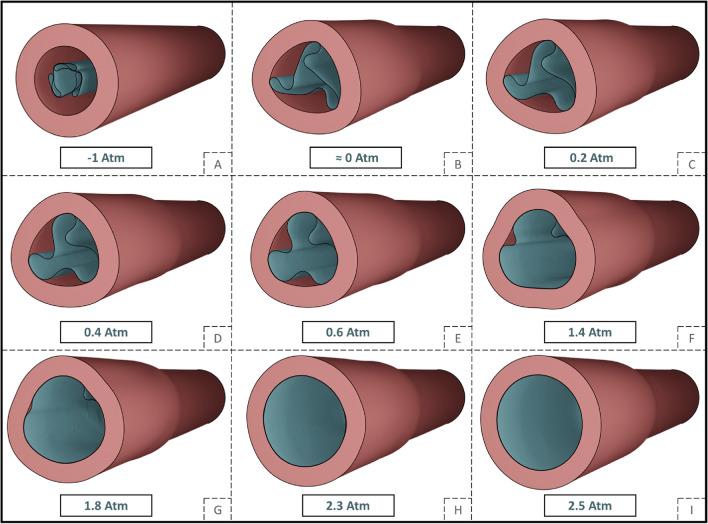
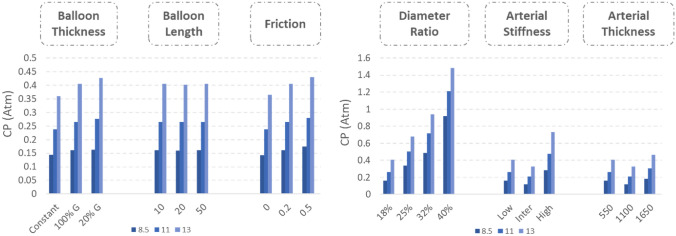
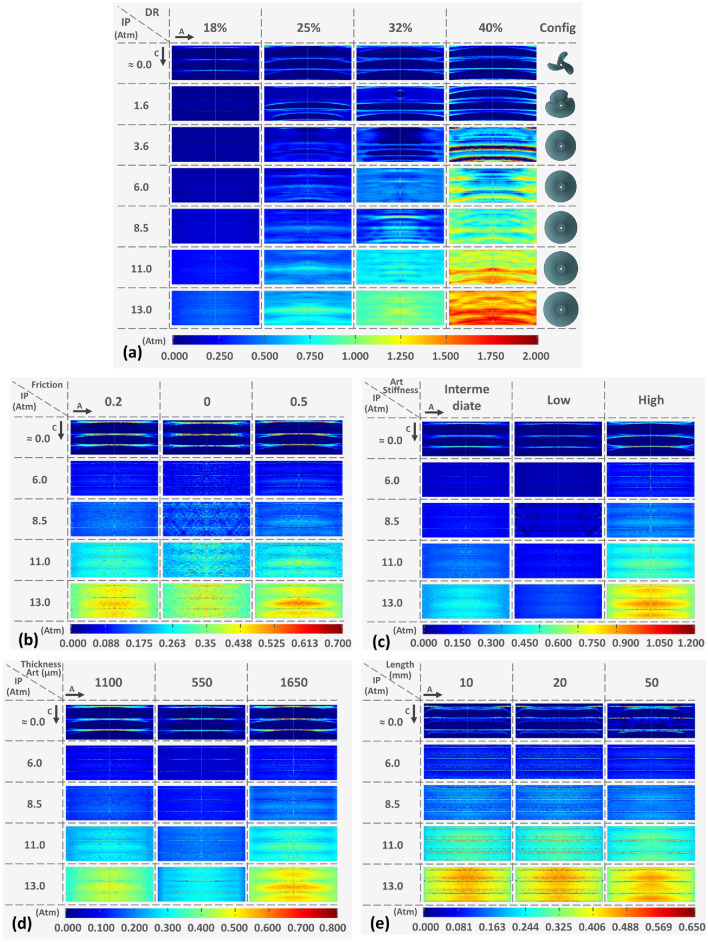
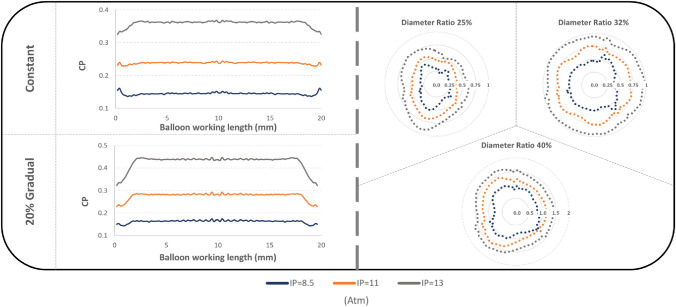
Drug-Coated Balloons have shown promising results as a minimally invasive approach to treat stenotic arteries, but recent animal studies have revealed limited, non-uniform coating transfer onto the arterial lumen. In vitro data suggested that local coating transfer tracks the local Contact Pressure (CP) between the balloon and the endothelium. Therefore, this work aimed to investigate in silico how different interventional and device parameters may affect the spatial distribution of CP during the inflation of an angioplasty balloon within idealized vessels that resemble healthy femoral arteries in size and compliance. An angioplasty balloon computational model was developed, considering longitudinal non-uniform wall thickness, due to its forming process, and the folding procedure of the balloon. To identify the conditions leading to non-uniform CP, sensitivity finite element analyses were performed comparing different values for balloon working length, longitudinally varying wall thickness, friction coefficient on the balloon-vessel interface, vessel wall stiffness and thickness, and balloon-to-vessel diameter ratio. Findings indicate a significant irregularity of contact between the balloon and the vessel, mainly affected by the balloon's unfolding and longitudinal thickness variation. Mirroring published data on coating transfer distribution in animal studies, the interfacial CP distribution was maximal at the middle of the balloon treatment site, while exhibiting a circumferential pattern of linear peaks as a consequence of the particular balloon-vessel interaction during unfolding. A high ratio of balloon-to-vessel diameter, higher vessel stiffness, and thickness was found to increase significantly the amplitude and spatial distribution of the CP, while a higher friction coefficient at the balloon-to-vessel interface further exacerbated the non-uniformity of CP. Evaluation of balloon design effects revealed that the thicker tapered part caused CP reduction in the areas that interacted with the extremities of the balloon, whereas total length only weakly impacted the CP. Taken together, this study offers a deeper understanding of the factors influencing the irregularity of balloon-tissue contact, a key step toward uniformity in drug-coating transfer and potential clinical effectiveness.
Keywords: Contact pressure; Drug-coated balloons; Drug-coating; Finite element simulations; Non-uniformity; Numerical.
© 2023. The Author(s).
Conflict of interest statement
The authors declare that they have no known competing financial interests or personal relationships that could have appeared to influence the work reported in this paper.
Figures

Similar articles
-
3D modelling of drug-coated balloons for the treatment of calcified superficial femoral arteries.PLoS One. 2021 Oct 11;16(10):e0256783. doi: 10.1371/journal.pone.0256783. eCollection 2021. PLoS One. 2021. PMID: 34634057 Free PMC article.
-
A Novel In Silico-Ex Vivo Model for Correlating Coating Transfer to Tissue with Local Drug-Coated Balloon-Vessel Contact Pressures.Ann Biomed Eng. 2025 Mar;53(3):740-757. doi: 10.1007/s10439-024-03634-6. Epub 2024 Dec 12. Ann Biomed Eng. 2025. PMID: 39665865 Free PMC article.
-
Coating and Pharmacokinetic Evaluation of Air Spray Coated Drug Coated Balloons.Cardiovasc Eng Technol. 2018 Jun;9(2):240-250. doi: 10.1007/s13239-018-0346-1. Epub 2018 Mar 1. Cardiovasc Eng Technol. 2018. PMID: 29497966 Free PMC article.
-
How does a drug-coated balloon work? Overview of coating techniques and their impact.J Cardiovasc Surg (Torino). 2016 Feb;57(1):3-11. J Cardiovasc Surg (Torino). 2016. PMID: 26771720 Review.
-
Paclitaxel-Coated Balloon for Femoropopliteal Artery Disease.Curr Cardiol Rep. 2017 Feb;19(2):10. doi: 10.1007/s11886-017-0823-4. Curr Cardiol Rep. 2017. PMID: 28185166 Review.
Cited by
-
Drug coated balloons in percutaneous coronary intervention: how can computational modelling help inform evolving clinical practice?Front Med Technol. 2025 Apr 30;7:1546417. doi: 10.3389/fmedt.2025.1546417. eCollection 2025. Front Med Technol. 2025. PMID: 40370491 Free PMC article. Review.
-
Plaque heterogeneity and the spatial distributions of its components dictate drug-coated balloon therapy.Sci Rep. 2024 Feb 22;14(1):4412. doi: 10.1038/s41598-024-54756-9. Sci Rep. 2024. PMID: 38388639 Free PMC article.
-
Drug Loss at Arterial Bends Can Dominate Off-Target Drug Delivery by Paclitaxel-Coated Balloons.Pharmaceutics. 2025 Feb 4;17(2):197. doi: 10.3390/pharmaceutics17020197. Pharmaceutics. 2025. PMID: 40006564 Free PMC article.
-
Do Balloon Catheters have a Different Radial Force Along Their Longitudinal Axis?Cardiovasc Intervent Radiol. 2024 Sep;47(9):1278-1285. doi: 10.1007/s00270-024-03716-x. Epub 2024 Apr 19. Cardiovasc Intervent Radiol. 2024. PMID: 38639779 Free PMC article.
-
In Silico Investigation of the Interlaminar and Mechanical Fracture of Arteries with Atheromatic Plaque during Angioplasty Treatment.Biomedicines. 2024 Sep 14;12(9):2105. doi: 10.3390/biomedicines12092105. Biomedicines. 2024. PMID: 39335617 Free PMC article.
References
-
- Avanzini A, Battini D. FEM simulation of subintimal angioplasty for the treatment of chronic total occlusions. Math. Probl. Eng. 2018;2018:e2648910. doi: 10.1155/2018/2648910. - DOI
MeSH terms
Substances
Grants and funding
LinkOut - more resources
Full Text Sources
Miscellaneous
