. 2023 Nov 15;133(22):e165616.
doi: 10.1172/JCI165616.

Type I interferon signature and cycling lymphocytes in macrophage activation syndrome

Affiliations

Type I interferon signature and cycling lymphocytes in macrophage activation syndrome

Zhengping Huang et al. J Clin Invest. .

Abstract

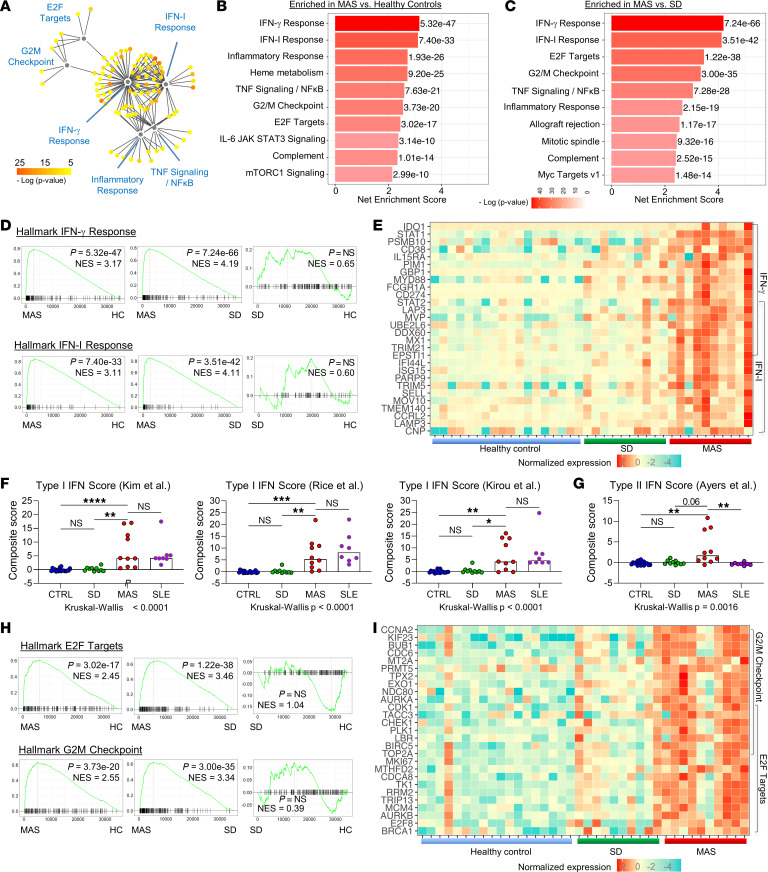
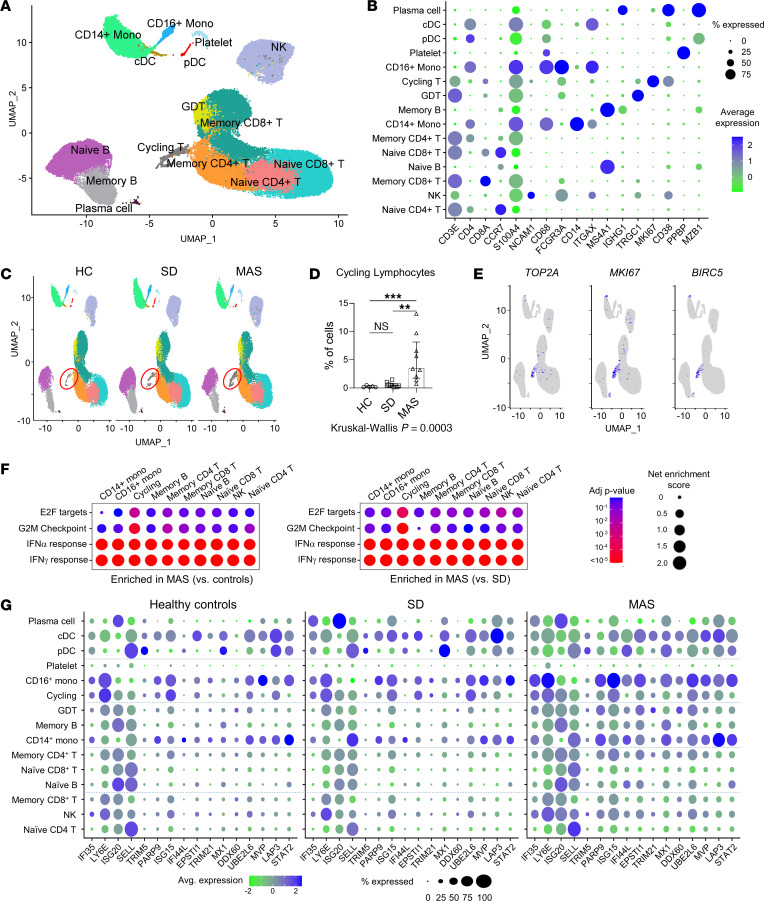
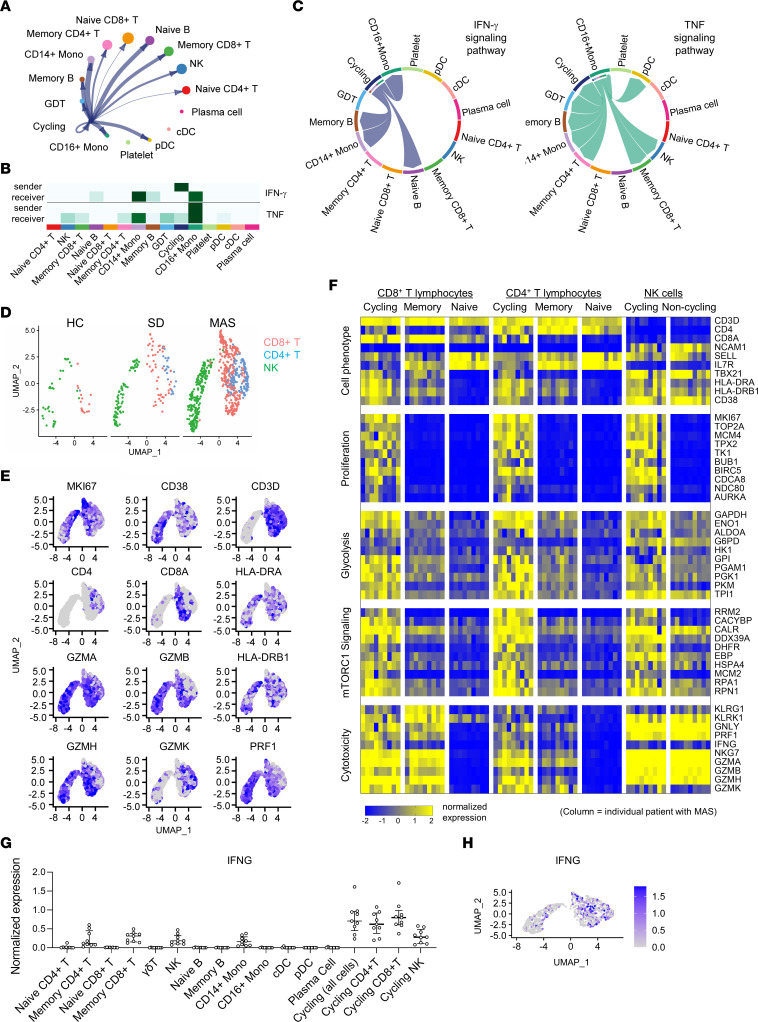
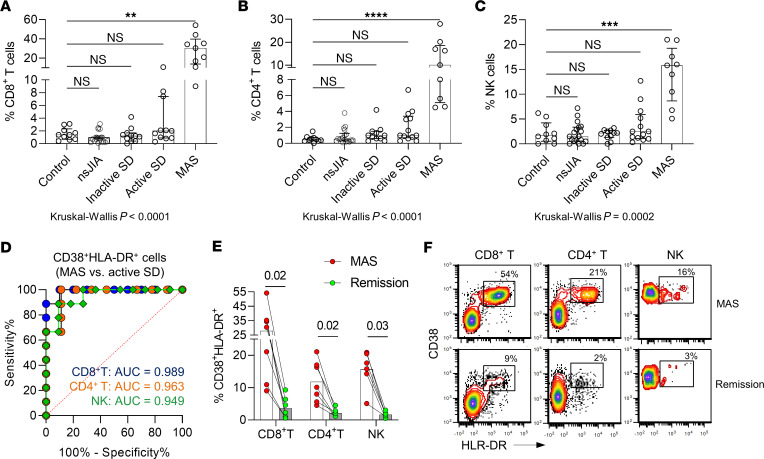
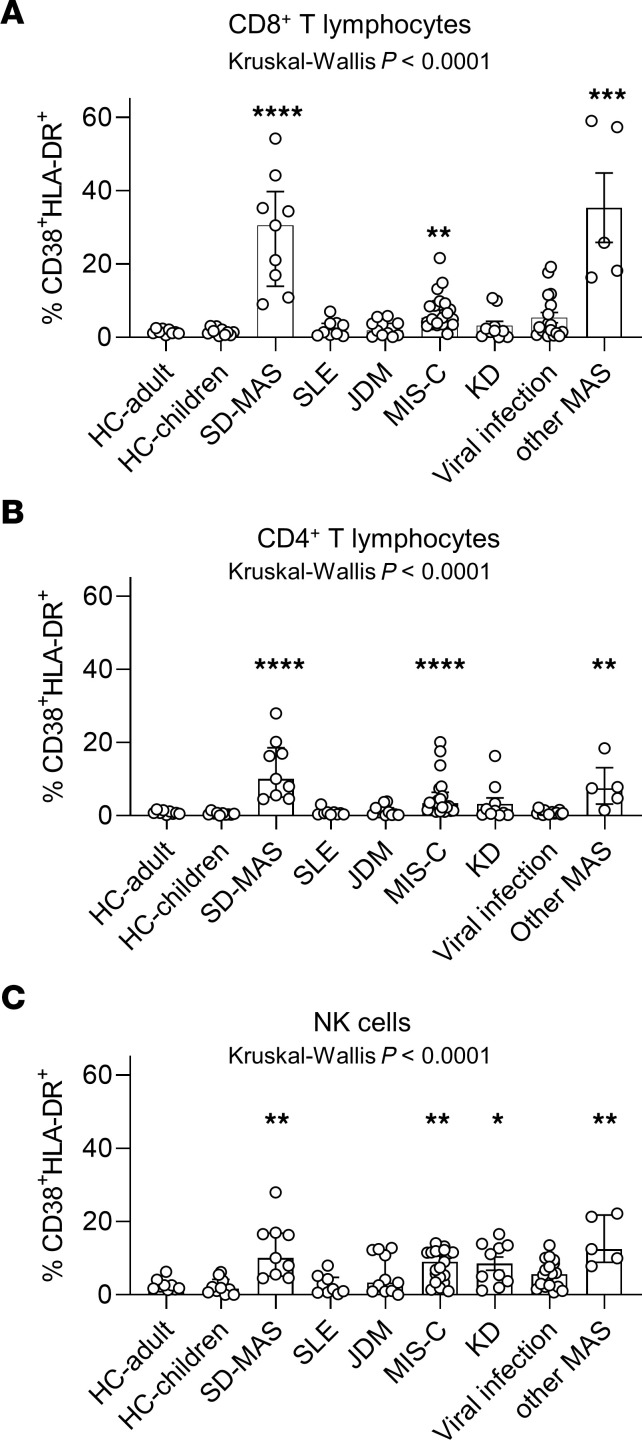
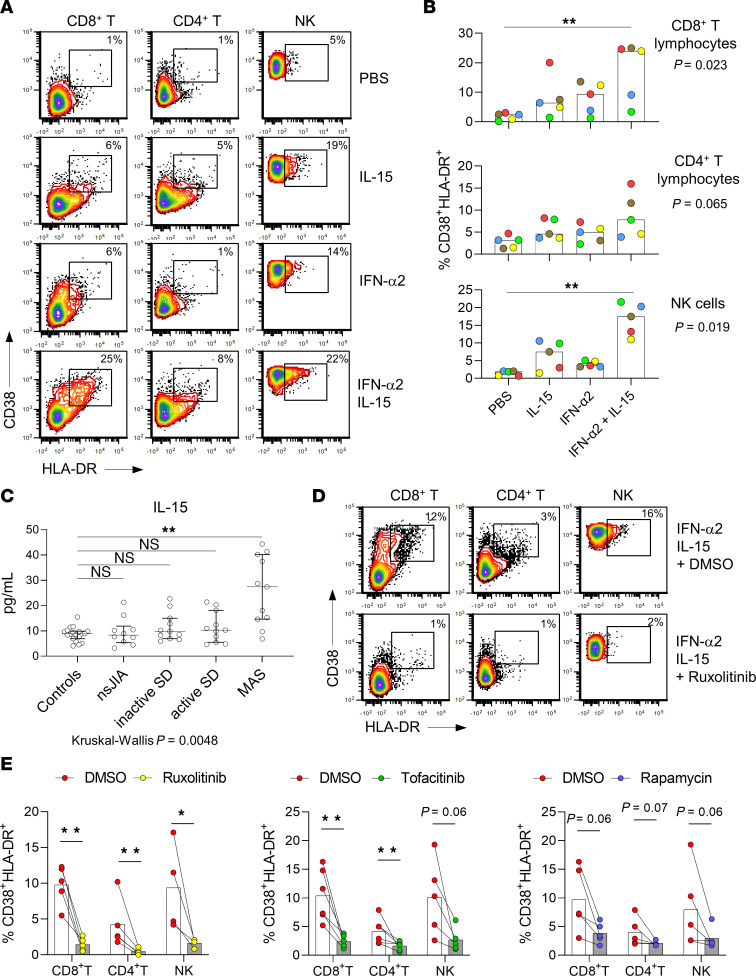
BACKGROUNDMacrophage activation syndrome (MAS) is a life-threatening complication of Still's disease (SD) characterized by overt immune cell activation and cytokine storm. We aimed to further understand the immunologic landscape of SD and MAS.METHODWe profiled PBMCs from people in a healthy control group and patients with SD with or without MAS using bulk RNA-Seq and single-cell RNA-Seq (scRNA-Seq). We validated and expanded the findings by mass cytometry, flow cytometry, and in vitro studies.RESULTSBulk RNA-Seq of PBMCs from patients with SD-associated MAS revealed strong expression of genes associated with type I interferon (IFN-I) signaling and cell proliferation, in addition to the expected IFN-γ signal, compared with people in the healthy control group and patients with SD without MAS. scRNA-Seq analysis of more than 65,000 total PBMCs confirmed IFN-I and IFN-γ signatures and localized the cell proliferation signature to cycling CD38+HLA-DR+ cells within CD4+ T cell, CD8+ T cell, and NK cell populations. CD38+HLA-DR+ lymphocytes exhibited prominent IFN-γ production, glycolysis, and mTOR signaling. Cell-cell interaction modeling suggested a network linking CD38+HLA-DR+ lymphocytes with monocytes through IFN-γ signaling. Notably, the expansion of CD38+HLA-DR+ lymphocytes in MAS was greater than in other systemic inflammatory conditions in children. In vitro stimulation of PBMCs demonstrated that IFN-I and IL-15 - both elevated in MAS patients - synergistically augmented the generation of CD38+HLA-DR+ lymphocytes, while Janus kinase inhibition mitigated this response.CONCLUSIONMAS associated with SD is characterized by overproduction of IFN-I, which may act in synergy with IL-15 to generate CD38+HLA-DR+ cycling lymphocytes that produce IFN-γ.

Keywords: Cytokines; Immunology; Inflammation.


Figures

Figure 1
Figure 1. Presence of IFN-I and IFN-γ signatures in patients with MAS.
(A) Cytoscape plot of top upregulated genes in patients with MAS (n = 10) compared with people in the healthy control group (HC; n = 18). Genes were grouped by hallmark gene sets. (B) GSEA of patients with MAS versus people in the healthy control group (C) patients with MAS versus patients with active sJIA without MAS (n = 10). Net enrichment score and P value of the top 10 enriched gene sets for each comparison are displayed. (D) GSEA plots of hallmark IFN-I response and IFN-γ response gene sets, and (E) heatmap display of top leading-edge genes in each pathway comparing patients with MAS, active sJIA without MAS, and people in the healthy control group. Genes included in both IFN-I response and IFN-γ response gene sets are indicated by overlapping brackets. (F) Comparison of composite gene set score derived from published IFN-I signature and (G) IFN-γ signature gene sets. Patients with active SLE (n = 8) were included for comparison. (H) GSEA plots of hallmark E2F targets and G2M checkpoint gene sets and (I) heatmap display of leading-edge genes in each pathway comparing patients with MAS, patients with active sJIA without MAS, and people in the healthy control group. Genes included in both E2F targets and G2M checkpoint pathways are indicated by overlapping brackets. Statistical analysis: bars in panels F and G represent the median. Kruskal-Wallis test was used for comparison of multiple groups and Dunn’s correction was applied for the indicated comparisons. *P < 0.05, **P < 0.01, ***P < 0.001, ***P < 0.0001.
Figure 2
Figure 2. Single cell transcriptomic landscape of SD and MAS.
(A) UMAP display of PBMC (65,131 cells) concatenated from people in the healthy control group (n = 5), patients with SD without MAS (n = 10) and patients with MAS (n = 9). Cell subsets are labeled based on the expression of lineage-defining genes. (B) Cluster plot of lineage-defining markers for major leukocyte subsets. Size of circles represents percentage of cells expressing the indicated marker and color indicates strength of expression. (C) UMAP display of PBMC in people in the healthy control group, and patients with active SD with or without MAS. Cell populations are as defined in panel A. Red circle indicates cycling lymphocytes. (D) Quantification of cycling lymphocytes in people in the healthy control group and patients with SD with or without MAS. (E) Feature plot illustrating the expression of cell proliferation markers TOP2A, MKI67, and BIRC5. (F) Cluster plot of GSEA comparing hallmark gene sets (IFN-I response, IFN-γ response, E2F targets, and G2M checkpoint) in major immune cell populations. The MAS group was compared with the healthy control group (left) and patients with SD without MAS (right). Size of circles represents the degree of enrichment and color indicates P value. (G) Cluster plot of IFN-stimulated gene expression among leukocyte subsets. Size of circles represents percentage of cells expressing the indicated marker, while color indicates strength of expression. Statistical analysis: Bars represent the median and error bars indicate interquartile range in panel D. Kruskal-Wallis test was used for comparison of multiple groups and Dunn’s correction was applied for the indicated comparisons. **P < 0.01, ***P < 0.001.
Figure 3
Figure 3. scRNA-Seq analysis of cycling lymphocyte subsets in patients with MAS.
(A) Circular plot illustrating cellular communication between cycling lymphocytes and other PBMC subsets. Cell populations are as defined in Figure 2. (B) heatmap display and (C) chord diagram of projected sender(s) and receiver(s) of IFN-γ and TNF signaling in PBMC cell subsets based on CellChat analysis of scRNA-Seq data from patients with MAS. (D) UMAP display of cycling lymphocytes from people in the healthy control group (n = 5), patients with SD without MAS (n = 10), and patients with MAS (n = 9). (E) Feature plot illustrating the expression of lineage and phenotypic markers in cells from patients with MAS. Cell populations are as defined in panel D. (F) Heatmap display of gene expression in cycling lymphocytes and major T and NK cell subsets in patients with MAS. Each column represents data from a single patient. Genes were selected from the leading edge of GSEA comparing cycling lymphocytes and all other cell subsets. (G) Quantification of average IFNG expression in indicated immune cell subsets in patients with MAS. Cycling lymphocytes were shown as a group and as individual subsets of T cells and NK cells. (H) Feature plot illustrating expression of IFNG in cycling lymphocytes from patients with MAS.
Figure 4
Figure 4. Flow cytometry analysis of CD38+HLA-DR+ lymphocyte subsets.
(A) Quantification of CD38+HLA-DR+CD8+ T cells, (B) CD38+HLA-DR+CD4+ T cells, and (C) CD38+HLA-DR+C56+ NK cells in healthy children (n = 10), and patients with nonsystemic JIA (n = 15), inactive SD (n = 11), active SD without MAS (n = 11), or active SD with MAS (n = 9). (D) Receiver operator characteristic curve illustrating the utility of using CD38+HLA-DR+ lymphocytes (as a percentage of T cell or NK cell pool) in distinguishing cases of SD-associated MAS (n = 9) from patients with active SD without MAS (n = 11). (E) Quantification and (F) representative flow cytometry plot of CD38+HLA-DR+ lymphocyte subsets in 6 patients during MAS and after resolution of MAS. Statistical analysis: Bars in panels AC represent the median and error bars indicate interquartile range. Kruskal-Wallis test was used for comparison of multiple groups and Dunn’s correction was applied for the comparisons with the control group (panels AC). Wilcoxon signed-rank test was used for panel E. *P < 0.05, **P < 0.01, ***P < 0.001, ***P < 0.0001.
Figure 5
Figure 5. Quantification of CD38+HLA-DR+ lymphocytes in pediatric inflammatory conditions.
(A) Quantification of CD38+HLA-DR+ CD8+ T cells, (B) CD38+HLA-DR+ CD4+ T cells, and (C) CD38+HLA-DR+ C56+ NK cells in healthy children (n = 11), healthy adults (n = 10), and patients with SD-associated MAS (n =9; as displayed in Figure 4), MIS-C associated with COVID-19 (n = 20), Kawasaki disease (n = 10), viral infections (n = 18), JDM (n = 11), and SLE (n = 9), or MAS secondary to other causes (n = 6). Statistical analysis: Bars represent median and error bars indicate interquartile range. Kruskal-Wallis test was used for comparison of multiple groups and Dunn’s correction was applied for the comparisons with the control group. *P < 0.05, **P < 0.01, ***P < 0.001, ***P < 0.0001.
Figure 6
Figure 6. Generation of CD38+HLA-DR+ T lymphocytes and NK cells in vitro.
(A) Representative flow cytometry plot and (B) quantification of CD38+HLA-DR+ lymphocyte subsets induced by coculturing PBMC from healthy controls (n = 5) with the indicated cytokine combinations for 2 days. Each color in panel B represents a unique healthy donor. Results for each healthy donor represent the average of duplicate samples. (C) Plasma IL-15 levels in healthy controls (n = 19), and patients with nonsystemic JIA (n = 10), inactive SD (n = 11), active SD without MAS (n = 11), or active SD with MAS (n = 11) as measured by proximity extension assay. (D) Representative flow cytometry plots and (E) Quantification of CD38+HLA-DR+ lymphocyte subsets induced by IL-15 (10 ng/mL) and IFN-α2 (10 ng/mL) in PBMCs (from 4–5 healthy donors) pretreated with ruxolitinib (100 nM), tofacitinib (100 nM), rapamycin (1 μM), or DMSO (vehicle control). Inhibitors or DMSO were added 30 minutes prior to IL-15 and IFN-α2 stimulation, and analysis was performed after 2 days. Statistical analysis: Bars represent median and error bars represent interquartile range. Kruskal-Wallis test was used for comparison of multiple groups in panels B and C, and Dunn’s correction was applied for the indicated comparisons. Mann-Whitney U test was applied for panel E. *P < 0.05, **P < 0.01.

References

    1. Petty RE, et al. International League of Associations for Rheumatology classification of juvenile idiopathic arthritis: second revision, Edmonton, 2001. J Rheumatol. 2004;31(2):390–392. - PubMed
    1. Still GF. On a form of chronic joint disease in children. Med Chir Trans. 1897;80:47-60.9. - PMC - PubMed
    1. Bywaters EG. Still’s disease in the adult. Ann Rheum Dis. 1971;30(2):121–133. doi: 10.1136/ard.30.2.121. - DOI - PMC - PubMed
    1. Cabane J, et al. Comparison of long term evolution of adult onset and juvenile onset Still’s disease, both followed up for more than 10 years. Ann Rheum Dis. 1990;49(5):283–285. doi: 10.1136/ard.49.5.283. - DOI - PMC - PubMed
    1. Davies R, et al. Mortality rates are increased in patients with systemic juvenile idiopathic arthritis. Arch Dis Child. 2017;102(2):206–207. doi: 10.1136/archdischild-2016-311571. - DOI - PubMed

Publication types