. 2023 Nov 15;133(22):e170169.
doi: 10.1172/JCI170169.

Hyperphosphorylation of BCL-2 family proteins underlies functional resistance to venetoclax in lymphoid malignancies

Affiliations

Hyperphosphorylation of BCL-2 family proteins underlies functional resistance to venetoclax in lymphoid malignancies

Stephen Jun Fei Chong et al. J Clin Invest. .

Abstract

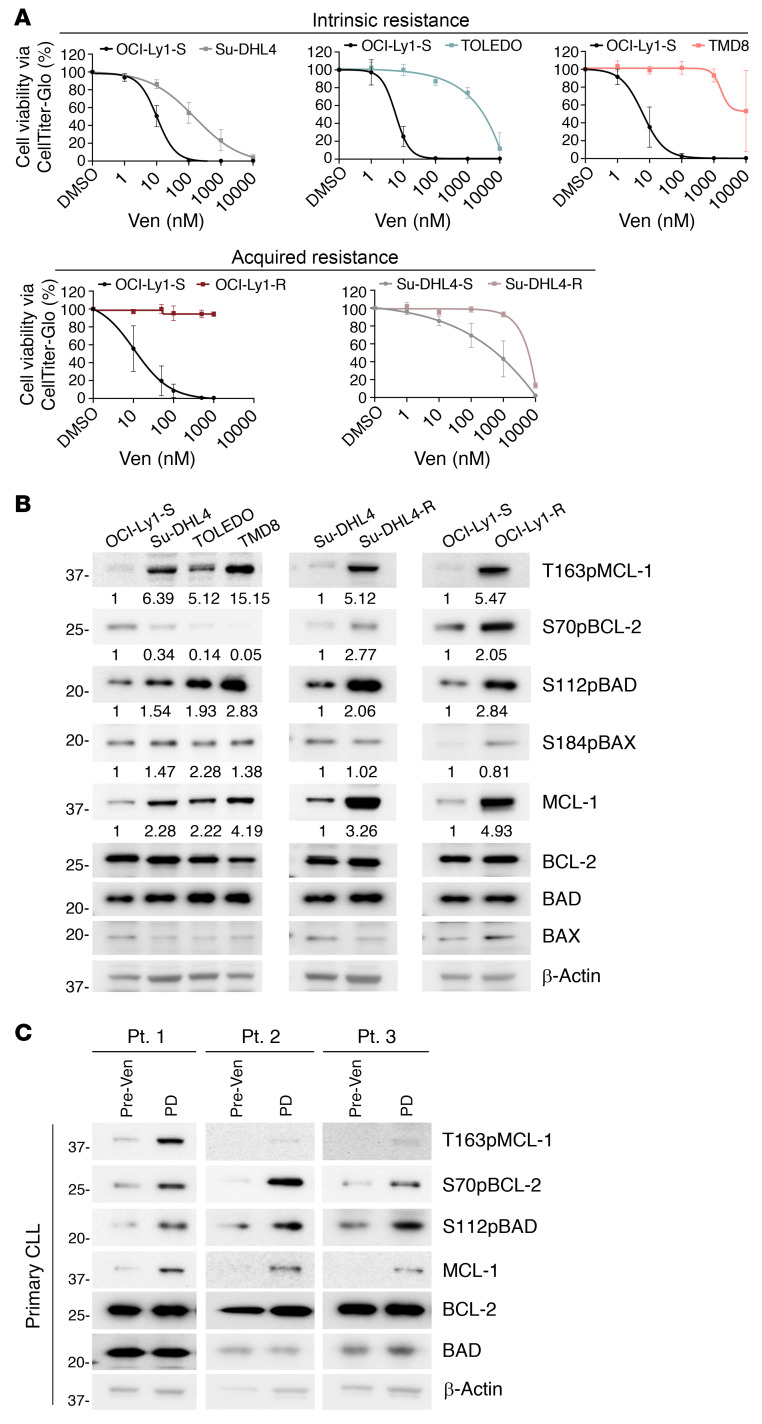
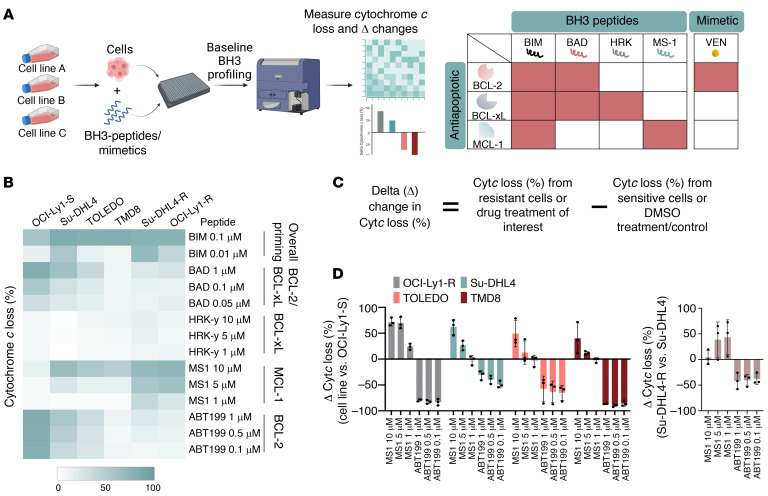
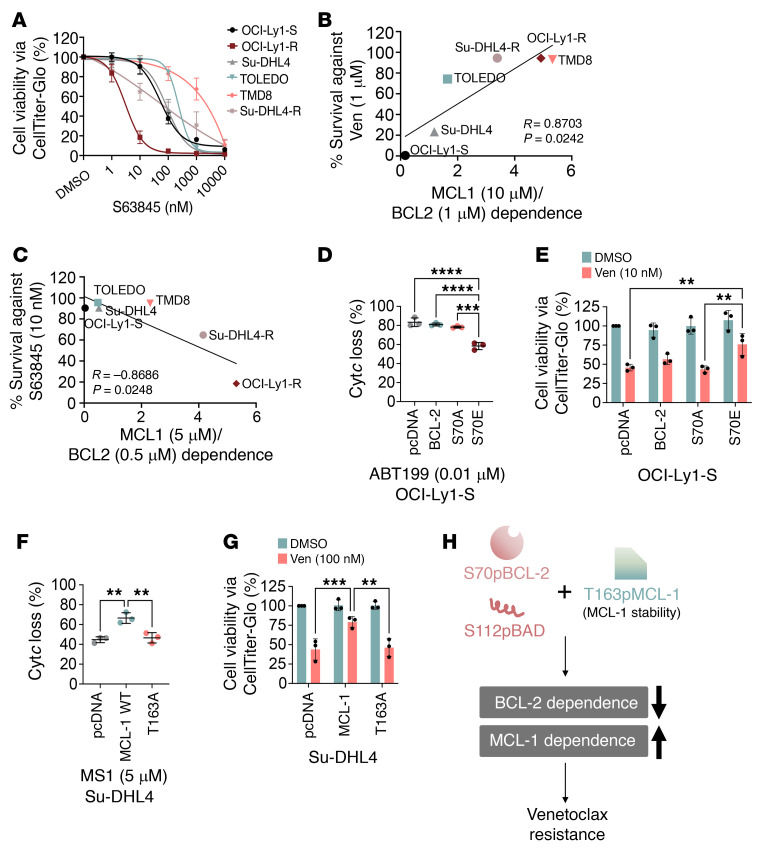
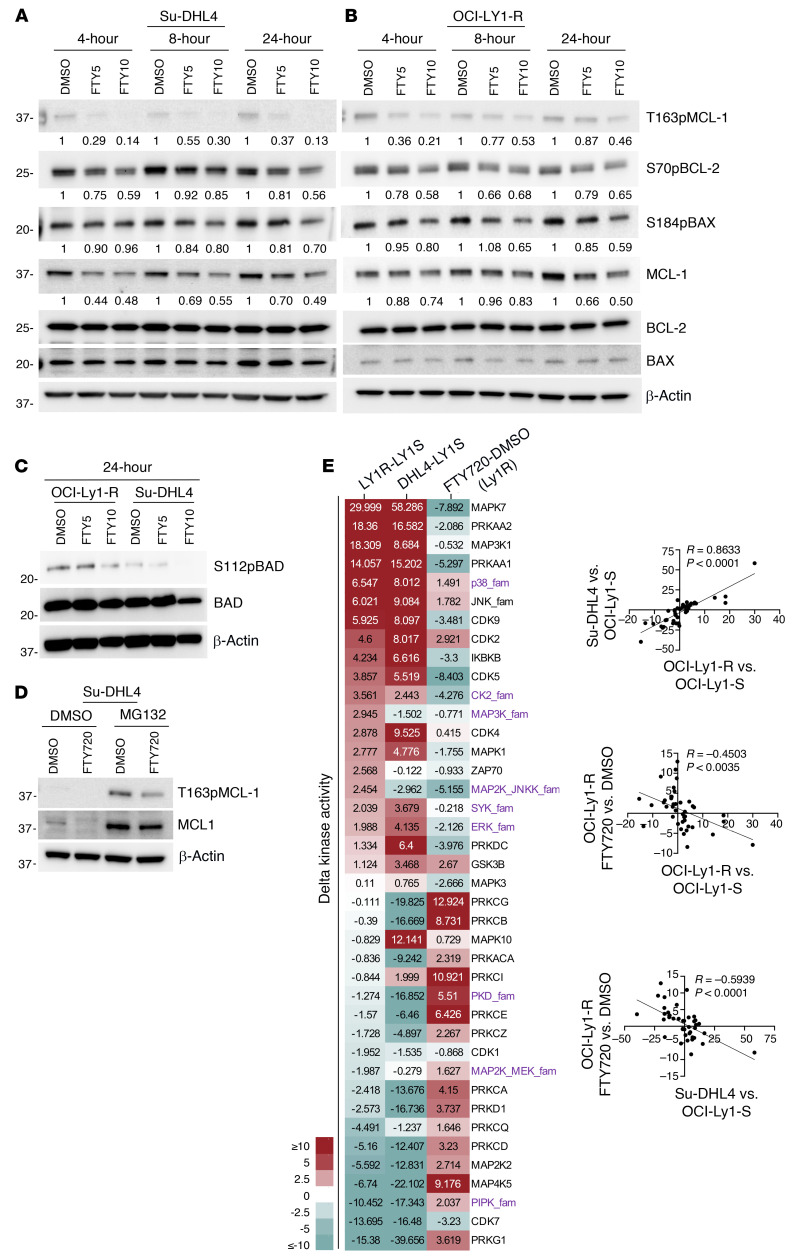
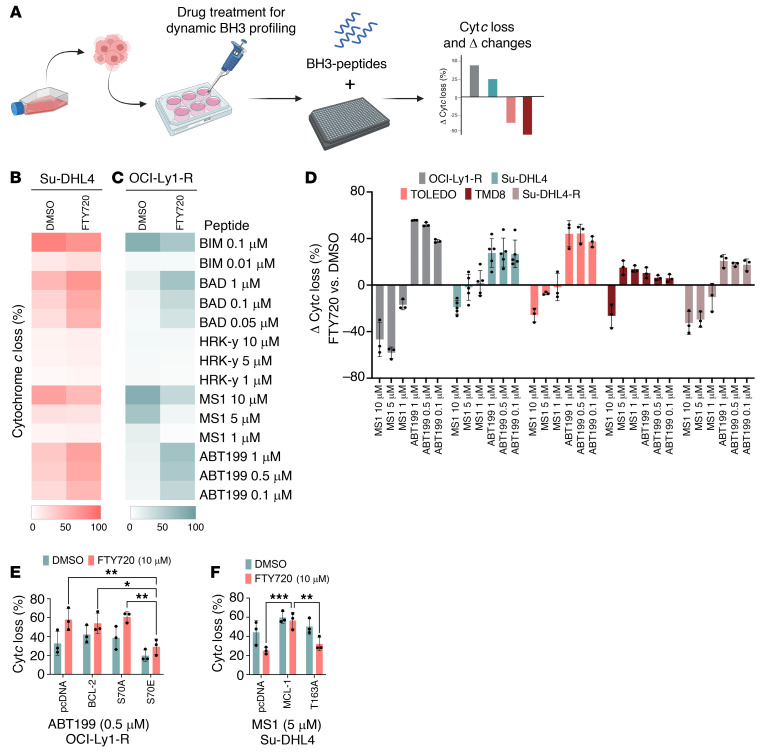
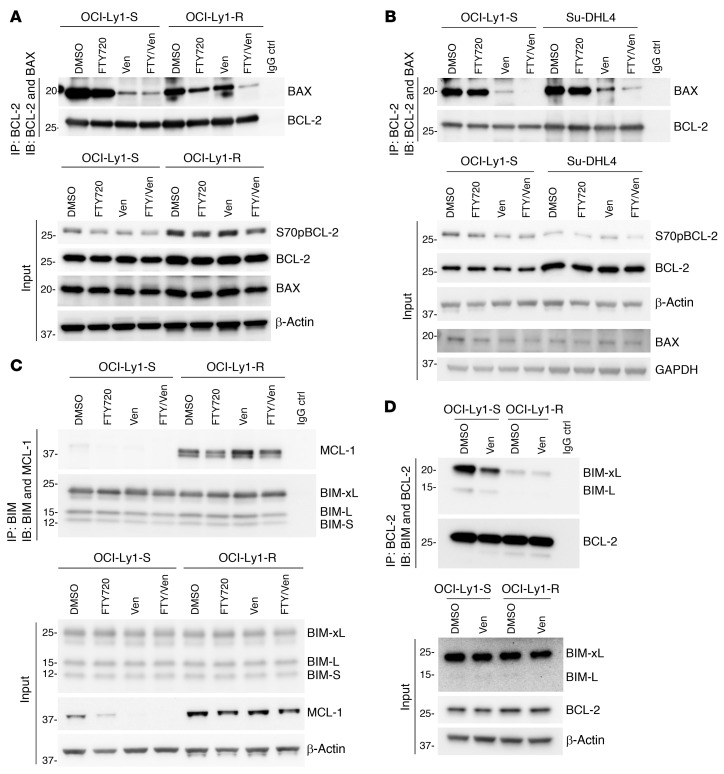
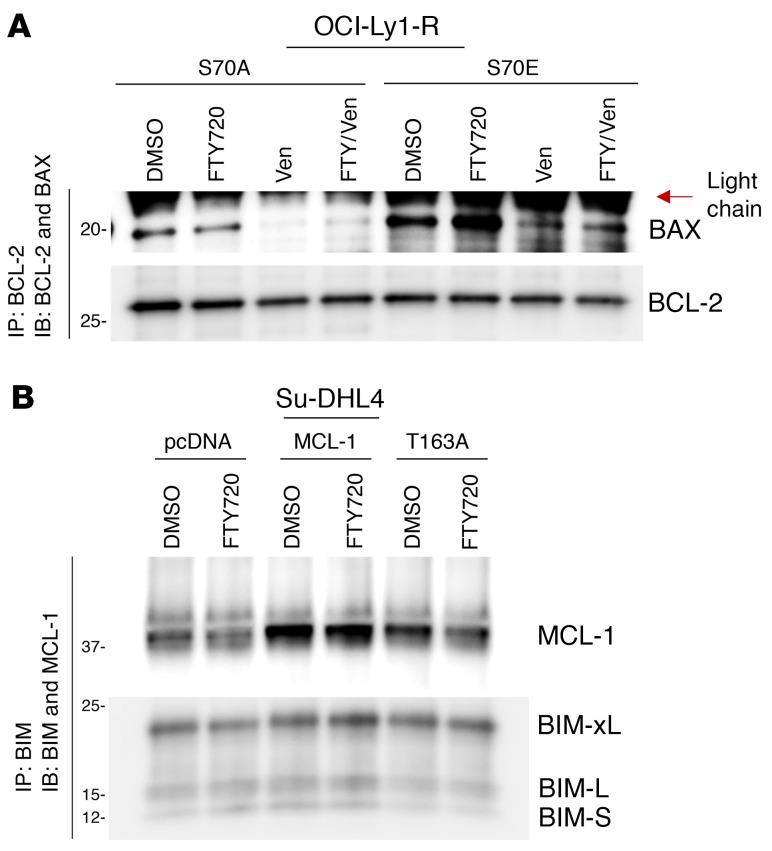
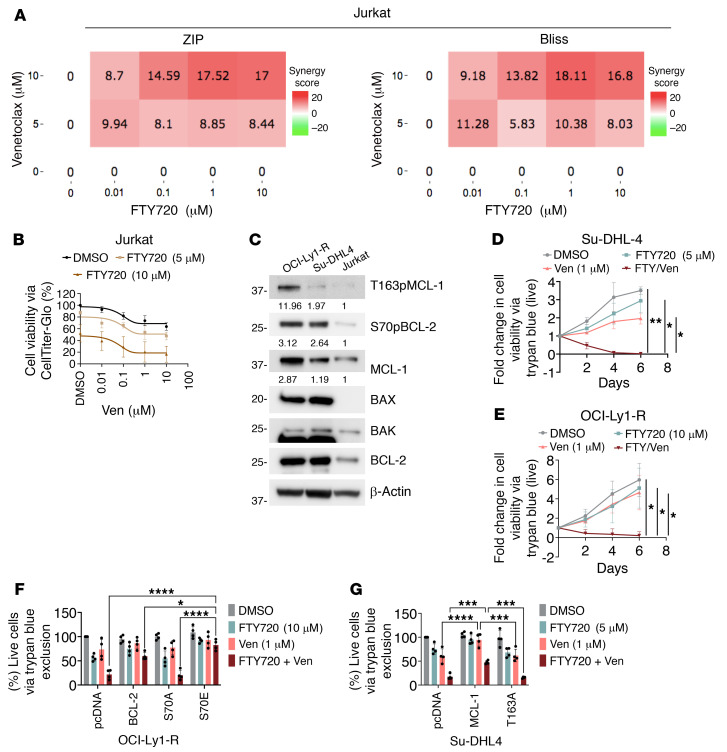
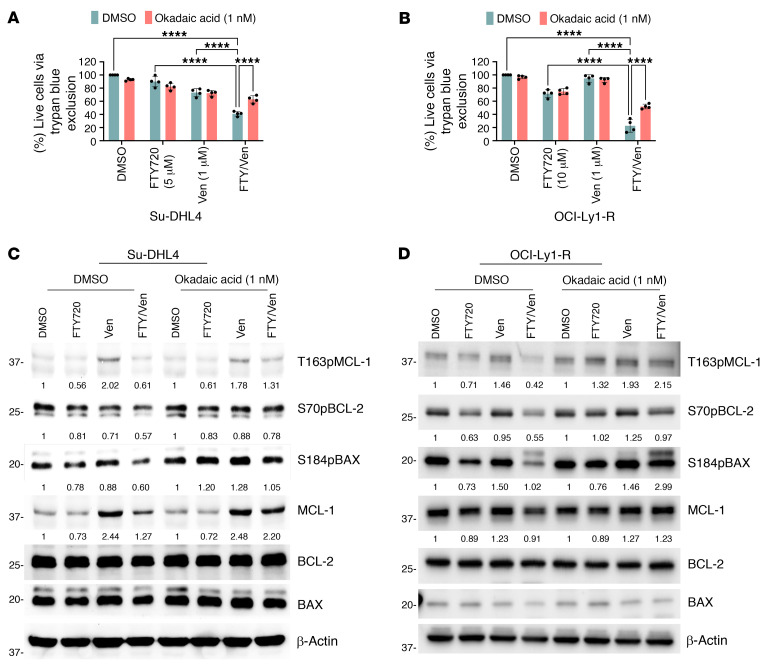
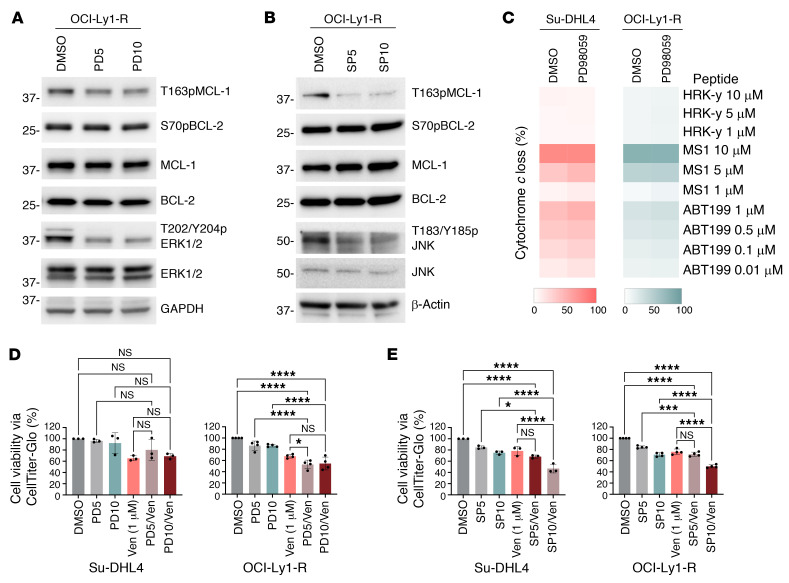
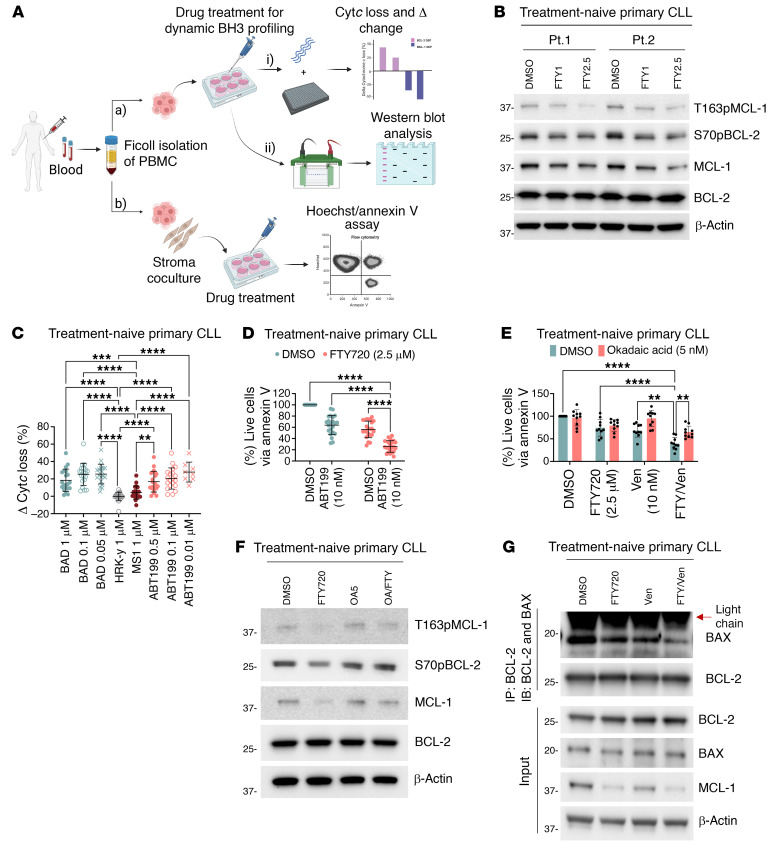
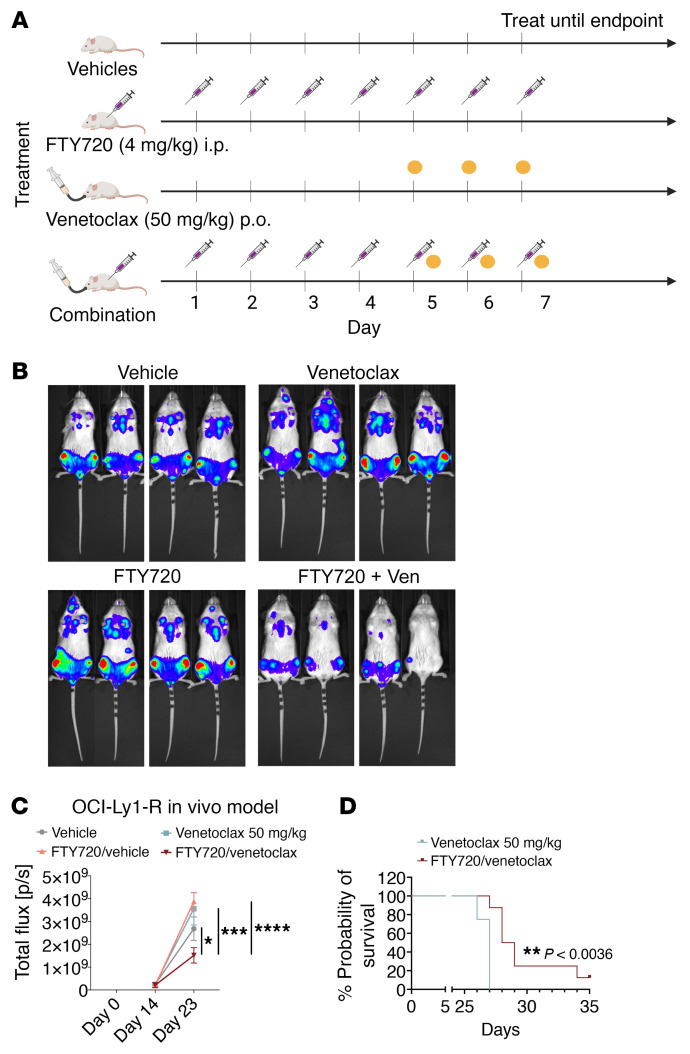
The B cell leukemia/lymphoma 2 (BCL-2) inhibitor venetoclax is effective in chronic lymphocytic leukemia (CLL); however, resistance may develop over time. Other lymphoid malignancies such as diffuse large B cell lymphoma (DLBCL) are frequently intrinsically resistant to venetoclax. Although genomic resistance mechanisms such as BCL2 mutations have been described, this probably only explains a subset of resistant cases. Using 2 complementary functional precision medicine techniques - BH3 profiling and high-throughput kinase activity mapping - we found that hyperphosphorylation of BCL-2 family proteins, including antiapoptotic myeloid leukemia 1 (MCL-1) and BCL-2 and proapoptotic BCL-2 agonist of cell death (BAD) and BCL-2 associated X, apoptosis regulator (BAX), underlies functional mechanisms of both intrinsic and acquired resistance to venetoclax in CLL and DLBCL. Additionally, we provide evidence that antiapoptotic BCL-2 family protein phosphorylation altered the apoptotic protein interactome, thereby changing the profile of functional dependence on these prosurvival proteins. Targeting BCL-2 family protein phosphorylation with phosphatase-activating drugs rewired these dependencies, thus restoring sensitivity to venetoclax in a panel of venetoclax-resistant lymphoid cell lines, a resistant mouse model, and in paired patient samples before venetoclax treatment and at the time of progression.

Keywords: Apoptosis survival pathways; Hematology; Oncology; Phosphoprotein phosphatases; Protein kinases.


Conflict of interest statement

Conflict of interest: MSD has received institutional research funding from AbbVie, AstraZeneca, Ascentage Pharma, Genentech, MEI Pharma, Novartis, Surface Oncology, and TG Therapeutics as well as personal consulting income from AbbVie, Adaptive Biosciences, Aptitude Health, Ascentage Pharma, AstraZeneca, BeiGene, Bristol Myers Squibb, Celgene, Curio Science, Eli Lilly, Genentech, Genmab, Janssen, Merck, Nuvalent, ONO Pharmaceuticals, Research to Practice, Secura Bio, TG Therapeutics, and Takeda. CJW holds equity in BioNTech and receives research funding from Pharmacyclics. JNA consults for AbbVie, Genentech, and Ascentage and receives honoraria from Abbvie and Genentech. CSM serves on the scientific advisory board of Adicet Bio and discloses receiving consultant/honoraria from Genentech, Fate Therapeutics, Ionis Pharmaceuticals, FIMECS, Secura Bio, and Oncopeptides and research funding from Janssen/Johnson & Johnson, TEVA, EMD Serono, AbbVie, Arch Oncology, Karyopharm, Sanofi, Nurix, BMS, H3 Biomedicine/Eisai, Springworks, and Novartis. RRF consults for AbbVie, AstraZeneca, Beigene, Genentech, Incyte, Janssen, Pharmacyclics, Morphosys, Sanofi, MEI Pharma, and X4 Pharmaceuticals. BCG consults for and serves on the advisory board of MSD, Merck KGaA, Novartis, Adagene, and Bayer Healthcare and receives research funding from Taiho Pharmaceuticals, Otsuka pharmaceuticals, Adagene, Bayer Healthcare, Alx Oncology, Sanofi, and Amgen.

Figures

Figure 1
Figure 1. Venetoclax-resistant malignant lymphoid cells display hyperphosphorylated BCL-2 family proteins.
(A) Cell viability of intrinsically resistant Su-DHL4 (n = 3), TOLEDO (n = 4), and TMD8 (n = 4) cells or acquired-resistance OCI-Ly1-R (n = 3) and Su-DHL4-R (n = 3) cells in comparison with OCI-Ly1-S or Su-DHL4 cells following treatment with increasing concentrations of ABT199/venetoclax (Ven) at 48 hours, measured by CTG assay. (B) Western blots showing increased T163pMCL-1, S70pBCL-2, S112pBAD, and MCL-1 levels in intrinsically resistant and acquired-resistance malignant lymphoid cells. Bands were quantified by ImageJ software (NIH). Normalized expression values derived from T163pMCL-1/β-actin, S70pBCL-2/BCL-2, S112pBAD/BAD, and MCL-1/β-actin are displayed below the targets in this and subsequent specific figures. (C) Western blots showing increased T163pMCL-1 (n = 8), S70pBCL-2 (n = 9), S112pBAD (n = 6), and MCL-1 (n = 9) levels in primary CLL samples from patients on venetoclax with progressive disease (PD) compared with paired pre-venetoclax primary CLL patient samples (human, in vivo). Quantification is displayed in Supplemental Figure 1C. The sample number is different due to sample availability. PT, patient.
Figure 2
Figure 2. Venetoclax-resistant malignant lymphoid cells display increased MCL-1 dependence and decreased BCL-2 dependence.
(A) Diagram showing the baseline BH3-profiling technique, in which cells are required to be incubated with BH3 peptides/mimetic to induce Cytc release. Heatmap demonstrates the sensitivity/dependence of antiapoptotic BCL-2 family members toward their specific BH3 peptides/mimetic, as represented by the intensity of Cytc release in red. Higher Cytc release indicates a greater dependence on an antiapoptotic protein(s). The diagram was generated using BioRender software. (B) Baseline BH3 profiling of malignant lymphoid cell lines, depicted by a heatmap of Cytc loss intensity following individual BH3 peptides or ABT199/venetoclax incubation (n = 3). Higher Cytc release by MS1 indicates MCL-1 dependence, and lower Cytc release by BAD or venetoclax/ABT199 indicates lower BCL-2 dependence. (C) Delta (Δ) changes in the percentage of Cytc loss were calculated by deducting the percentage of Cytc loss of sensitive cell lines from that of resistant cell lines or the percentage of Cytc loss of vehicle-treated cells from that of drug-treated cells. (D) Δ Changes in the percentage of Cytc loss indicate an increase in MCL-1 dependency and a drop in BCL-2 dependency. A positive Δ change in the percentage indicates increased net Cytc loss, and a negative Δ change in the percentage indicates decreased net Cytc loss.
Figure 3
Figure 3. Changes in antiapoptotic protein dependencies are required for venetoclax resistance.
(A) Viability of OCI-Ly1-R, Su-DHL4-R, Su-DHL4, TOLEDO, TMD8, and OCI-Ly1-S cells following treatment with increasing concentrations of S63845 (MCL-1 inhibitor), measured by CTG assay. Tukey’s multiple-comparison test was used. (B) Pearson’s correlation between survival percentage against ABT199/venetoclax treatment and MCL-1/BCL-2 dependence ratio. Cells with high MCL-1 but low BCL-2 dependence survived better against venetoclax. (C) Pearson’s correlation between percentage survival against S63845 treatment and MCL-1/BCL-2 dependence ratio. Cells with low MCL-1 but high BCL-2 dependence survived better against S63845. (D) ABT199/venetoclax-induced Cytc percentage loss following transient transfection with empty vector (pcDNA3.1), WT BCL-2, p.S70A, or p.S70E mutants in OCI-Ly1-S cells (n = 3). Tukey’s multiple-comparison test was used. (E) Cell viability of pcDNA3.1 (pcDNA), WT BCL-2, p.S70A (S70A), or p.S70E (S70E) transiently transfected OCI-Ly1-S cells following treatment with 10 nM ABT199/venetoclax for 48 hours (n = 3). Šidák’s multiple-comparison test was used. (F) MS1-induced Cytc percentage loss following transient transfection with pcDNA3.1, WT MCL-1, or the p.T163 mutant in Su-DHL4 cells (n = 3). Dunnett’s multiple-comparison test was used. (G) Cell viability of pcDNA3.1, WT MCL-1 or p.T163A transient transfected Su-DHL4 cells following treatment with 100 nM ABT199/venetoclax for 48 hours (n = 3). Šidák’s multiple-comparison test was used. (H) Diagram showing that increased S70pBCL-2, T163pMCL-1, and S112pBAD induced a dependence switch from BCL-2 to MCL-1 for venetoclax resistance. The diagram was generated using Microsoft Powerpoint software. **P < 0.01, ***P < 0.001, and ****P < 0.0001.
Figure 4
Figure 4. The phosphatase activator FTY720 reduces BCL-2 family protein phosphorylation.
(A and B) Western blots showing the reduction of T163pMCL-1, S70pBCL-2, S184pBAX, and MCL-1 in Su-DHL4 and OCI-Ly1-R cells following treatment with FTY720 (5–10 μM) for 4, 8, and 24 hours. (C) Western blots showing the reduction of S112pBAD in Su-DHL4 and OCI-Ly1-R cells following treatment with 5–10 μM FTY720 (FTY5 and FTY10) for 24 hours. (D) Western blots showing the reduction of T163pMCL-1 but not MCL-1 in Su-DHL4 cells following pretreatment with the proteasomal inhibitor MG132 (5 μM) for 4 hours and treatment with FTY720 (10 μM) for 4 hours. (E) Δ Kinase enzymatic activities of OCI-Ly1-R minus OCI-Ly1-S, Su-DHL4 minus OCI-Ly1-S, and OCI-Ly1-R treated with FTY720 minus DMSO, measured by HT-KAM assay. Pearson’s correlation coefficient R and P values were measured between the different Δ kinase enzymatic activity columns.
Figure 5
Figure 5. Reduction in BCL-2 family protein phosphorylation rewires resistant cells to BCL-2 dependence.
(A) Diagram demonstrating the DBP technique. Cells were treated with the drug of interest prior to BH3 profiling. DBP identifies whether a drug of interest changes the antiapoptotic dependence(ies) of cells. The diagram was generated using BioRender software. (B and C) DBP of Su-DHL4 (n = 5) and OCI-Ly1-R (n = 3) cells following treatment with FTY720 (10 μM) for 4 hours. (D) Δ Changes in the percentage of Cytc loss between FTY720 and DMSO treatments in the acquired-resistance and intrinsically resistant cell lines (n = 5 for Su-DHL4, n = 3 for all other cell lines). (E) Percentage of Cytc loss with ABT199/venetoclax (0.5 μM) following a 4-hour treatment with FTY720 in pcDNA3.1-, WT BCL-2–, p.S70A-, or p.S70E-transfected OCI-Ly1-R cells (n = 3). Šidák’s multiple-comparison test was used. (F) Percentage of Cytc loss with MS1 peptide (5 μM) following a 4-hour FTY720 treatment in pcDNA3.1-, WT MCL-1–, or p.T163A-transfected Su-DHL4 cells (n = 3). Dunnett’s multiple-comparison test was used. *P < 0.05, **P < 0.01, and ***P < 0.001.
Figure 6
Figure 6. Changes in antiapoptotic dependencies involve the disruption of pro- and antiapoptotic protein interactions.
(A and B) Co-IP of BCL-2 and immunoblotting (IB) of BAX and BCL-2 in OCI-Ly1-R, Su-DHL4, and OCI-Ly1-S cells following a 4-hour pretreatment with FTY720 (10 μM) and a subsequent 4-hour cotreatment with ABT199/venetoclax (100 nM). The venetoclax concentration was based on the lowest effective dose used for BH3 profiling. Input shows S70pBCL-2, BCL-2, BAX, β-actin, and/or GAPDH. The same sample for input in Figure 6B was run in 2 separate gels. (C) Co-IP of BIM isoforms and immunoblots of MCL-1 and BIM isoforms in OCI-Ly1-R and OCI-Ly1-S cells following a 4-hour pretreatment with FTY720 (10 μM) and a subsequent 4-hour cotreatment with ABT199/venetoclax (100 nM). Input shows BIM isoforms, MCL-1, and β-actin. (D) Co-IP of BCL-2 and immunoblots of BIM isoforms and BCL-2 in OCI-Ly1-R and OCI-Ly1-S cells following a 4-hour treatment with ABT199/venetoclax (100 nM). Input shows BIM isoforms, BCL-2, and β-actin. Ctrl, control.
Figure 7
Figure 7. Changes in pro- and antiapoptotic protein interactions are governed by BCL-2 family protein phosphorylation.
(A) Co-IP of BCL-2 and immunoblots of BAX and BCL-2 in p.S70A- or p.S70E-transfected OCI-Ly1-R cells following a 4-hour pretreatment with FTY720 (10 μM) and a subsequent 4-hour cotreatment with ABT199/venetoclax (100 nM). (B) Co-IP of BIM isoforms and immunoblots of MCL-1 and BIM isoforms in pcDNA3.1-, WT MCL-1–, or p.T163A-transfected Su-DHL4 cells following a 4-hour treatment with FTY720 (10 μM).
Figure 8
Figure 8. Treatment with FTY720 resensitizes resistant cells to venetoclax.
(A and B) Viability of Su-DHL4 (n = 6), TOLEDO (n = 3), and TMD8 (n = 4) cells or OCI-Ly1-R (n = 6) cells following a 4-hour pretreatment with FTY720 and subsequent 48 hours of increasing concentrations of cotreatment with ABT199/venetoclax or Su-DHL4-R (n = 3) following a 4-hour pretreatment with FTY720 and 24 hours of increasing concentrations of cotreatment with ABT199/venetoclax, measured by CTG assay. Tukey’s multiple-comparison tests were used. *P < 0.05 and ****P < 0.0001. (C and D) Synergy scores for Su-DHL4 and OCI-Ly1-R cells were computed by SynergyFinder based on ZIP and Bliss Synergy models. Red indicates synergism and green indicates antagonism.
Figure 9
Figure 9. Rewiring to BCL-2 dependence and resensitization to venetoclax-induced cell death require a reduction of BCL-2 family protein phosphorylation.
(A) Synergy scores for Jurkat were computed by SynergyFinder based on ZIP and Bliss Synergy models. Red indicates synergism and green indicates antagonism. (B) Viability of Jurkat (n = 3) cells following a 4-hour pretreatment with increasing concentrations of FTY720 and subsequent 48 hours of increasing concentrations of cotreatment with ABT199/venetoclax, measured by CTG assay. (C) Western blots showing the different levels of T163pMCL-1, S70pBCL-2, MCL-1, BAX, BAK, and BCL-2 in OCI-Ly1-R, Su-DHL4, and Jurkat cells. (D and E) Viability of live Su-DHL4 (n = 3) and OCI-Ly1-R (n = 4) cells following a 4-hour pretreatment with FTY720 and a subsequent cotreatment with ABT199/venetoclax at a time-chase of 2, 4, and 6 days, measured by trypan blue exclusion assay. The drug concentrations used were based on the highest/best synergy score. Tukey’s multiple-comparison test was used to determine significance. (F) Viability of live pcDNA3.1, WT BCL-2, p.S70A, and p.S70E transiently transfected OCI-Ly1-R cells following pretreatment with FTY720 (10 μM) for 4 hours and a subsequent cotreatment with ABT199/venetoclax (1 μM) for 48 hours, measured by trypan blue exclusion assay (n = 4). Dunnett’s multiple-comparison test was used. (G) Viability of live pcDNA3.1, WT MCL-1, and p.T163A transiently transfected Su-DHL4 cells following pretreatment with FTY720 (5 μM) for 4 hours and a subsequent cotreatment with ABT199/venetoclax (1 μM) for 24 hours, measured by trypan blue exclusion assay (n = 4). Dunnett’s multiple-comparison test was used. *P < 0.05, **P < 0.01, ***P < 0.001, and ****P < 0.0001.
Figure 10
Figure 10. Reduced BCL-2 family protein phosphorylation is a function of PP2A.
(A and B) Viability of Su-DHL4 and OCI-Ly1-R cells following pretreatment with OA (1 nM) for 2 hours followed by FTY720 (10 μM) for 4 hours and ABT199/venetoclax (1 μM) for 48 hours cotreatments, measured by trypan blue exclusion assay. (n = 4). Šidák’s multiple-comparison tests was used. ****P < 0.0001. (C and D) Western blots showing reversal of T163pMCL-1, S70pBCL-2, S184pBAX, and MCL-1 reductions in Su-DHL4 or OCI-Ly1-R cells following pretreatment with OA (1 nM) for 2 hours followed by FTY720 (10 μM) for 4 hours and ABT199/venetoclax (1 μM) for 24 hours of cotreatment.
Figure 11
Figure 11. Inhibiting kinases singly fails to resensitize resistant cells to venetoclax.
(A) Western blots showing unapparent changes in T163pMCL-1, S70pBCL-2, and MCL-1 levels in OCI-Ly1-R cells following treatment with increasing concentrations of the MEK/ERK1/2 inhibitor PD98059 (5 μM and 10 μM) for 24 hours. A reduction in T202/Y204pERK1/2 was used as a positive control. (B) Western blots showing unapparent changes of T163pMCL-1, S70pBCL-2, and MCL-1 in OCI-Ly1-R cells following increasing treatment concentrations of the JNK inhibitor SP600125 (5 μM and 10 μM) for 24 hours. A reduction in T183/Y185pJNK was used as a positive control. (C) DBP of Su-DHL4 and OCI-Ly1-R cells following treatment with PD98059 (10 μM) for 4 hours (n = 4). (D) Viability of Su-DHL4 (n = 3) and OCI-Ly1-R (n = 4) cells following pretreatment with PD98059 (5–10 μM) for 4 hours and subsequent cotreatment with ABT199/venetoclax (1 μM) for 48 hours, as measured by CTG assay. Šidák’s multiple-comparison test was used. (E) Viability of Su-DHL4 (n = 3) and OCI-Ly1-R (n = 4) cells following pretreatment with SP600125 (5–10 μM) for 4 hours and cotreatment with ABT199/venetoclax (1 μM) for 48 hours, as measured by CTG assay. Šidák’s multiple-comparison test was used. *P < 0.05, ****P < 0.0001.
Figure 12
Figure 12. FTY720-induced PP2A activation displays similar cytotoxic effects on treatment-naive primary CLL cells.
(A) Ficoll isolation of PBMCs from 28 treatment-naive patients with CLL. Samples were divided for DBP and Western blotting following ex vivo FTY720 treatment or were cocultured with NKTert stromal cells for cell viability measurement following FTY720 and ABT199/venetoclax cotreatments. The number of experiments performed was based on patient sample availability. The diagram was generated using BioRender software. (B) Western blots showing decreased T163pMCL-1 (n = 12), S70pBCL-2 (n = 18), and MCL-1 (n = 18) in treatment-naive primary CLL cells following increasing treatment concentrations of FY720 (1μM and 2.5 μM) for 4 hours. S112pBAD and S184pBAX were not evaluated because of insufficient samples. Quantification is displayed in Supplemental Figure 8A. (C) Δ Changes in the percentage of Cytc loss between ex vivo FTY720 (2.5 μM) and DMSO treatments for 4 hours in treatment-naive primary CLL cells (n = 20) indicated increased BCL-2 dependence. Šidák’s multiple-comparison test was used. (D) Viability of treatment-naive primary CLL cells following an ex vivo 4-hour pretreatment with 2.5 μM (n = 22) FTY720 and a subsequent 24-hour cotreatment with 10 nM venetoclax, as measured by annexin V/Hoechst assay. Šidák’s multiple-comparison test was used. (E) Viability of treatment-naive primary CLL cells (n = 10) following ex vivo pretreatment with OA (5 nM) for 2 hours followed by FTY720 (2.5 μM) for 4 hours and ABT199/venetoclax (10 nM) for 48 hours of cotreatment, as measured by annexin V/Hoechst assay. Šidák’s multiple-comparison test was used. (F) Western blots showing reversal of T163pMCL-1, S70pBCL-2, and MCL-1 reductions in treatment-naive primary CLL cells (n = 8) following ex vivo pretreatment with OA (5 nM) for 2 hours followed by FTY720 (2.5 μM) cotreatment for 4 hours. Quantification is displayed in Supplemental Figure 10A. (G) Co-IP of BCL-2 and immunoblotting of BAX and BCL-2 in treatment-naive primary CLL cells (n = 3) following ex vivo 4-hour pretreatment with FTY720 (2.5 μM) and 1-hour cotreatment with ABT199/venetoclax (10 nM). Quantification is displayed in Supplemental Figure 10B. **P < 0.01, ***P < 0.001, and ****P < 0.0001.
Figure 13
Figure 13. Hyperphosphorylation of BCL-2 family protein–driven venetoclax resistance in patients with progressive primary CLL could be targeted by PAD.
(A) Thirteen paired pre-venetoclax and PD patient primary CLL cells were used for specified experiments. The number of experiments performed is based on patient sample availability. (B) Δ Changes of the percentage of Cytc loss between paired PD and pre-venetoclax patient primary CLL cells (n = 12) indicated an increase in MCL-1 and a drop in BCL-2 dependencies. (mean + SD). Šidák’s comparisons test was used. (C) Western blots of PD samples treated ex vivo with FTY720 (2.5 μM) for 4 hours showed decreased T163pMCL-1 (n = 9), S70pBCL-2 (n = 10), MCL-1 (n = 10), S112pBAD (n = 7), and S184pBAX (n = 7). Paired t tests were used. (D) Δ Changes in the percentage of Cytc loss between FTY720 (2.5 μM) and DMSO ex vivo treatments in PD primary CLL cells (n = 12) indicated an increase in BCL-2 and a drop in MCL-1 dependencies. Data represent the mean + SD. Šidák’s multiple-comparison test was used. (E) Viability of PD primary CLL (n = 13) cells following a 4-hour ex vivo pretreatment with FTY720 (2.5 μM) and a 24-hour cotreatment with venetoclax (10 nM), measured by annexin V/Hoechst assay. Šidák’s multiple-comparison test was used. (F) HT-KAM analyses of 2 PD primary CLL samples treated ex vivo with FTY720 (2.5 μM) for 4 hours. Western blots show decreased S473pAKT, T202/Y204pERK1/2, and T172pAMPK levels in PD primary CLL cells following ex vivo treatment with FTY720 (2.5 μM) for 4 hours. The same samples were run on 2 separate gels. *P < 0.05, **P < 0.01, ***P < 0.001, and ****P < 0.0001.
Figure 14
Figure 14. Sequential treatment combination with FTY720 and venetoclax reduces tumor burden and prolongs the survival of mice in an OCI-Ly1-R–resistant murine model.
(A) FTY720 and venetoclax treatment schedule for NSG mice implanted with luciferase-tagged OCI-Ly1-R cells via tail-vein injection. FTY720 (4 mg/kg/day, i.p.) was administered from days 1–4 and subsequently in combination with ABT199/venetoclax (50 mg/kg/day, p.o.). The diagram was generated with BioRender software. (B) Representation of BLI of luciferase-tagged OCI-Ly1-R–implanted NSG mice subjected to the respective treatments at day 23. (C) Quantified total flux (p/s) of BLI (mean ± SEM) for luciferase-tagged OCI-Ly1-R–implanted NSG mice subjected to the respective treatments: vehicle (n = 6), venetoclax (n = 4), FTY720 (n = 8), or FTY720 plus venetoclax (n = 8). Dunnett’s multiple-comparison test was used. (D) Survival percentage probability for luciferase-tagged OCI-Ly1-R–implanted NSG mice treated with venetoclax or FTY720 plus venetoclax. The Gehan-Breslow-Wilcoxon test was used. *P < 0.05, **P < 0.01, ***P < 0.001, and ****P < 0.0001.

References

    1. Roberts AW, et al. Targeting BCL2 with venetoclax in relapsed chronic lymphocytic leukemia. N Engl J Med. 2016;374(4):311–322. doi: 10.1056/NEJMoa1513257. - DOI - PMC - PubMed
    1. Pan R, et al. Selective BCL-2 inhibition by ABT-199 causes on-target cell death in acute myeloid leukemia. Cancer Discov. 2014;4(3):362–375. doi: 10.1158/2159-8290.CD-13-0609. - DOI - PMC - PubMed
    1. Davids MS, et al. Phase I first-in-human study of venetoclax in patients with relapsed or refractory non-hodgkin lymphoma. J Clin Oncol. 2017;35(8):826–833. doi: 10.1200/JCO.2016.70.4320. - DOI - PMC - PubMed
    1. Blombery P, et al. Acquisition of the recurrent Gly101Val mutation in BCL2 confers resistance to venetoclax in patients with progressive chronic lymphocytic leukemia. Cancer Discov. 2019;9(3):342–353. doi: 10.1158/2159-8290.CD-18-1119. - DOI - PubMed
    1. Blombery P, et al. Multiple BCL2 mutations co-occurring with Gly101Val emerge in chronic lymphocytic leukemia progression on venetoclax. Blood. 2020;135(10):773–777. doi: 10.1182/blood.2019004205. - DOI - PMC - PubMed

Publication types

MeSH terms

Substances