. 2023 Sep 26;16(804):eabq5096.
doi: 10.1126/scisignal.abq5096. Epub 2023 Sep 26.

B cell responses to membrane-presented antigens require the function of the mechanosensitive cation channel Piezo1

Affiliations

B cell responses to membrane-presented antigens require the function of the mechanosensitive cation channel Piezo1

Kihyuck Kwak et al. Sci Signal. .

Abstract

The demand for a vaccine for coronavirus disease 2019 (COVID-19) highlighted gaps in our understanding of the requirements for B cell responses to antigens, particularly to membrane-presented antigens, as occurs in vivo. We found that human B cell responses to membrane-presented antigens required the function of Piezo1, a plasma membrane mechanosensitive cation channel. Simply making contact with a glass probe induced calcium (Ca2+) fluxes in B cells that were blocked by the Piezo1 inhibitor GsMTx4. When placed on glass surfaces, the plasma membrane tension of B cells increased, which stimulated Ca2+ influx and spreading of B cells over the glass surface, which was blocked by the Piezo1 inhibitor OB-1. B cell responses to membrane-presented antigens but not to soluble antigens were inhibited both by Piezo1 inhibitors and by siRNA-mediated knockdown of Piezo1. Thus, the activation of Piezo1 defines an essential event in B cell activation to membrane-presented antigens that may be exploited to improve the efficacy of vaccines.


Conflict of interest statement

Competing interests: The authors declare that they have no competing interests.

Figures

Fig. 1.
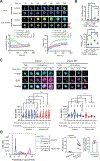
Fig. 1.. B cells flux Ca2+ in response to touch in a Piezo1-dependent manner.
(A) Purified human peripheral blood or tonsillar naive B cells were loaded with the Ca2+ indicator dye, CAL520, and placed in a glass chamber for 5 to 30 min, in the absence (Untreated) or presence of the Piezo1 inhibitor, GsMTx4. The cells were then touched with a glass probe and images were captured by confocal microscopy. Left: Images of the Ca2+ signals of two representative cells that were either untreated or treated with GsMTx4 before, during, and after contact with the glass probe. Middle: Quantification of the fold-increase in Ca2+ flux for each of the cells over the course of 40 s. Right: The average fold-change in Ca2+ flux (relative to that in cells at the time of first contact) in untreated B cells (36 cells) and GsMTx4-treated B cells (54 cells) over 13 s. Data are means ± SEM from three experiments. (B) Purified human tonsillar CD10 naïve and memory B cells were loaded with CAL520 and a red fluorescent dye as an indicator of cell volume and were placed on a planar lipid bilayer (PLB) or glass coverslips (Glass) and imaged over time by TIRFM. Top: Representative images of two B cells placed on PLB or glass and displayed as color-coded ratio images by normalizing CAL520 MFI with red fluorescence dye MFI and quantification of Ca2+ fluxes and contact areas with time after first contact with the PLB (26 cells) or glass (36 cells). Bottom: The fold-change in Ca2+ flux over time relative to the first point of contact of the cell with glass or PLB (left) and the area of contact of the indicated cells with the surface over time (right). Right: Comparison of the maximal Ca2+ flux increases of cells placed on PLB or glass, which were calculated for each cell by normalizing its maximal CAL520 MFI to the MFI upon first contact with PLB (33 cells) or glass (110 cells). Data are means ± SEM from one experiment that is representative of six experiments. (C) Tonsillar naïve B cells and memory B cells were left untreated or were pretreated with 20 μM OB-1 and analyzed by TIRFM on glass in the continued presence of OB-1. Left: Representative images of two cells (top) and quantification of changes in Ca2+ flux (bottom left) and cell area (bottom right) over time. Right: Comparison of the maximal Ca2+ flux increases and maximal area of cell spreading (Areamax) for cells placed on glass in the absence (27 cells) or presence (39 cells) of OB-1. Data are means ± SEM from one experiment that is representative of 11 experiments. (D) BCR Ramos cells or Ramos cells transduced to stably express exogeneous IgM H and L chain (Trans BCR+) were loaded with CAL520 and red fluorescence dye and placed on glass for the indicated times while Ca2+ flux were recorded. Representative ratio images (left) and quantification of fold-change in Ca2+ flux for BCR cells (31 cells) and Trans BCR+ cells (30 cells) over time. Data are means ± SEM from one experiment that is representative of three experiments. Scale bars, 5 μm. (B to D) Scale ranges of the 8-bit, color-coded image display. The kinetic data in (A) to (D) were tested for statistical significance (95% confidence interval) with the ‘compareGrowthCurves’ function (see Materials and Methods). **P ≤ 0.01, ***P ≤ 0.001, and ****P ≤ 0.0001; ns, not significant. For (B and C, right), data were analyzed by two-tailed unpaired t-test with Welch’s correction. ***P ≤ 0.001 and ****P ≤ 0.0001.
Fig. 2.
Fig. 2.. Plasma membrane tension is increases in B cells placed on glass surfaces.
(A) A schematic depiction of the tension probe, Flipper-TR, when intercalated into the plasma membranes of B cells placed on PLB, which exerts low tension (left), or on glass, which exerts high tension (right). The fluorescence lifetime of Flipper-TR is determined by FLIM imaging and calculated as fluorescence lifetime decay (τ). Flipper-TR has a short lifetime under low membrane tension and a long lifetime under high membrane tension. (B) Tonsillar naive B cells and memory B cells were untreated or pretreated with OB-1, labeled with Flipper-TR, washed, and placed on PLB (for untreated cells) or on glass (for untreated and OB-1–treated cells) and imaged by FLIM with a ZEISS 780 confocal microscope equipped with FLIM apparatus. Scale bars, 5 μm. Color-coded scale range is given. (C) Flipper-TR mean lifetime decay rate (τ) was calculated per cell under the indicated conditions with MATLAB code. Data are means ± SEM from five independent experiments and were tested by nested, one-way ANOVA. ****P ≤ 0.0001; ns, P > 0.05.
Fig. 3.
Fig. 3.. siRNA-mediated knockdown of Piezo1 inhibits B cell responses.
(A) Purified human tonsillar B cells were labeled with CAL520 and a monoclonal antibody specific for the GC B cell marker, CD10, to gate naïve and memory B cells. After 180 s of baseline recording (None, black), 15 μM Yoda1 (blue) was added to the B cells in solution, which was followed by the addition of 2 mM EGTA (red). Ca2+ signals were analyzed for 1200 s by flow cytometry. Left: Representative plot of the median CAL520 fluorescence intensity (FI) values over time. Right: Quantification of the Ca2+ influxes calculated for B cells from five donors as the fold-change in the median CAL520 FI induced by Yoda-1 relative to the baseline FI. Data are means ± SEM from five independent experiments. (B) B cells purified from human PBMCs with magnetic beads were transfected with either control siRNA (Control) or Piezo1-specific siRNA (Piezo1-KD) with a 4D Amaxa nucleofector. Left: PIEZO1 mRNA abundance was quantified by real-time qRT-PCR analysis and normalized to that of GAPDH mRNA. Middle: Representative histogram of total Piezo1 abundance by flow cytometry after immunofluorescence staining with an Alexa Fluor 647–labeled Piezo-specific antibody. Right: Quantification of Piezo1 abundance for B cells from four donors shown as the ratio of the Piezo1 abundance in Piezo1-KD cells relative to that in Control cells. Data are means ± SEM from four independent experiments. (C) Control and Piezo1-KD B cells were labeled with CAL520 and Ca2+ flux was measured over time by flow cytometry before and after the addition of 15 μM Yoda-1. Left: Representative Ca2+ curves after Yoda-1 treatment of the indicate cells. Right: Quantification of the percentage inhibition of the Ca2+ flux in Piezo1-KD cells as compared to that in Control cells obtained from six donors. Data are means ± SEM from six independent experiments. (D) Control and Piezo1-KD B cells were labeled with CAL520, and Ca2+ fluxes were measured over time by flow cytometry for cells treated with Yoda-1, anti-Ig, or ionomycin. Left: Representative Ca2+ kinetics plot with arrows marking the times, after baseline recording, when each stimulant was added. Right: Quantification of Ca2+ increases induced by Yoda1, soluble anti-Ig, or ionomycin were calculated as the ratio of the fold-changes in CAL520 MFI between Piezo1-KD and Control cells upon stimulation relative to the baseline MFI for B cells from nine donors. Data are means ± SEM from nine independent experiments. (E) Control and Piezo1-KD B cells were labeled with Flipper-TR and placed on glass and the lifetime decay of the dye was determined. Left: Two representative B cells showing lifetime decay. Right: Quantification of the lifetime decay of Flipper-TR for control (111 cells) and Piezo1-KD (177 cells) B cells. Scale bars, 5 μm. Data are means ± SEM from five independent experiments. *P ≤ 0.05, **P ≤ 0.01, and ***P ≤ 0.001; ns, not significant. Data in (A) to (C) were analyzed by one-sample t test with a hypothetical value of zero, data in (D) were analyzed by Kruskal-Wallis test, followed by Dunn’s multiple comparisons test; and data in (E) were analyzed by two-tailed, unpaired t test with Welch’s correction.
Fig. 4.
Fig. 4.. The Piezo1 agonist Yoda1 and BCR-crosslinking stimulate independent Ca2+ fluxes in B cells.
(A) Naïve B cells and memory B cells in solution were incubated with mouse monoclonal antibody (10 μg/ml) specific for human κ light chain (anti-Ig) as a surrogate soluble antigen after Yoda1 addition (Yoda1 → anti-Ig) simultaneously with Yoda1 (Yoda1 + anti-Ig), or before Yoda1 (anti-Ig → Yoda1), as indicated. Median Ca2+ fluxes are representative of three independent experiments. (B to D) Ramos cells expressing an endogenous µ HC and λ LC indicated as ‘E,’ no BCR, indicated as ‘−,’ or transduced to stably express a Trans BCR, indicated as ‘T,’ were labeled with CAL520 and Ca2+ flux was recorded by flow cytometry before and after the addition of Yoda1 or ionomycin (B), Yoda1 alone or with 1.0 µM P505-15 (C), or anti-Ig alone or with 1.0 µM P505-15 (D). The fold-change in CAL520 MFI relative to the baseline was calculated from MFIs for the baseline (50 s), Yoda-1 (180 s), or ionomycin (120 s), or from the peak MFI for soluble anti-Ig (300 s). Data are means ± SEM from more than four (B and C) and three (D) independent experiments. *P < 0.05 as determined by two-tailed, unpaired t test with Welch’s correction between BCR and Trans BCR cells and two-tailed, paired t test between anti-Ig and anti-Ig + P505-15.
Fig. 5.
Fig. 5.. Piezo1 is required for B cell responses to membrane-associated, but not soluble, anti-Ig.
(A) Naive B cells were labeled with fluorescently conjugated Fab anti-human IgΜ to label the BCR. Cells were placed on PLB alone or on PLB attached to anti-Ig for 25 min at 37°C in the absence or presence of OB-1, and images were obtained by TIRFM. Left: Representative images of BCR recruited to the contact area of four cells placed on PLB or PLB–anti-Ig acquired with a 16-bit scale. Right: Quantification of the total fluorescence intensity (TFI) of the BCRs in the contact area with the PLB for >60 cells per condition. Data are means ± SEM from two independent experiments. Scale bar, 5 µm. (B) Tonsillar naive and memory B cells isolated by negative selection with CD10 beads were labeled with a mixture of Alexa Fluor 647–conjugated goat Fab anti-human IgM and Fab anti-human IgG, placed on PLB or PLB–anti-Ig in the absence or presence of 1 mM EGTA, 5 µM GsMTx4, 20 µM OB-1, or 1 µM P505–15 (Syk inhibitor) for 20 min and fixed. Images were obtained by TIRFM and the TFI values of the BCR recruited to the cell contact area were quantified with ImageJ software for >30 cells per condition from three independent experiments. (C) Untreated or OB-1–pretreated naïve B cells were labeled with CAL520 and Ca2+ fluxes were imaged with a ZEISS 780 confocal microscope upon B cell contact with PLB–anti-Ig or after the addition of anti-Ig to B cells settled on PLB (soluble-anti-Ig) in the absence or presence of 20 µM OB-1. Left: Representative CAL520 images of four cells at the indicated times displayed as color-coded images. Scale bars, 5 μm. Intensity ranges are given. Right: The Ca2+ fluxes were quantified and are presented as the fold-increase relative to the signal of resting cells for B cells placed on PLB-anti-Ig in the presence (29 cells) or absence (38 cells) of OB-1 and for B cells stimulated with soluble anti-Ig in the presence (57 cells) or absence (36 cells) of OB-1. Data are means ± SEM from two independent experiments. (D and E) Naïve and memory B cells were incubated overnight with PLB–anti-Ig or soluble anti-Ig in the presence or absence of OB-1 (D) or GsMTx4 (E). Left: Representative flow cytometry plots of cell surface CD69 expression. Right: Quantification of the ratio of the abundance of CD69 expressed by B cells stimulated by PLB–anti-Ig or by soluble anti-Ig in the absence of OB-1 to that of stimulated cells in the presence of OB-1. Data are means ± SEM from seven donors in three independent experiments (D) or from 12 donors in five independent experiments (E). *P ≤ 0.05, **P ≤ 0.01, and ****P ≤ 0.0001; ns, P > 0.05. Data in (A) were analyzed by two-tailed unpaired t test with Welch’s correction; data in (B) were analyzed by paired t test; data in (C) were analyzed with the ‘compareGrowthCurves’ function; and data in (D) and (E) were analyzed by two-tailed Mann-Whitney test.
Fig. 6.
Fig. 6.. The siRNA-mediated reduction in Piezo1 abundance inhibits B cell responses to PLB–anti-Ig.
(A) Control and Piezo1-KD B cells were loaded with CAL520 and a red fluorescent dye, placed on PLB or PLB–anti-Ig, and Ca2+ fluxes were imaged at 37°C by TIRFM. Top: Representative images of color-coded Ca2+ signals normalized by cell volume for one representative cell for each condition. Bottom: Quantification of the dynamics of the Ca2+ fluxes (left) and contact areas (right) for Control B cells (13 cells) and Piezo1-KD cells (16 cells) placed on PLB and Control cells (26 cells) and Piezo1-KD cells (18 cells) placed on PLB-anti-Ig. Scale bars, 5 μm. Scale ranges are provided. Data are means ± SEM from five independent experiments. *P ≤ 0.05 and ****P ≤ 0.0001 as assessed by the ‘compareGrowthCurves’ function test. (B) Maximal Ca2+ increase (top) and maximal area (Areamax, bottom) were determined by calculating the fold-differences in the Ca2+ signal at the point of first contact with the PLB and at the point of maximal Ca2+ signal and contact area achieved during a 5-min incubation. *P ≤ 0.05, **P ≤ 0.01, ***P ≤ 0.001, and ****P ≤ 0.0001; ns, P > 0.05. Data were analyzed by two-tailed, unpaired t test with Welch’s correction between Control and Piezo1-KD cells and by two-tailed, paired t test between PLB and PLB-anti-Ig. Data are representative of four independent experiments. (C) BCR and F-actin recruitment to the contact area imaged by TIRFM. Control and Piezo1-KD cells labeled with Alexa Fluor 488–conjugated Fab goat anti-human IgM and IgG HC were placed on either PLB or PLB-anti-Ig for the indicted times. Fixed cells were stained with Phalloidin–Alexa Fluor 647 and imaged by TIRFM. Top: Representative images of BCR and F-actin recruited to the contact area at the indicated times for Control and Piezo1-KD cells. Bottom: Quantification of BCR (left) and F-actin (right) recruitment to the contact areas from the images for >70 cells per condition from three independent experiments. *P ≤ 0.05, **P ≤ 0.01, ***P ≤ 0.001, and ****P ≤ 0.0001 by Kruskal-Wallis test followed by Dunn’s multiple comparison tests between PLB and PLB-anti-Ig at the indicated times, as well as between Control and Piezo1-KD cells; ns, P > 0.05. (D) Control and Piezo1-KD cells were cultured for 24 hours, labeled with the cell proliferation dye, eF450, and then cultured for 5 days in chambers with PLB or PLB–anti-Ig in the absence or presence of TH medium containing anti-CD40 antibodies, IL-21, and IL-4. Left: Representative histogram of proliferation dye for each stimulation condition in Control and Piezo1-KD cells. Right: Quantification of the percentage of proliferating cells (symbol and line graph with matched donor) and the ratio of the percentage proliferation in the Piezo1-KD cells relative to that in Control cells in the same donor. Data are means ± SEM from four donors in three independent experiments. *P ≤ 0.05 as tested by one-sample t test with a theoretical mean of zero.

Similar articles

Cited by

References

    1. Kwak K, Akkaya M, Pierce SK, B cell signaling in context. Nat Immunol 20, 963–969 (2019). - PubMed
    1. Shlomchik MJ, Luo W, Weisel F, Linking signaling and selection in the germinal center. Immunological reviews 288, 49–63 (2019). - PMC - PubMed
    1. Cyster JG, Allen CDC, B Cell Responses: Cell Interaction Dynamics and Decisions. Cell 177, 524–540 (2019). - PMC - PubMed
    1. Kurosaki T, Shinohara H, Baba Y, B cell signaling and fate decision. Annu Rev Immunol 28, 21–55 (2010). - PubMed
    1. Batista FD, Harwood NE, The who, how and where of antigen presentation to B cells. Nat Rev Immunol 9, 15–27 (2009). - PubMed

Publication types