. 2023 Oct 3;120(40):e2305961120.
doi: 10.1073/pnas.2305961120. Epub 2023 Sep 26.

α-lipoic acid ameliorates consequences of copper overload by up-regulating selenoproteins and decreasing redox misbalance

Affiliations

α-lipoic acid ameliorates consequences of copper overload by up-regulating selenoproteins and decreasing redox misbalance

Ekaterina Kabin et al. Proc Natl Acad Sci U S A. .

Abstract

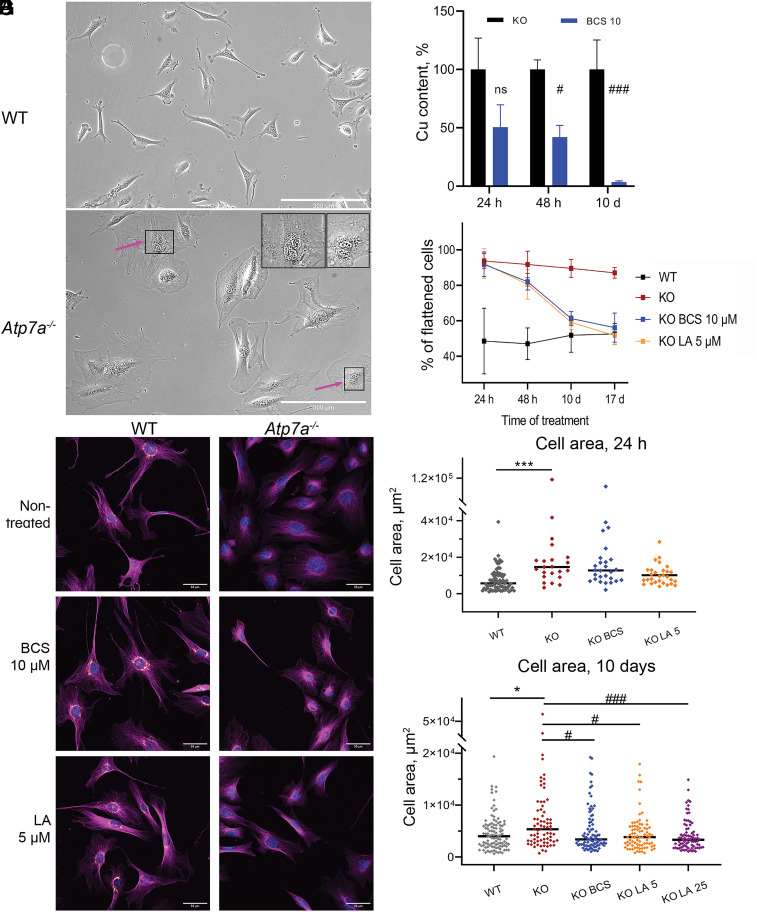
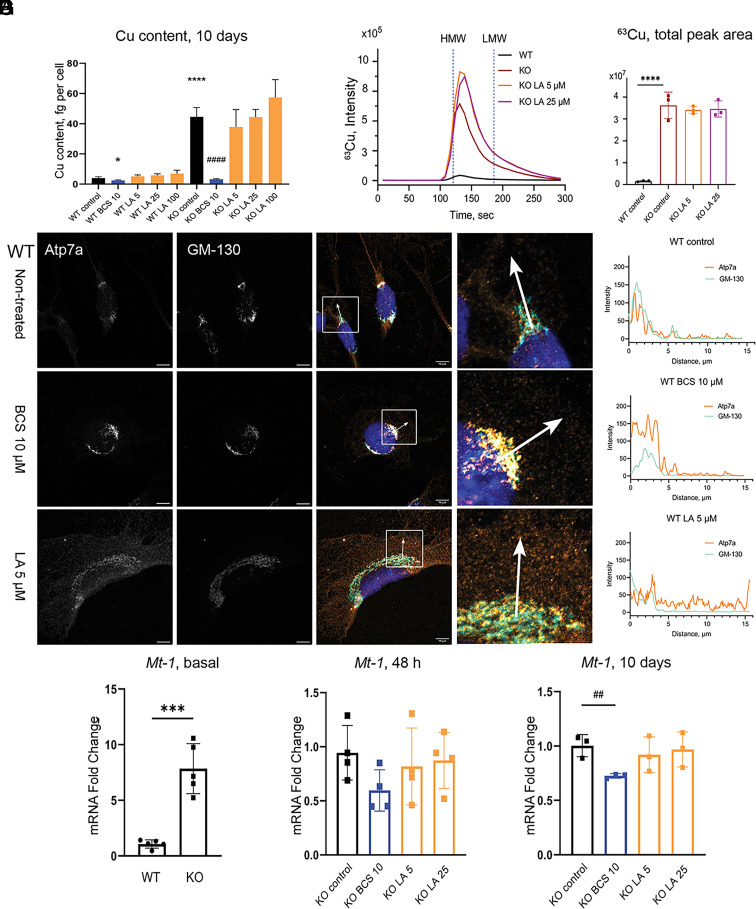
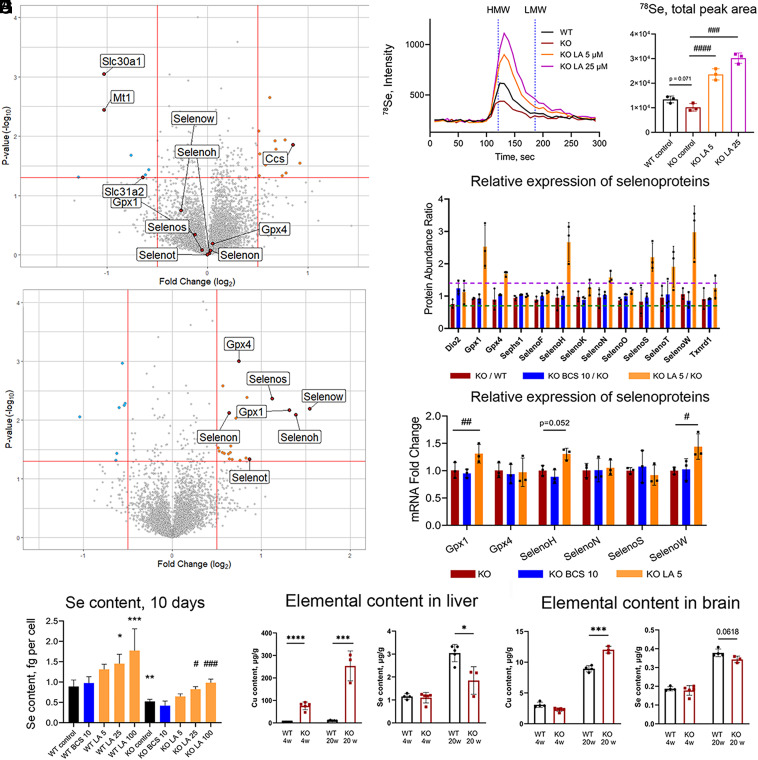
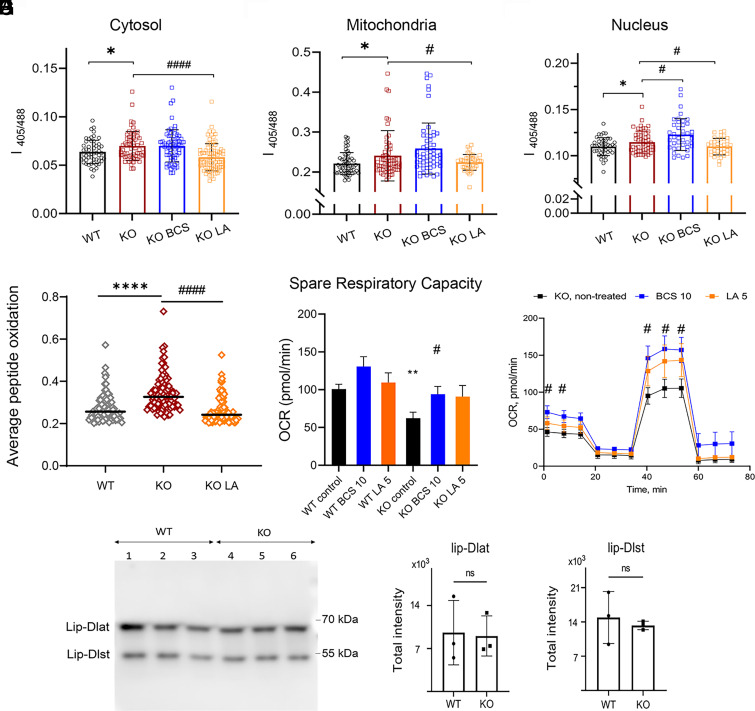
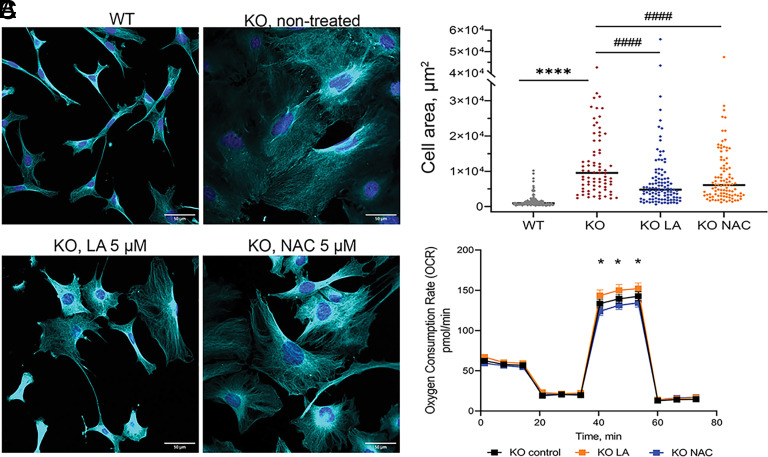
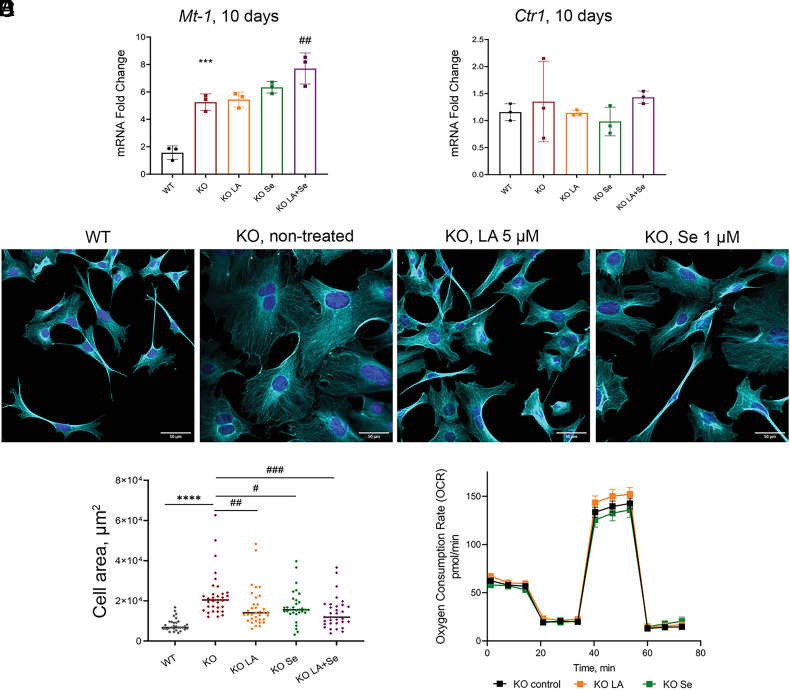
α-lipoic acid (LA) is an essential cofactor for mitochondrial dehydrogenases and is required for cell growth, metabolic fuel production, and antioxidant defense. In vitro, LA binds copper (Cu) with high affinity and as an endogenous membrane permeable metabolite could be advantageous in mitigating the consequences of Cu overload in human diseases. We tested this hypothesis in 3T3-L1 preadipocytes with inactivated Cu transporter Atp7a; these cells accumulate Cu and show morphologic changes and mitochondria impairment. Treatment with LA corrected the morphology of Atp7a-/- cells similar to the Cu chelator bathocuproinedisulfonate (BCS) and improved mitochondria function; however, the mechanisms of LA and BCS action were different. Unlike BCS, LA did not decrease intracellular Cu but instead increased selenium levels that were low in Atp7a-/- cells. Proteome analysis confirmed distinct cell responses to these compounds and identified upregulation of selenoproteins as the major effect of LA on preadipocytes. Upregulation of selenoproteins was associated with an improved GSH:GSSG ratio in cellular compartments, which was lowered by elevated Cu, and reversal of protein oxidation. Thus, LA diminishes toxic effects of elevated Cu by improving cellular redox environment. We also show that selenium levels are decreased in tissues of a Wilson disease animal model, especially in the liver, making LA an attractive candidate for supplemental treatment of this disease.

Keywords: Wilson disease; copper; oxidative stress; selenoprotein; α-lipoic acid.


Conflict of interest statement

The authors declare no competing interest.

Figures

Fig. 1.
Fig. 1.
α-lipoic acid reverses Cu-dependent changes in cell morphology of Atp7a-deficient preadipocytes. (A) Fibrillar morphology of WT preadipocytes and (B) flattened phenotype of KO cells; changes in nuclei size are indicated with arrows in the zoomed upper-right corner of the panel (scale bar, 300 µm). (C) Cellular Cu content in KO preadipocytes is decreasing during treatment with 10 µM BCS. (D) The number of flattened KO cells is decreasing during treatment with 10 µM BCS (blue) and 5 µM LA (orange) compared to nontreated conditions (dark-red). (E) Morphological changes in KO preadipocytes after 17 d of treatment with 10 µM BCS or 5 µM LA compared to the WT cell line visualized with immunostaining. Magenta α-tubulin, orange Atp7a (scale bar, 50 µm). Changes in cell area after 24 h (F) and 17 d (G) of treatment with BCS or LA. Each dot corresponds to an individual cell. The black line represents the median cell area. Cell areas were determined using ImageJ software. For panels (C, F, and G): comparison to nontreated WT cells designated with asterisks (*); comparison with the nontreated KO cells designated with sharp (#); *, # P-value < 0.05; ***, ### P-value < 0.001.
Fig. 2.
Fig. 2.
LA does not alter cellular Cu content and causes relocalization of Atp7a in 3T3-L1 cells. (A) Cu content in WT and KO preadipocytes after 10 d of treatment with 10 µM BCS or different concentrations of LA. (B) Localization of Atp7a in 3T3-L1 WT cells after 10 d of treatment with 10 µM BCS or 5 µM LA. Orange Atp7a, cyan GM-130 (scale bar, 10 µm). Differences in the localization pattern of Atp7a and GM-130 are shown in white squares. Colocalization of Atp7a and GM-130 is quantified using ImageJ and visualized in GraphPad Prism. (C) Average chromatogram (n = 3 per group) of 63Cu species in cell lysates of 3T3-L1 KO preadipocytes after 10 d of treatment with different concentrations of LA and (D) quantification of total 63Cu peak areas normalized by 133Cs signal and protein content (mean ± SD, n = 3). Nontreated WT and KO cells were used as respective controls. Vertical blue dashed lines (120.8 s and 186 s) indicate the retention time of high- and low-molecular-weight species (HMW and LMW, correspondingly) based on retention time of CuHSA (M ≈ 66 kDa) and Cu-EDTA (Mw 355.8 Da), respectively (SI Appendix, Fig. S5). (E) Relative expression of Mt-1 in WT and KO preadipocytes on day 0 (n = 5), (F) after 48 h (n =4), and (G) after 10 d (n=3) of treatment with BCS or LA. For panels (A, D, E, and G): P-values for WT cells shown with asterisks (*) and for KO cells with sharp (#); * – P-value < 0.05; ## – P-value < 0.01; ***, ### – P-value < 0.001; **** – P-value < 0.0001.
Fig. 3.
Fig. 3.
LA up-regulates selenoproteins and increases cellular Se content. (A) Volcano plot comparing proteome of KO cells treated with 10 µM BCS for 10 d to nontreated KO cells and (B) KO cells treated with 5 µM LA for 10 d to nontreated KO cells. (C) Average chromatogram (n = 3 per group) of 78Se species in cell lysates of KO preadipocytes after 10 d of treatment with different concentrations of LA and (D) quantification of total 78Se peak areas normalized by 133Cs signal and by protein content (data present as mean ± SD, n = 3). Nontreated WT and KO cells are used as controls. Vertical dashed lines (120.8 s and 186 s) demonstrate retention time of high- and low-molecular-weight species (HMW and LMW, correspondingly) based on retention time of CuHSA (Mw ≈ 66 kDa) and Cu-EDTA (Mw 355.8 Da), correspondingly (SI Appendix, Fig. S5). (E) Relative abundances of all selenoproteins identified by TMT labeling mass spectrometry in WT and KO preadipocytes after 10 d of treatment with 10 µM BCS or 5 µM LA (n = 3). The horizontal dashed lines at 1.4 (purple) and 0.7 (dark-green) indicate cutoff values for significant changes in protein abundance (upregulation and downregulation, correspondingly). (F) The mRNA for selenoproteins in KO cells relative to WT without treatment and after 10 d of treatment with 10 µM BCS or 5 µM LA (n = 3). For more details, see SI Appendix, Figs. S9 and S10. (G) Selenium content in WT and KO preadipocytes after 10 d of treatment with 10 µM BCS or different concentrations of LA. (H) Cu and Se content in the liver and brain tissue of 4- and 20-wk-old WT and Atp7b−/− mice; the two-tailed t-test was used for pairwise statistical analysis. For panels (DG): comparison to nontreated WT cells is indicated with asterisks (*) and comparison with nontreated KO cells with sharp (#). For panels (FI): *, # – P-value < 0.05; **, ## – P-value < 0.01; ***, ### – P-value < 0.001; ****, #### – P-value < 0.0001.
Fig. 4.
Fig. 4.
Treatment with LA decreases redox misbalance in Atp7a−/− preadipocytes. Oxidation of the GRX-roGFP2 redox sensor in (A) cytosol, (B) mitochondria, and (C) nuclei of WT and KO preadipocytes after 10 d of treatment with 10 µM BCS or 5 µM LA (the number of cells in each group is > 40; n = 3). (D) Average oxidation of peptidoforms of WT and KO preadipocytes after 5 d of treatment with 5 µM LA estimated with quantitative redox proteomics. Peptides found in all treatment groups with a SD of mean less than 0.1 were selected for comparison. (E) Spare respiratory capacity (SRC) of WT and KO preadipocytes after 48 h treatment with 10 µM BCS or 5 µM LA. (F) Oxygen consumption rate (OCR) of KO preadipocytes after 48 h treatment with 10 µM BCS (blue) or 5 µM LA (orange) compared to nontreated KO cells (black). Data in E and (F) are mean ± SEM. (G) Representative western blot and (H and I) densitometric analysis of lipoylated proteins Dlat and Dlst in WT and KO cells. For panels (AF): comparison with WT cells are shown with asterisks (*) and comparison with nontreated KO cells with sharps (#);*, # – P-value < 0.05; ** P-value < 0.01; ****, #### P-value < 0.0001.
Fig. 5.
Fig. 5.
NAC partially improves morphology but not mitochondrial respiration of Atp7a−/− preadipocytes. (A) Morphological changes in KO preadipocytes after 10 d of treatment with 5 µM LA or 5 µM NAC compared to nontreated KO and WT cell lines visualized with immunostaining. Cyan α-tubulin (scale bar, 50 µm). (B) Changes in cell area after 10 d of treatment with 5 µM LA or 5 µM NAC. Each dot corresponds to an individual cell. The black line represents the median cell area. Comparison to nontreated WT cells is designated with asterisks (*) and comparison with the nontreated KO cell line is designated with sharp (#). ****, #### – P-value < 0.0001. Cell areas were determined using ImageJ software. (C) Oxygen consumption rate (OCR) of KO cells treated with 5 µM LA (shown in orange) or 5 µM NAC (shown in blue) for 48 h compared to nontreated KO cells (shown in black). * – comparison of NAC-treated cells to LA-treated cells, * - P-value < 0.05.
Fig. 6.
Fig. 6.
Se improves morphology but not mitochondrial respiration of Atp7a−/− preadipocytes. (A) Relative expression of Mt-1 and (B) Ctr1 genes after 10 d of treatment with 5 µM LA or 1 µM Se, alone or in combination. (C) Morphological changes in KO preadipocytes after 10 d of treatment with 5 µM LA or 1 µM Se compared to nontreated KO and WT cell lines confirmed with immunostaining. Cyan α-tubulin (scale bar, 50 µm). (D) Changes in cell area after 10 d of treatment with 5 µM LA or 1 µM Se, alone or in combination. Each dot corresponds to an individual cell within the field of view. The black line represents the median cell area. Cell areas were determined using ImageJ software. (E) Oxygen consumption rate (OCR) of KO cells treated with 5 µM LA (shown in orange) or 1 µM Se (shown in dark-green) for 48 h compared to nontreated KO cells (shown in black). For panels (A and D): comparison to nontreated WT cells designated with asterisks (*); comparison with the nontreated KO cell line designated with sharp (#); # - P-value < 0.05; ## – P-value < 0.01; ***, ### – P-value < 0.001; **** – P-value < 0.0001.

Similar articles

Cited by

References

    1. Boal A. K., Rosenzweig A. C., Structural biology of copper trafficking. Chem. Rev. 109, 4760–4779 (2009). - PMC - PubMed
    1. Iakovidis I., Fau Delimaris I., Piperakis S. M., Piperakis S. M., Copper and its complexes in medicine: A biochemical approach. Mol. Biol. Int. 2011, 594529 (2011). - PMC - PubMed
    1. Arguello J., Raimunda D., Padilla-Benavides T., Mechanisms of copper homeostasis in bacteria. Front. Cell Infect. Microbiol. 3, 73 (2013). - PMC - PubMed
    1. Hordyjewska A., Popiołek Ł, Kocot J., The many “faces” of copper in medicine and treatment. BioMetals 27, 611–621 (2014). - PMC - PubMed
    1. Uriu-Adams J. Y., Keen C. L., Copper, oxidative stress, and human health. Mol. Aspects Med. 26, 268–298 (2005). - PubMed

Publication types