. 2023 Sep 25;15(18):9499-9520.
doi: 10.18632/aging.205031. Epub 2023 Sep 25.

M2 macrophage-derived exosomal miR-486-5p influences the differentiation potential of bone marrow mesenchymal stem cells and osteoporosis

Affiliations

M2 macrophage-derived exosomal miR-486-5p influences the differentiation potential of bone marrow mesenchymal stem cells and osteoporosis

Jincheng Liu et al. Aging (Albany NY). .

Abstract

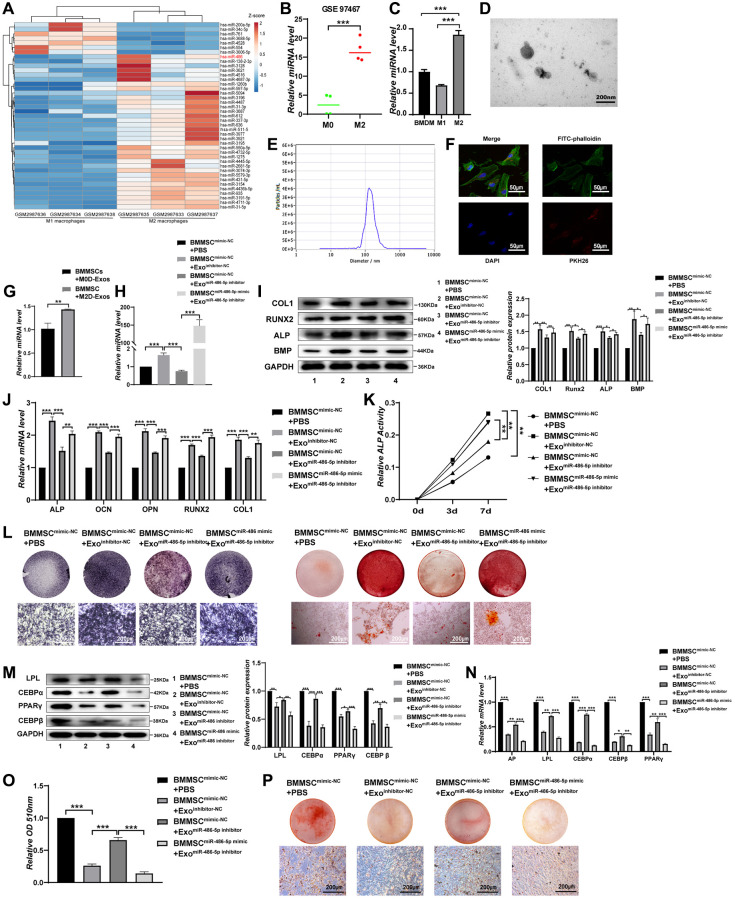
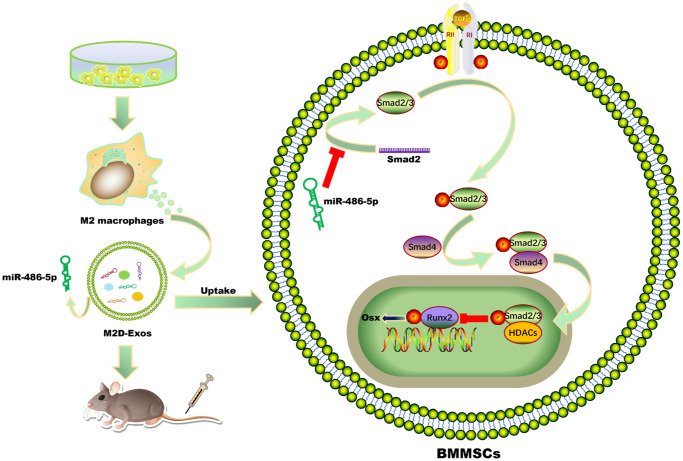
Background: An imbalance between osteogenesis and adipogenesis in bone marrow mesenchymal stem cells (BMMSCs) can cause osteoporosis. Macrophage-derived exosomes (MD-Exos) and microRNAs (miRNAs) enriched in exosomes participate in the differentiation of BMMSCs.

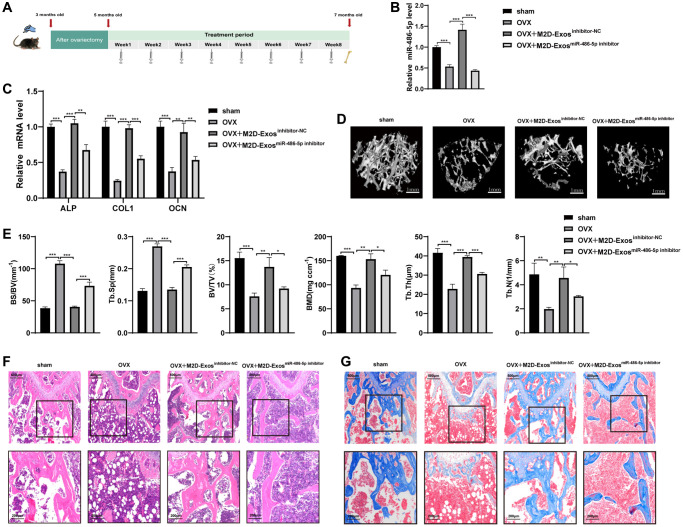
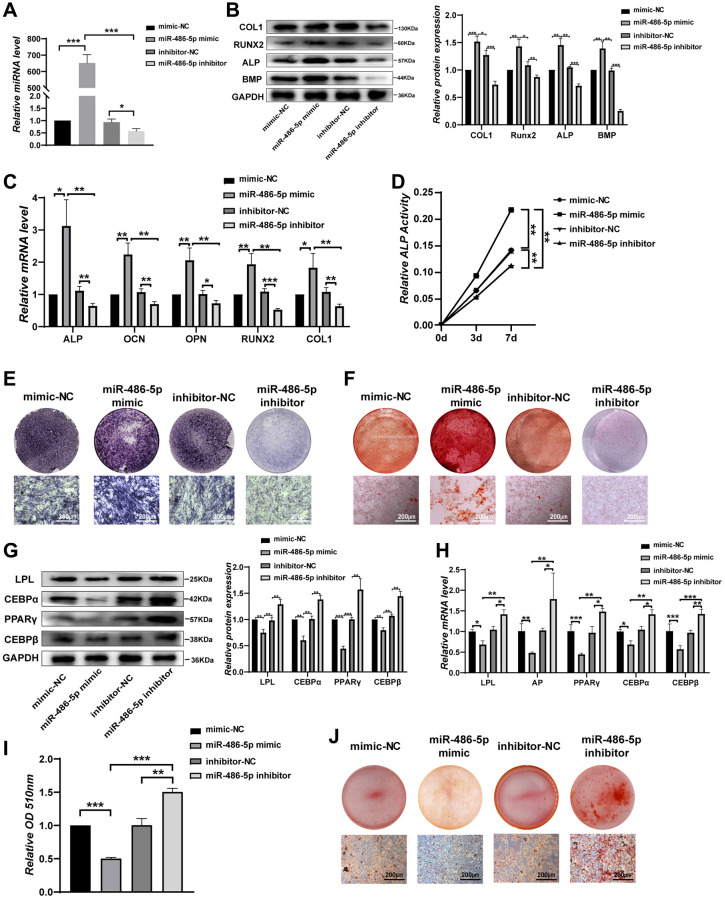
Methods: Bioinformatics methods were used to analyze differentially expressed miRNAs. We cocultured M2 macrophages and BMMSCs to examine the biological function of exosomal microRNA-486-5p (miR-486-5p) on BMMSCs differentiation. Gain-of-function experiments related to osteogenesis were designed to investigate the effects of exosomes carrying miR-486-5p on an ovariectomized (OVX) mice model and the direct impact of miR-486-5p on BMMSCs. A dual luciferase experiment was performed to demonstrate the target gene of miR-486-5p.

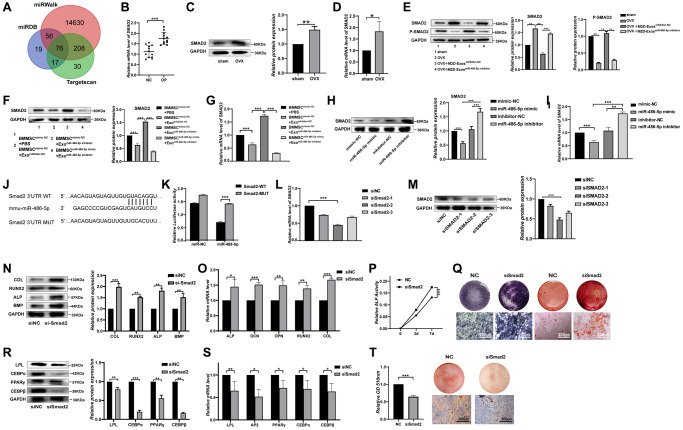
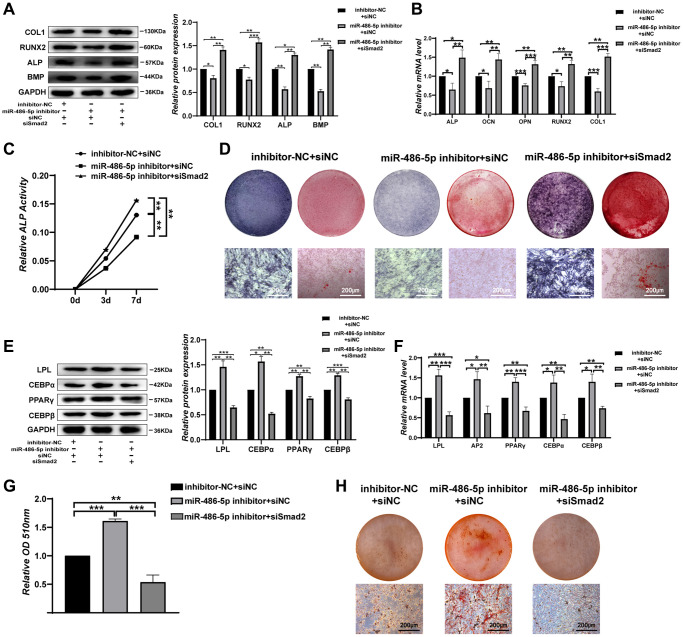
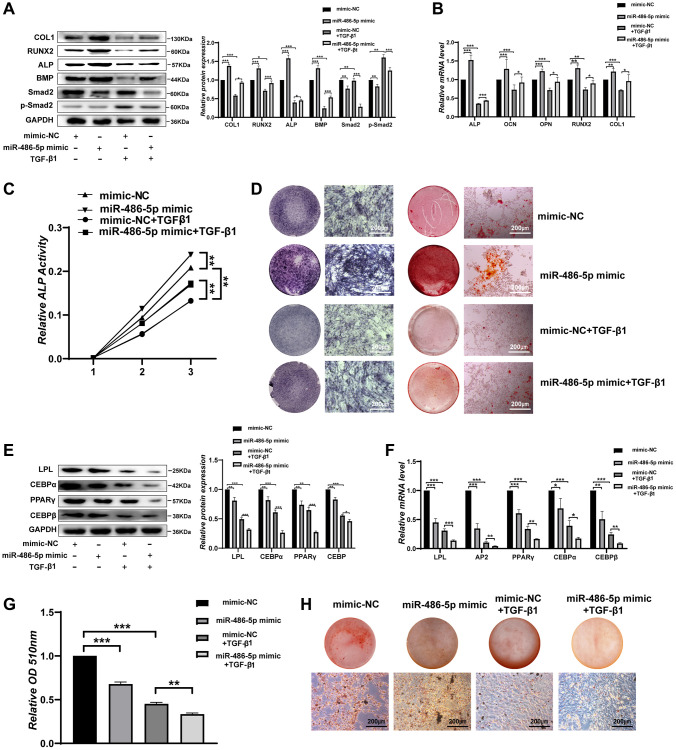
Results: Bioinformatics analysis identified high expression of miRNA-486 in M2 macrophage-derived exosomes (M2D-Exos). The in vitro results demonstrated that M2 macrophage-derived exosomal miR-486-5p enhanced osteogenic capacity but inhibited the adipogenesis of BMMSCs. The direct effect of miR-486-5p on BMMSCs showed the same effects. Animal experiments revealed that exosomal miR-486-5p rescued bone loss of OVX mice. SMAD2 was characterized as a target gene of miR-486-5p. Pathway analysis showed that M2 macrophage-derived exosomal miR-486-5p stimulated osteogenic differentiation via the TGF-β/SMAD2 signalling pathway.

Conclusions: Taken together, M2 macrophage-derived exosomal miR-486-5p influences the differentiation potential of BMMSCs through the miR-486-5p/SMAD2/TGF-β signalling pathway and osteoporosis.

Keywords: BMMSCs; differentiation; exosome; miR-486-5p; osteoporosis.


Conflict of interest statement

CONFLICTS OF INTEREST: The authors declare no conflicts of interest related to this study.

Figures

Figure 1
Figure 1
M2 macrophage-derived exosomal miRNA-486-5p promotes the osteogenic differentiation and inhibits the adipogenic differentiation of BMMSCs. (A) A heatmap identified the differently expressed miRNAs between M2 macrophages and M1 macrophages using GSE 110339 from the Gene Expression Omnibus (GEO) dataset (fold change > 1 or < − 1, Benjamini-Hochberg-corrected p). (B) Expression of the differentially expressed miR-486-5p between M2 macrophages-derived exosomes (M2D-Exos) and monocyte-derived exosomes using GSE97467 from the GEO dataset. (C) The miR-486-5p levels in bone marrow-derived macrophages (BMDMs), M1 macrophages, and M2 macrophages were measured by qRT-PCR analysis. (D) The morphology of M2D-Exos was shown by transmission electron microscopy (TEM). Scale bars, 200 nm. (E) The particle size distribution in purified M2D-Exos determined by nanoparticle tracking analysis (NTA). (F) Laser scanning confocal microscopy analysis of the internalization of PKH26-labelled M2D-Exos by BMMSCs, Scale bars, 50 μm. (G) Overexpression of miR-486-5p was detected in the BMMSCs treated with M2D-Exos by qRT-PCR analysis. (H) qRT-PCR analysis was used following the addition of PBS, M2D-Exosinhibitor-NC (exosomes from M2 macrophages transfected with the NC inhibitor) or M2D-ExosmiR-486-5p inhibitor (exosomes from M2 macrophages transfected with the miR-486-5p inhibitor) to assess miR-486-5p expression in the mimic NC- or miR-486-5p-transfected BMMSCs. (I, J) The expression of osteogenic differentiation proteins and mRNAs were assessed by Western blot and qRT-PCR. (K) An ALP activity assay was performed to analyse ALP activity on days 0, 3, and 7. (L) Alizarin red staining of BMMSCs after different transfections for 21 days. Alkaline phosphatase staining of BMMSCs following different treatments for 14 days. Scale bars, 200 μm. (M) Western blot analysis was used to assess the expression of adipogenic differentiation proteins, including LPL, CEBPα, PPARγ, and CEBPβ. (N) qRT-PCR analysis of AP, LPL, CEBPα, CEBPβ, and PPARγ gene levels; (O, P) Oil red O staining and extraction were performed to detect lipid droplet formation on day 10 of adipogenic differentiation. Scale bars, 200 μm. Data are expressed as the mean ± SEM, *p < 0.05, **p < 0.01, ***p < 0.005.
Figure 2
Figure 2
M2D-Exo-derived miR-486-5p accelerates bone formation in vivo. (A) Schematic diagram illustrating the experimental design. (B) qRT-PCR analysis of miR 486-5p levels in bone specimens from OVX mice after treatment with PBS, M2D-Exosinhibitor-NC, or M2D-ExosmiR-486-5p inhibitor. (C) qRT-PCR analysis of ALP, OCN, and COL1 mRNA levels in bone specimens from OVX mice after treatment with PBS, M2D-Exosinhibitor-NC, or M2D-ExosmiR-486-5p inhibitor. (D) Representative images showing the three-dimensional trabecular architecture in distal femurs determined by microCT reconstruction. Scale bars, 1 mm. (E) MicroCT measurements of BS/BV, Tb. Sp, BMD, BV/TV, Tb. N, and Tb. Th in the distal femurs of the OVX mice after treatment with PBS, M2D-Exosinhibitor-NC, or M2D-ExosmiR-486-5p inhibitor. (F) H&E staining indicates trabecular density. Scale bars indicated 200 μm and 500 μm. (G) Masson trichrome staining indicates trabecular density and collagen. Scale bars indicated 200 μm and 500 μm. n = 5 mice/group. Data are expressed as the mean ± SEM, *p < 0.05, **p < 0.01, ***p < 0.005.
Figure 3
Figure 3
miR-486-5p directly enhances osteogenesis but suppresses adipogenesis of BMMSCs. (A) qRT-PCR analysis of miR-486-5p levels in BMMSCs after treatment with mimic-NC, miR-486-5p mimic, inhibitor-NC, or miR-486-5p inhibitor for 48 h. (B) Western blot analysis of COL1, RUNX2, ALP, and BMP in BMMSCs after treatment with mimic-NC, miR-486-5p mimic, inhibitor-NC, or miR-486-5p inhibitor for 48 h. (C) qRT-PCR analysis of the changes in the mRNA levels of the osteogenic differentiation marker genes ALP, OCN, OPN, RUNX2, and COL1 in BMMSCs after treatment with mimic-NC, miR-486-5p mimic, inhibitor-NC, or miR-486-5p inhibitor for 48 h. (D) Relative ALP activity was analysed during osteogenesis in treated BMMSCs on days 0, 3, and 7. (E) ALP staining in BMMSCs following different treatments for 14 days. Scale bars, 200 μm. (F) Alizarin red staining in BMMSCs after different transfections for 21 days. Scale bars, 200 μm. (G, H) The expression of adipogenic-specific markers was analysed by qRT-PCR and Western blots. (I, J) Oil red O staining and extraction were performed to detect lipid droplet formation on day 10. Scale bars, 200 μm. Data are expressed as the mean ± SEM, *p < 0.05, **p < 0.01, ***p < 0.005.
Figure 4
Figure 4
SMAD2 was the target of miR-486-5p. (A) TargetScan, miRDB, and miRWalk were used to predict gene targets of miR-486-5p. (B) mRNAs were extracted from bone specimens collected from female patients with osteoporosis (OP) and female subjects without osteoporosis (NC). SMAD2 mRNA expression was measured by qRT-PCR. (C, D) The expression of SMAD2 in bone tissues of OVX mice with osteoporosis and sham-operated control counterparts was measured by Western blots and qRT-PCR. (E) Western blot analysis was used to detect the expression of SMAD2 and p-SMAD2 in sham, OVX+PBS, OVX+M2D-Exosinhibitor-NC, and OVX+M2D-ExosmiR-486-5p inhibitor mice. (F, G) Western blots and qRT-PCR analysis were used following treatment with PBS, M2D-Exosinhibitor-NC, or M2D-ExosmiR-486-5p inhibitor to assess SMAD2 expression in mimic NC- or miR-486-5p-transfected BMMSCs. (H, I) Western blot and qRT-PCR analysis of SMAD2 levels in BMMSCs after treatment with mimic-NC, miR-486-5p mimic, inhibitor-NC, or miR-486-5p inhibitor for 48 h. (J) Schematic illustration of the design of luciferase reporters containing the WT SMAD2 3′UTR or the site-directed mutant SMAD2 3′UTR. (K) The wild-type (WT) or mutant-type (MUT) constructs were inserted into the psiCHECK-2 reporter vector. Luciferase activity was measured in the lysates, and the values were normalized to that of the psiCHECK-2 vector. (L, M) The knockdown efficiency of three SMAD2 siRNAs was confirmed by qRT-PCR and Western blot analysis. (N, O) Western blots and qRT-PCR were used to analyse osteogenic-specific markers after SMAD2 knockdown. (P) An ALP activity assay was performed to analyse ALP activity on days 0, 3, and 7. (Q) ALP staining was performed on day 14, and Alizarin red staining showed increased calcification on day 21 after SMAD2 knockdown. Scale bars, 200 μm. (R, S) Western blots and qRT-PCR were used to analyse adipogenic-specific markers after SMAD2 knockdown. (T) Oil red O staining and extraction were performed to detect the formation of lipid droplets on day 10 of adipogenic differentiation. Scale bars, 200 μm. Data are expressed as the mean ± SEM, *p < 0.05, **p < 0.01, ***p < 0.005.
Figure 5
Figure 5
SMAD2 knockdown reverses the effect of downregulated miR-486-5p expression on BMMSC differentiation. (A, B) Western blots and qRT-PCR were used to analyse osteogenic factor expression after different treatments. (C) ALP activity assays were performed to analyse ALP activity during osteogenic differentiation on days 0, 3, and 7. (D) ALP staining was performed on day 14, and Alizarin red staining showed increased calcification on day 21 after different transfections. Scale bars, 200 μm. (E, F) Western blotting and qRT-PCR were performed to analyse the protein and mRNA expression levels of adipogenic markers, respectively. (G, H) Oil red O staining and extraction were performed to detect lipid droplet formation on day 10 of adipogenic differentiation. Scale bars, 200 μm. Data are expressed as the mean ± SEM. *p < 0.05, **p < 0.01, ***p < 0.005.
Figure 6
Figure 6
miR-486-5p regulates BMMSC differentiation through the TGF-β signalling pathway. (A) Western blot analysis of the protein levels of osteogenic and TGF-β signalling pathway-related molecular elements after different treatments. (B) The mRNA levels of osteogenic genes after different treatments. (C) ALP activity assays were performed to analyse ALP activity in the treated BMMSCs on days 0, 3, and 7. (D) ALP staining was performed on day 14, and Alizarin red staining showed increased calcification on day 21 after different treatments. Scale bars, 200 μm. (E, F) Western blotting and qRT-PCR were performed to analyse the expression levels of adipogenic factors after different treatments. (G, H) Oil red O staining and extraction were performed on day 10 of adipogenic differentiation after different treatments. Scale bars, 200 μm. Data are expressed as the mean ± SEM. *p < 0.05, **p < 0.01, ***p < 0.005.
Figure 7
Figure 7
Schematic diagram showing the proposed mechanisms by which exosomal miR-486-5p derived from M2 macrophages regulates the osteogenic and adipogenic differentiation of BMMSCs. miR-486-5p enrichment in M2D-Exos enhances the inhibitory effect on SMAD2, resulting in downregulation of the TGF-β signalling pathway and thereby accelerating bone remodelling.

Similar articles

Cited by

References

    1. Lane NE. Epidemiology, etiology, and diagnosis of osteoporosis. Am J Obstet Gynecol. 2006; 194:S3–11. 10.1016/j.ajog.2005.08.047 - DOI - PubMed
    1. You Y, Ma W, Wang F, Jiao G, Zhang L, Zhou H, Wu W, Wang H, Chen Y. Ortho-silicic acid enhances osteogenesis of osteoblasts through the upregulation of miR-130b which directly targets PTEN. Life Sci. 2021; 264:118680. 10.1016/j.lfs.2020.118680 - DOI - PubMed
    1. Bianco P, Riminucci M, Gronthos S, Robey PG. Bone marrow stromal stem cells: nature, biology, and potential applications. Stem Cells. 2001; 19:180–92. 10.1634/stemcells.19-3-180 - DOI - PubMed
    1. Pierce JL, Begun DL, Westendorf JJ, McGee-Lawrence ME. Defining osteoblast and adipocyte lineages in the bone marrow. Bone. 2019; 118:2–7. 10.1016/j.bone.2018.05.019 - DOI - PMC - PubMed
    1. Kang M, Huang CC, Lu Y, Shirazi S, Gajendrareddy P, Ravindran S, Cooper LF. Bone regeneration is mediated by macrophage extracellular vesicles. Bone. 2020; 141:115627. 10.1016/j.bone.2020.115627 - DOI - PMC - PubMed

LinkOut - more resources