. 2023 Sep 25;58(18):1801-1818.e15.
doi: 10.1016/j.devcel.2023.08.024.

Generation and molecular characterization of human pluripotent stem cell-derived pharyngeal foregut endoderm

Affiliations

Generation and molecular characterization of human pluripotent stem cell-derived pharyngeal foregut endoderm

Nicola A Kearns et al. Dev Cell. .

Abstract

Approaches to study human pharyngeal foregut endoderm-a developmental intermediate that is linked to various human syndromes involving pharynx development and organogenesis of tissues such as thymus, parathyroid, and thyroid-have been hampered by scarcity of tissue access and cellular models. We present an efficient stepwise differentiation method to generate human pharyngeal foregut endoderm from pluripotent stem cells. We determine dose and temporal requirements of signaling pathway engagement for optimized differentiation and characterize the differentiation products on cellular and integrated molecular level. We present a computational classification tool, "CellMatch," and transcriptomic classification of differentiation products on an integrated mouse scRNA-seq developmental roadmap confirms cellular maturation. Integrated transcriptomic and chromatin analyses infer differentiation stage-specific gene regulatory networks. Our work provides the method and integrated multiomic resource for the investigation of disease-relevant loci and gene regulatory networks and their role in developmental defects affecting the pharyngeal endoderm and its derivatives.

Keywords: gene regulatory networks; human pluripotent stem cells; multiomic analyses; pharyngeal endoderm; retinoic acid pathway; stem cell differentiation.


Conflict of interest statement

Declaration of interests The authors declare no competing interests.

Figures
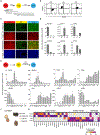
Figure 1.
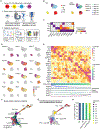
Figure 1.. A small molecule directed differentiation protocol allows generation of anterior foregut cells from human pluripotent stem cells through a definitive endoderm intermediate
(A) Schematic of the small molecule-directed protocol utilized to generate definitive endoderm and anterior foregut cells from human pluripotent stem cells. Pluripotent stem cells (PSC), definitive endoderm (DE) and anterior foregut (AFE) differentiation stages, small molecules and timeline are described. (B) Representative intracellular flow cytometry of day 0 (PSC), day 3 (DE), and day 9 (AFE) cultures for SOX2 and FOXA2. Percentages of populations are indicated. (C) Representative immunofluorescence staining of cultures on day 0 (PSC), day 3 (DE) and day 9 (AFE) of differentiation for FOXA2 and SOX2 with Hoechst stain indicating nuclei in blue. Scale bar = 100μm. (D) Quantitative gene expression analysis of POU5F1, NANOG, SOX17, GATA6, SOX2 and OTX2 in differentiation cultures at day 0 (PSC), day 3 (DE), and day 9 (AFE). Expression levels are relative to ACTB. n= 3 independent experiments +/− S.D. (E) Quantitative gene expression analysis of PAX9, NKX2.6, PAX1, OTX2, HOXA3, SIX1, VGLL2, and HHEX at day 9 (AFE) treated with the indicated concentrations of retinoic acid, or 1uM of the retinoic acid receptor inverse agonist BMS493 (BMS). Expression levels are relative to day 3 (DE). n= 3 independent experiments +/− S.D. * denotes p<0.01 relative to the no retinoic acid (RA) condition. (F) UMAP visualization of single cell transcriptomic profiles at AFE in the presence of varying concentrations of RA added at DE with cells colored by RA condition. N = 2 replicates, n = 6178 cells. (G) Column-standardized heatmap displaying expression of anterior, posterior and mid/hindgut markers from literature at each of the four retinoic acid conditions profiled by scRNA sequencing. See also Figure S1 and Table S1.
Figure 2.
Figure 2.. Retinoic acid (RA) induces PAX9+ Pharyngeal Foregut Endoderm (PFE) from DE in a time dependent manner and cultures can generate pharyngeal derivative / FOXN1+ TEC-like cells after transplantation in vivo
(A) Quantitative gene expression analysis of PAX9 in differentiation cultures at day 15 (PFE) at the indicated time window of RA treatment. Expression levels are displayed relative to the no RA condition. n= 3 independent experiments +/− S.D. * denotes p<0.01 relative to the no RA condition. (B) Representative immunofluorescence staining of day 15 (PFE) cultures generated with no RA, 100nM RA and 10uM RA from days 4-15 for PAX9 and EPCAM. Hoechst stain indicates nuclei in blue. Scale bars = 100μm. (C) Immunofluorescence staining of transplanted PFE following 10 weeks of maturation in vivo for FOXN1 co-stained with PAX9, HLA-DR/P/Q, K5, K8, UEA1 and CLDN4. Scale bars = 100μm, final right panel, scale bar = 50μm. (D) Quantitative gene expression analysis of PAX9, PAX1, HOXA3, FOXG1, FOXN1, PSMB11, of day 0 (PSC), day 3 (DE), day 9 (AFE), day 15 (PFE) and 10-week transplanted cells (Graft). Expression levels are relative to transplanted cells. n= 3 independent experiments +/− S.D. RA = retinoic acid. See also Figure S2 and Table S2.
Figure 3.
Figure 3.. Single cell transcriptomic profiling of the stem-cell differentiation protocol products and unbiased staging on a mouse in vivo atlas validate differentiation outcomes and their homogeneity
(A) Schematic showing the essentials of our approach: 1. a scRNAseq directed differentiation time course sampled at 4 stages; 2. two published scRNAseq mouse in vivo endoderm development datasets and 3. “CellMatch” for classifying a clustered query dataset onto a clustered reference based on a correlation distance metric. CellMatch compares neighboring reference-query matches and outputs a per gene evaluation for the best match (B) UMAP visualization of single cell transcriptomic profiles of the directed differentiation time course from PSC to PFE (n=3571 cells) colored by the differentiation stage of the cells and unsupervised leiden clusters labelled by the stage of the cells within the cluster. Each dot represents a single cell in the global transcriptomic space. (C) Column-standardized heatmap displaying expression of markers from literature at each of the timepoints. (D) UMAP visualization of single cell transcriptomic profiles of known transcripts at PSC (POU5F1); DE (CER1, SOX17); AFE (VGLL2, EYA1); DE to PFE (FOXA2); PSC, AFE and PFE (SOX2); and PFE (PAX9, PAX1, FOXE1, PBX1). (E) Heatmap of the normalized gene expression values plotted along increasing pseudotime with a bar showing the Wanderlust computed pseudotime. Heat is calculated by averaging over 100 cells, followed by row wise standard scaling. Time series plots of the probability of finding a cell in each leiden cluster is shown at the bottom. Confidence intervals, as determined from the 1% and 99% quantiles from bootstrapping for 1000 iterations, are shown as highlighted regions around the calculated probability. Transcripts in the heatmap and clusters in the probability plots are ordered in increasing order of the pseudotime at which they attain their maximum value (F) Force directed graph layout for integrated mouse embryonic endoderm (E3.5-E8.75) and mouse embryonic PFE (E9.5-E12.5). Each dot represents a cell in the global transcriptomic space (n= 76,894 cells). Non-endodermal cells are excluded. Relevant cell types are labelled, namely inner cell mass (ICM), Epiblast (EPI), Definitive Endoderm (DE), Gut Tube, Liver, Pancreas, Thyroid, Early and Late Pharyngeal Foregut Endoderm (PFE), Parathyroid, Thymic Epithelial Cells (TECs), Ultimobranchial Body (Ubb) and Esophagus and Oropharynx. (G) Force directed graph layout of integrated mouse embryonic endoderm as in (E). One dot is shown for each in vivo cell. Clusters with no stem cell equivalents are colored gray. Clusters with stem cell equivalents are colored according to the stage at which their equivalents are present. Labels denote in vitro to in vivo classification results, namely PSCs to Epiblast, DE to DE, AFE to early PFE, and PFE to late PFE. Early PFE denotes an E9.5 dominated PFE population while late PFE denotes an E11.5 dominated PFE population. (H) Bar plot indicating the proportion of cells colored by embryonic day from the four in vivo clusters to which the in vitro cells are classified: namely, Epiblast (EPI), Definitive Endoderm (DE), Early Pharyngeal Foregut Endoderm Cluster 16 (Early PFE(C16)) and Late Pharyngeal Foregut Endoderm Cluster 0 (Late PFE(C0)). See also Figure S3, Figure S4 and Table S3.
Figure 4.
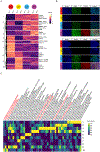
Figure 4.. Bulk transcriptomic profiling captures dynamic and stage specific signature changes associated with differentiation of PSCs to PFE
(A) Heatmap showing z-scored rlog normalized transcript expression of differentially expressed genes (number of genes = 6161) (adjusted p-val < 0.1, log2-foldchange > 0.5) from RNA comparisons between every pair across the four timepoints profiled, namely PSC, DE, AFE, and PFE with the two replicates indicated. Genes are grouped into 10 clusters using unsupervised k-means clustering on the centered and scaled normalized expression across the timepoints. Literature markers from each of the 10 clusters are shown. (B) Immunofluorescence microscopy series over the entire time course of pharyngeal foregut endoderm differentiation, capturing PSC, DE, AFE, and PFE stages with antibodies against PBX1, FOXE1, GATA3, and PAX9. (C) Curated list of terms from an EnrichR analysis of the 10 gene clusters in (A) with heat indicating the scaled z-score enrichment of the term for the genes in the cluster. See also Figure S5 and Table S4.
Figure 5.
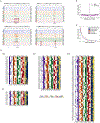
Figure 5.. Bulk chromatin accessibility and histone profiling reveal epigenetic changes and putative drivers of pharyngeal endoderm differentiation
(A) Browser tracks showing the ATAC (blue), H3K27ac (green), H3K27me3 (red), H3K4me2 (orange) signal at SOX17, GATA6, FOXA2, and PAX1 loci. (B) Per base averaged PhastCon conservation score across 100 vertebrates as a function of distance from peak center over the set VP of 40,163 variable ATAC peaks from Figure S6E (in purple) and on a background (black). (C) Plot of mean peak PhastCon conservation score by quantile on proximal and distal regions of a representative ENCODE DNAse Hypersensitivity peak set as well as the variable peak set from our differentiation, along with a random background set (D) Heatmaps of transcription factor (TF) regulators split by the timepoint on which they have the maximum effect. Regulators were selected based on their motif enrichment in variable regions (VP) from (B), correlation (> 0.7) of ATAC motif enrichment and RNA expression across the TF family and correlation (>0.5) between RNA expression and motif enrichment in at least one of the three profiled histone marks on peaks in VP. Motif enrichment in VP regions is shown on ATAC (purple), H3K27ac (green), H3K27me3 (red) and H3K4me2 (orange) along with scaled TPM normalized RNA expression (cividis). In case of multiple TFs with the same motif enrichment correlation, the top two having the maximum expression variability across the time course were displayed. See also Figure S6 and Table S5.
Figure 6.
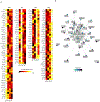
Figure 6.. Gene regulatory network inference enables transcription factor ranking and prioritization during human pharyngeal endoderm differentiation
(A) Heatmap showing the row normalized PageRank score of the top 150 TF drivers across all stages of the differentiation with importance determined by their PageRank score. Drivers are visualized as PSC, DE, AFE, or PFE based on the timepoint at which they have the most importance. (B) Gene regulatory network of the top TFs at PFE from the heatmap in (A) and their high weighted edge connectivity (weight > 10). Nodes are colored based on their PageRank and directed edges indicate a putative enhancer binding event between a TF and its target. See also Table S6.

References

    1. Magaletta ME, Siller R, and Maehr R (2020). Differentiation of human pluripotent stem cells toward pharyngeal endoderm derivatives: Current status and potential. Current topics in developmental biology 138, 175–208. - PubMed
    1. Green MD, Chen A, Nostro M-C, d’Souza SL, Schaniel C, Lemischka IR, Gouon-Evans V, Keller G, and Snoeck H-W (2011). Generation of anterior foregut endoderm from human embryonic and induced pluripotent stem cells. Nature biotechnology 29, 267–272. - PMC - PubMed
    1. Kearns NA, Genga RMJ, Ziller M, Peters H, Brehm MA, Meissner A, and Maehr R (2013). Generation of organized anterior foregut epithelia from pluripotent stem cells using small molecules. Stem cell research 11, 1003–1012. - PubMed
    1. Parent AV, Russ HA, Khan IS, Laflam TN, Metzger TC, Anderson MS, and Hebrok M (2013). Generation of Functional Thymic Epithelium from Human Embryonic Stem Cells that Supports Host T Cell Development. Cell stem cell 13, 219–229. - PMC - PubMed
    1. Sun X, Xu J, Lu H, Liu W, Miao Z, Sui X, Liu H, Su L, Du W, He Q, et al. (2013). Directed Differentiation of Human Embryonic Stem Cells into Thymic Epithelial Progenitor-like Cells Reconstitutes the Thymic Microenvironment In Vivo. Cell stem cell 13, 230–236. - PubMed

Publication types