Review
. 2023 Oct 18;14(10):822-843.e22.
doi: 10.1016/j.cels.2023.08.004. Epub 2023 Sep 25.

Studying stochastic systems biology of the cell with single-cell genomics data

Affiliations
Review

Studying stochastic systems biology of the cell with single-cell genomics data

Gennady Gorin et al. Cell Syst. .

Abstract

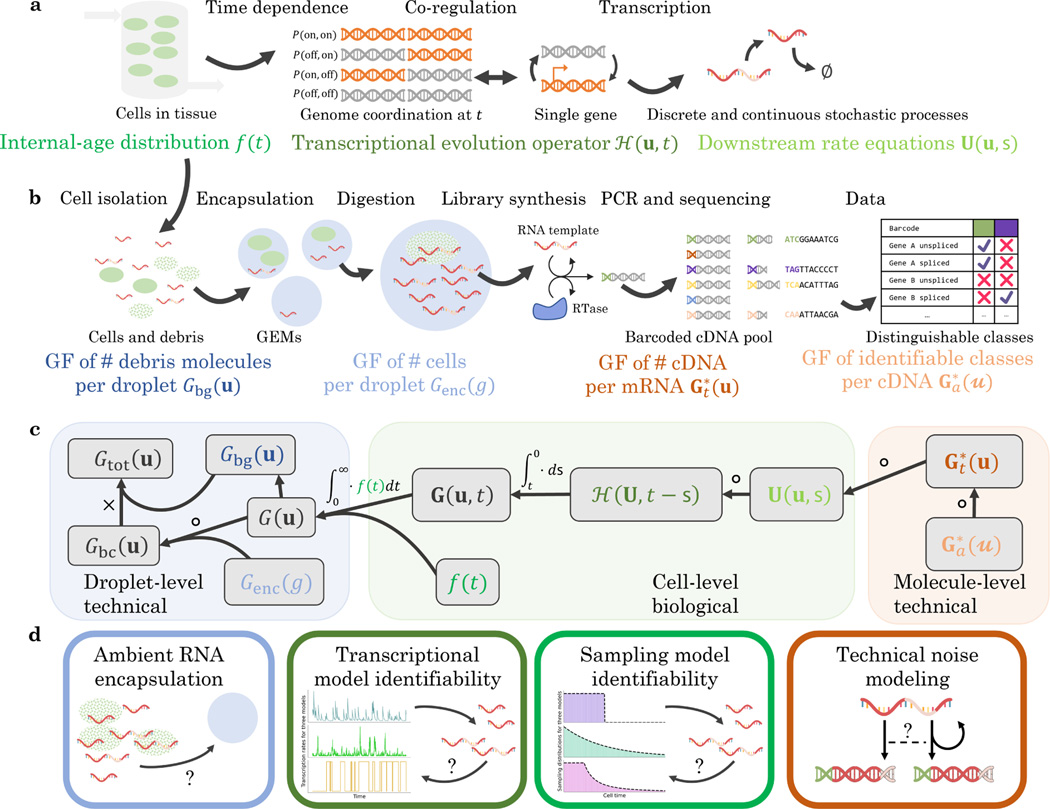
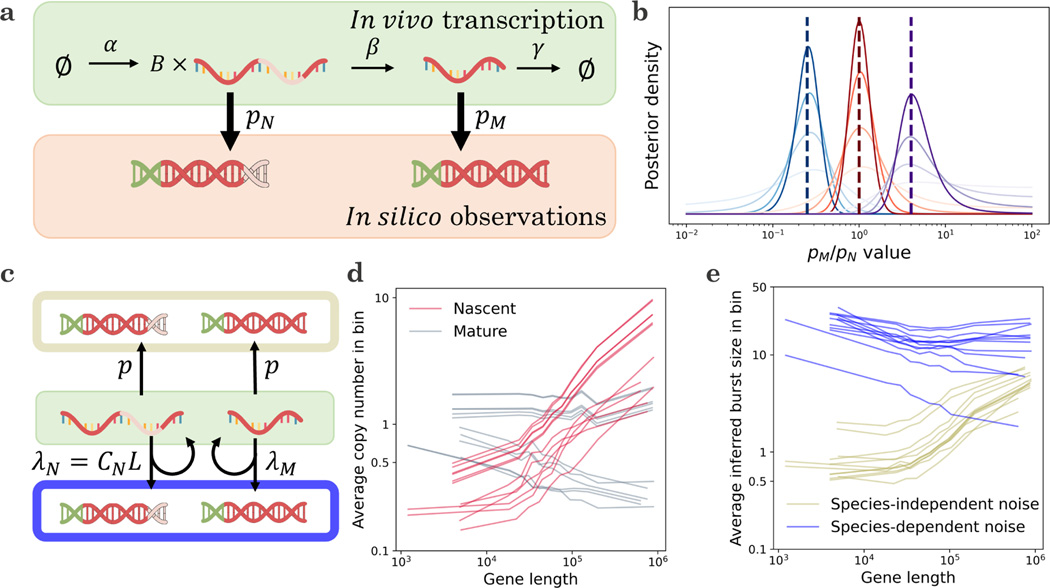
Recent experimental developments in genome-wide RNA quantification hold considerable promise for systems biology. However, rigorously probing the biology of living cells requires a unified mathematical framework that accounts for single-molecule biological stochasticity in the context of technical variation associated with genomics assays. We review models for a variety of RNA transcription processes, as well as the encapsulation and library construction steps of microfluidics-based single-cell RNA sequencing, and present a framework to integrate these phenomena by the manipulation of generating functions. Finally, we use simulated scenarios and biological data to illustrate the implications and applications of the approach.

Keywords: Fokker-Planck equations; Markov chains; bioinformatics; chemical master equations; genomics; single-cell RNA sequencing; single-cell genomics; single-cell transcriptomics; stochastic differential equations; stochastic processes; transcriptomics.


Conflict of interest statement

Declaration of interests The authors declare no competing interests.

Figures

Figure 1
Figure 1
The biophysical and chemical phenomena of interest, as well as the relationships between their generating functions. a. The biological phenomena of interest: cell influx and efflux into a tissue observed by sequencing; the time-dependent transcriptional regulation of one or more genes; downstream continuous and discrete processes. b. The technical phenomena of interest: the encapsulation of cells and cell debris; cDNA library construction; the loss of information in transcript identification (GF: generating function; RTase: reverse transcriptase). c. The structure of the full generating function of the system in a and b: to obtain the solution, we variously compose, integrate, and multiply the generating functions of the constituent processes. d. The stochastic and statistical properties of four components of the full system: the background debris, the transcriptional regulation, the cell/tissue relationship, and the technical noise mechanism.
Figure 2
Figure 2
The pseudo-bulk model of background noise is quantitatively consistent with counts from the pbmc_1k_v3 dataset. a. The simplest explanatory model for background noise invokes the lysis of cells (green), which creates a pool of RNA that reflects the overall transcriptome composition but retains none of the cell-level information. If the loose RNA molecules diffuse into droplets (blue) according to a memoryless and independent arrival process, the resulting background distribution (purple: higher probability mass; white: lower probability mass) observed in empty droplets should be a series of mutually independent Poisson distributions, with the mean controlled by the composition in non-empty droplets. b. The mature transcriptome in empty droplets has a mean-variance relationship near identity (gray points, n = 12,298), consistent with Poisson statistics (blue line); the non-empty droplets demonstrate considerable overdispersion (red points, n = 17,393). c. The mature and nascent transcripts in empty droplets have sample correlation coefficients ρ near zero, consistent with distributional independence (gray histogram, n = 9,362); the non-empty droplets demonstrate nontrivial statistical relationships (red histogram, n = 14,365). d. The mature transcripts of different genes in empty droplets have sample correlation coefficients ρ near zero, consistent with distributional independence (gray histogram, n = 75,614,253); the non-empty droplets demonstrate nontrivial statistical relationships (red histogram, n = 151,249,528). e. When both are nonzero, the mature count mean in empty droplets is highly correlated with the mean in the non-empty droplets, consistent with the pseudo-bulk interpretation (black points, n = 12,107; dashed line: identity).
Figure 3
Figure 3
The stochastic analysis of biological and technical phenomena facilitates the identification and inference of transcriptional models. a. A minimal model that accounts for intrinsic (single-molecule), extrinsic (cell-to-cell), and technical (experimental) variability: one of three time-varying transcriptional processes K generates molecules, which are spliced with rate β, degraded with rate γ, and observed with probability p. Given a set of observations, we can use statistics to narrow down the range of consistent models. b. Given a particular model, parameter regimes indistinguishable using a single modality become distinguishable with two. The mixture-like and burst-like regimes both produce negative binomial marginal distributions, but have different correlation structures (Left: data likelihoods over the parameter space, computed from 200 simulated cells; Γ-OU ground truth; red point: true parameter set in the mixture-like regime; color: log-likelihood of data, yellow is higher, 90th percentile marked with magenta hatching; blue: an illustrative parameter set in a burst-like parameter regime with a similar nascent marginal but drastically different joint structure. Right: nascent marginal and joint distributions at the points indicated on the left. Nascent distributions nearly overlap). c. Given a location in parameter space, models are easier to distinguish using multiple modalities. However, the performance varies widely based on the location in parameter space and the specific candidate models: for example, the telegraph model has a well-distinguishable bimodal limit when the process autocorrelation is slower than RNA dynamics. In addition, all else held equal, drop-out noise effectively decreases the noise intensity, lowering identifiability (Left: Γ-OU Akaike weights under Γ-OU ground truth, average of n = 50 replicates using 200 simulated cells; color: Akaike weight of correct model, yellow is higher, regions with weight < 0.5 marked with black hatching; large circles: illustrative parameter sets; smaller circles: distributions obtained by applying p = 50%, 75%, and 85% dropout to illustrative parameter sets while keeping the averages constant. Right: the three candidate models’ nascent marginal distributions at the large points indicated on the left).
Figure 4
Figure 4
Given ordered and labeled snapshot data obtained from a transient differentiation process, we can typically fit the copy number data, but identifying the mechanism of the snapshot is more challenging. a. A minimal model that accounts for the observation of transient differentiation processes in scRNA-seq: cells enter a “reactor” and receive a signal to begin transitioning from cell type A through B and to C. The change in cell type is accompanied by a step change in the burst size, which leads to variation in the nascent and mature RNA copy numbers over time. Given information about the cell type abundances and the cells’ time along the process, we may fit a dynamic process to snapshot data and attempt to identify the underlying reactor type, which determines the probability of observing a cell at a particular time since the beginning of the process. b. In spite of the considerable differences between the reactor architectures, they produce nearly identical molecular count marginals (histogram: data simulated from the Dirac model, 200 cells; colored lines: analytical distributions at the maximum likelihood transcriptional parameter fits for each of the three reactor models. Analytical distributions nearly overlap). c. The true reactor model may be identified from molecule count data, but statistical performance is typically poor (points: Akaike weight values for n = 50 independent rounds of simulation and inference under a single set of parameters; blue markers and vertical lines: mean and standard deviation at each number of cells; blue line connects markers to summarize the trends; red lines: the Akaike weight values 1/3, which contains no information for model selection, and 1/2, which gives even odds for the correct model; two-species data generated from the Dirac model; uniform horizontal jitter added). d. The reactor models are poorly identifiable across a range of parameters, and rarely produce Akaike weights above 1/2 (histogram: Akaike weight values for n = 200 independent rounds of parameter generation, simulation, and inference under the true Dirac model; red line: the Akaike weight values 1/3 and 1/2; two-species data for 200 cells generated from the Dirac model; parameters were restricted to the low-expression regime μ+4σ25 for both species). e. The challenges in reactor identification arise because all three models produce similar likelihoods (histograms: likelihood differences between candidate models and the true Dirac model for n = 200 independent rounds of parameter generation, simulation, and inference; red line: no likelihood difference; two-species data for 200 cells generated from the Dirac model; parameters were restricted to the low-expression regime μ+4σ25 for both species).
Figure 5
Figure 5
Technical noise models may be identified from count data, either by direct application of statistics or by imposing informal priors about the biological variability. a. A minimal model that accounts for non-homogeneous noise: transcriptional events occur with frequency α, generating geometrically-distributed bursts B with mean size b; the molecules are spliced with rate β and degraded with rate γ. Nascent molecules are observed with probability pN and mature molecules are observed with probability pM. b. Given information about the nascent distribution and the mature mean, it is possible to use joint distributions to obtain information about the ratio of observation probabilities (curves: average posterior likelihoods, computed from 200 independent synthetic datasets; color: true value of pM/pN, blue: 1/4, red: 1, purple: 4; dashed lines: location of each true value; color intensity: from lightest to darkest, synthetic datasets with 20, 50, 100, and 200 cells). c. Two models considered in Gorin et al.: the species-independent bias model for length dependence in averages, which proposes that nascent and mature RNA are sampled with equal probabilities, and the species-dependent bias model, which proposes that the nascent RNA sampling rate scales with length (top, gold: kinetics of species-independent model; bottom, blue: kinetics of species-dependent model; center, green: the source RNA molecules used to template cDNA). d. A variety of single-cell datasets produce consistent and counterintuitive length-dependent trends in nascent RNA observations (lines: average per-species gene expression, binned by gene length; red: nascent RNA observations; gray: mature RNA statistics; data for 2,500 genes analyzed in Gorin et al.). e. Fits to the species-independent model show a strong positive gene length dependence for inferred burst sizes, whereas fits to the species-dependent model show a modest negative gene length dependence, which is more coherent with orthogonal data (lines: average per-gene burst size inferred by Monod, binned by gene length; gold: results for species-independent model; blue: results for species-dependent model; data for genes analyzed in Gorin et al. after goodness-of-fit).

Update of

Similar articles

Cited by

References

    1. Wilkinson DJ, 2018. Stochastic modelling for systems biology. Chapman and Hall/CRC.
    1. Waddington CH, 1957. The strategy of the genes. Routledge.
    1. Huang S, 2009. Reprogramming cell fates: reconciling rarity with robustness. BioEssays 31:546–560. https://onlinelibrary.wiley.com/doi/abs/10.1002/bies.200800189. - DOI - PubMed
    1. Huang S, 2012. The molecular and mathematical basis of Waddington’s epigenetic landscape: A framework for post-Darwinian biology? BioEssays 34:149–157. https://onlinelibrary.wiley.com/doi/abs/10.1002/bies.201100031. - DOI - PubMed
    1. Rand DA, Raju A, Sáez M, Corson F, and Siggia ED, 2021. Geometry of gene regulatory dynamics. Proceedings of the National Academy of Sciences 118:e2109729118. https://pnas.org/doi/full/10.1073/pnas.2109729118. - DOI - PMC - PubMed

LinkOut - more resources