. 2023 Oct 5;83(19):3421-3437.e11.
doi: 10.1016/j.molcel.2023.08.029. Epub 2023 Sep 25.

RANK ligand converts the NCoR/HDAC3 co-repressor to a PGC1β- and RNA-dependent co-activator of osteoclast gene expression

Affiliations

RANK ligand converts the NCoR/HDAC3 co-repressor to a PGC1β- and RNA-dependent co-activator of osteoclast gene expression

Yohei Abe et al. Mol Cell. .

Abstract

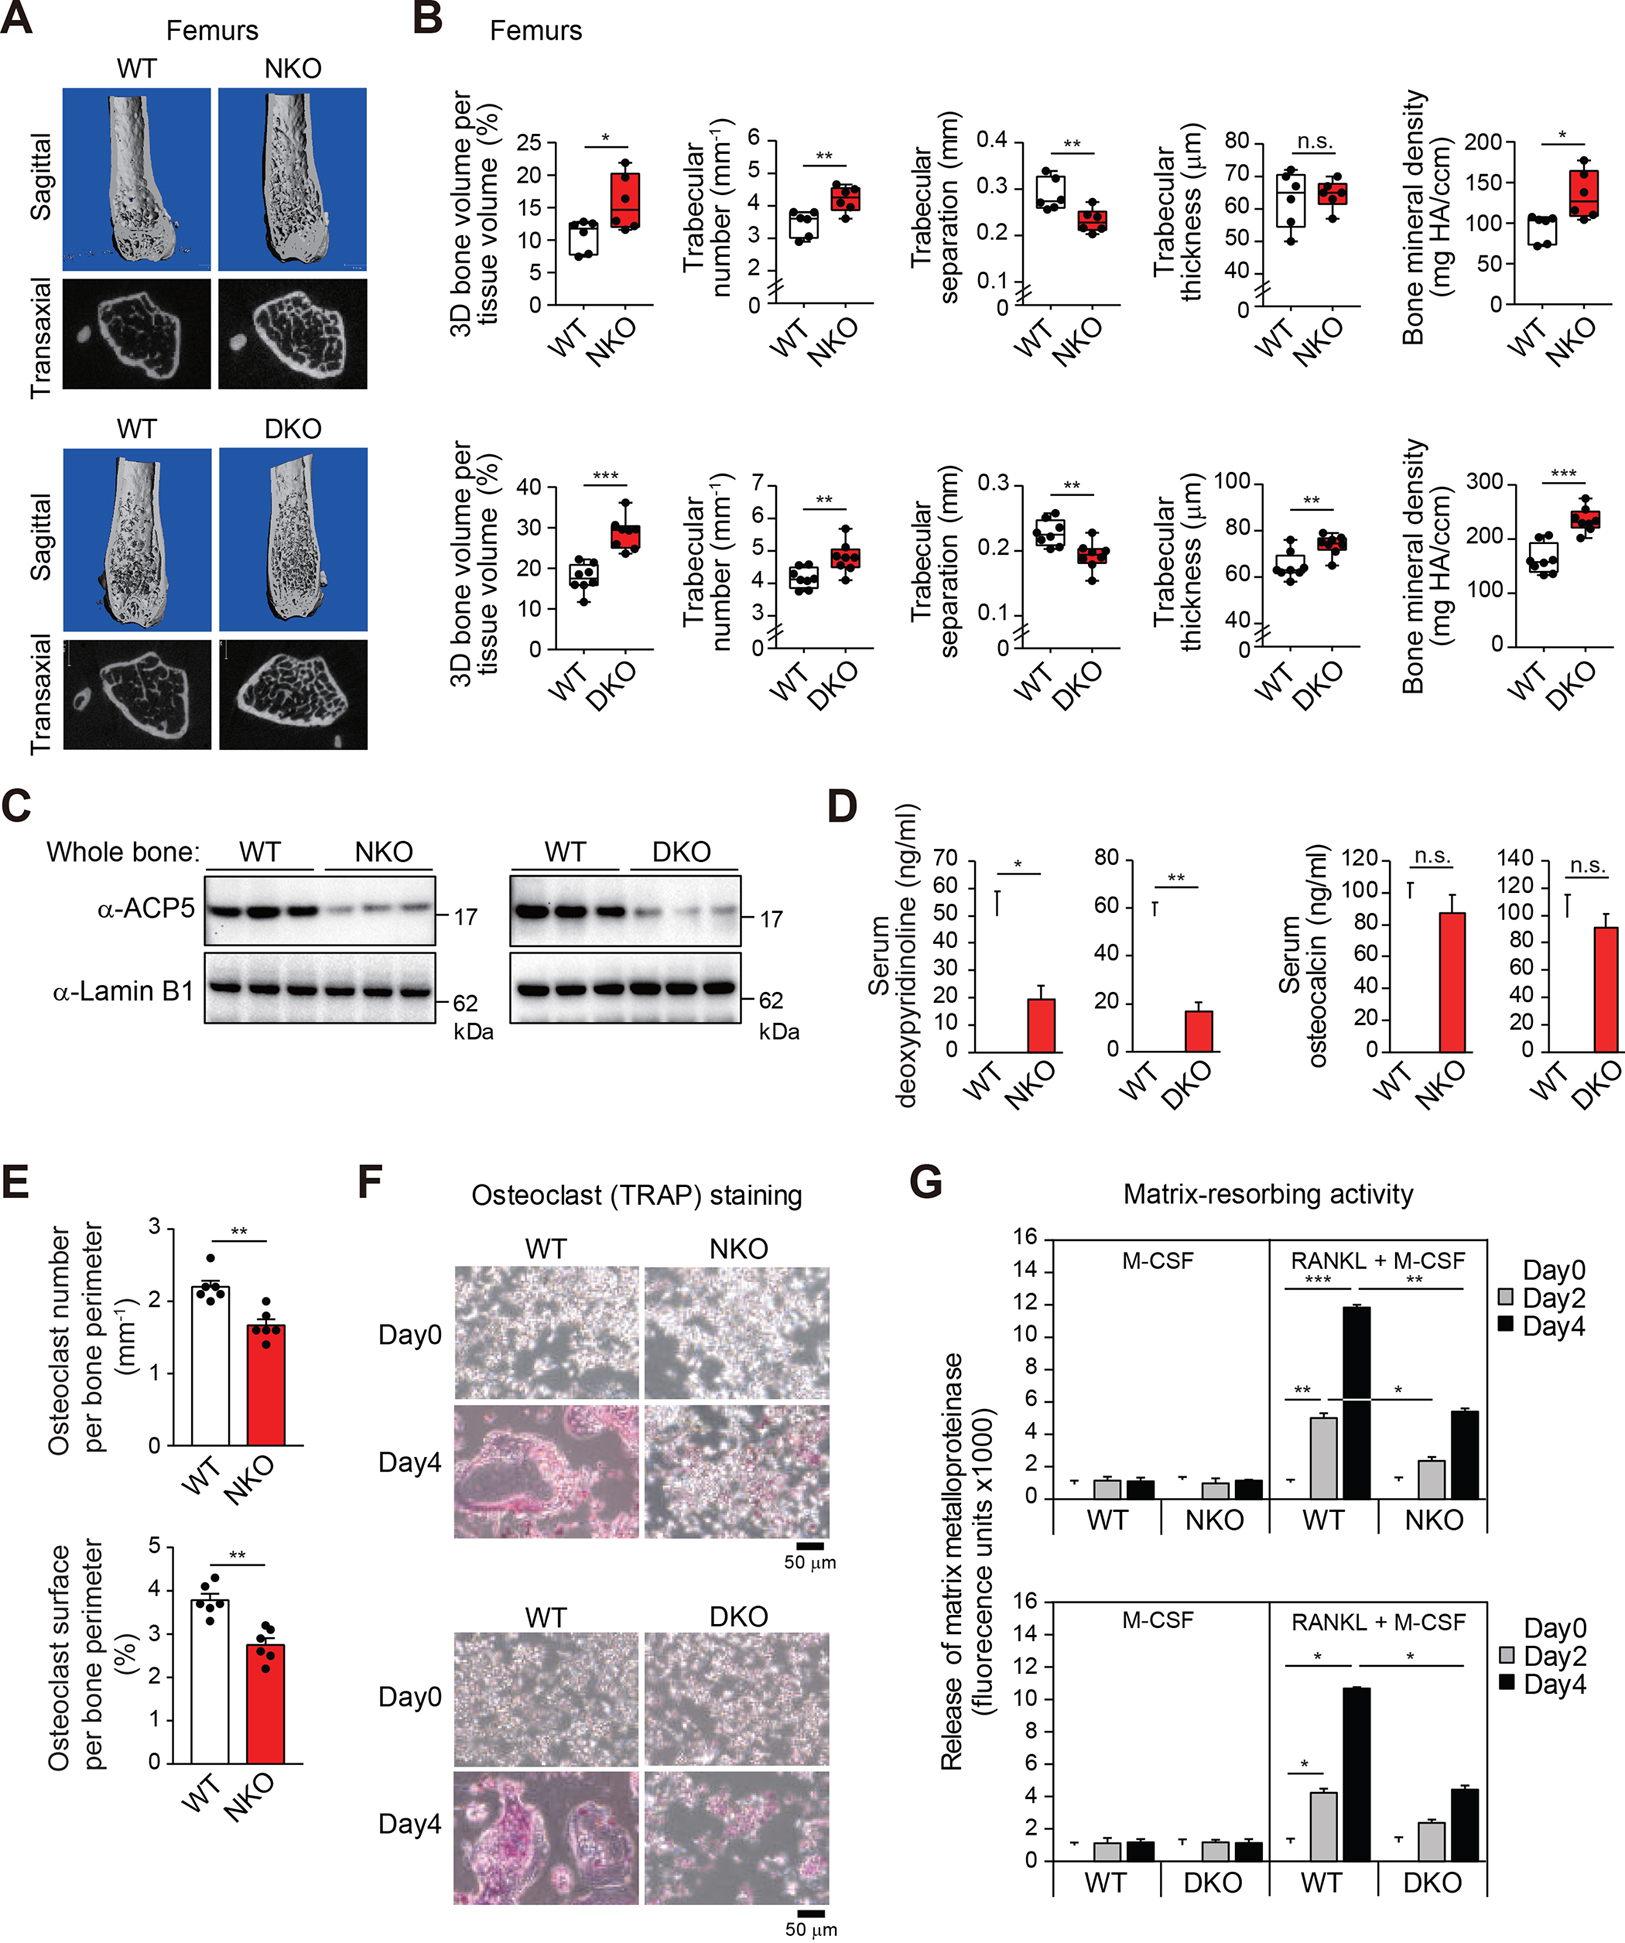
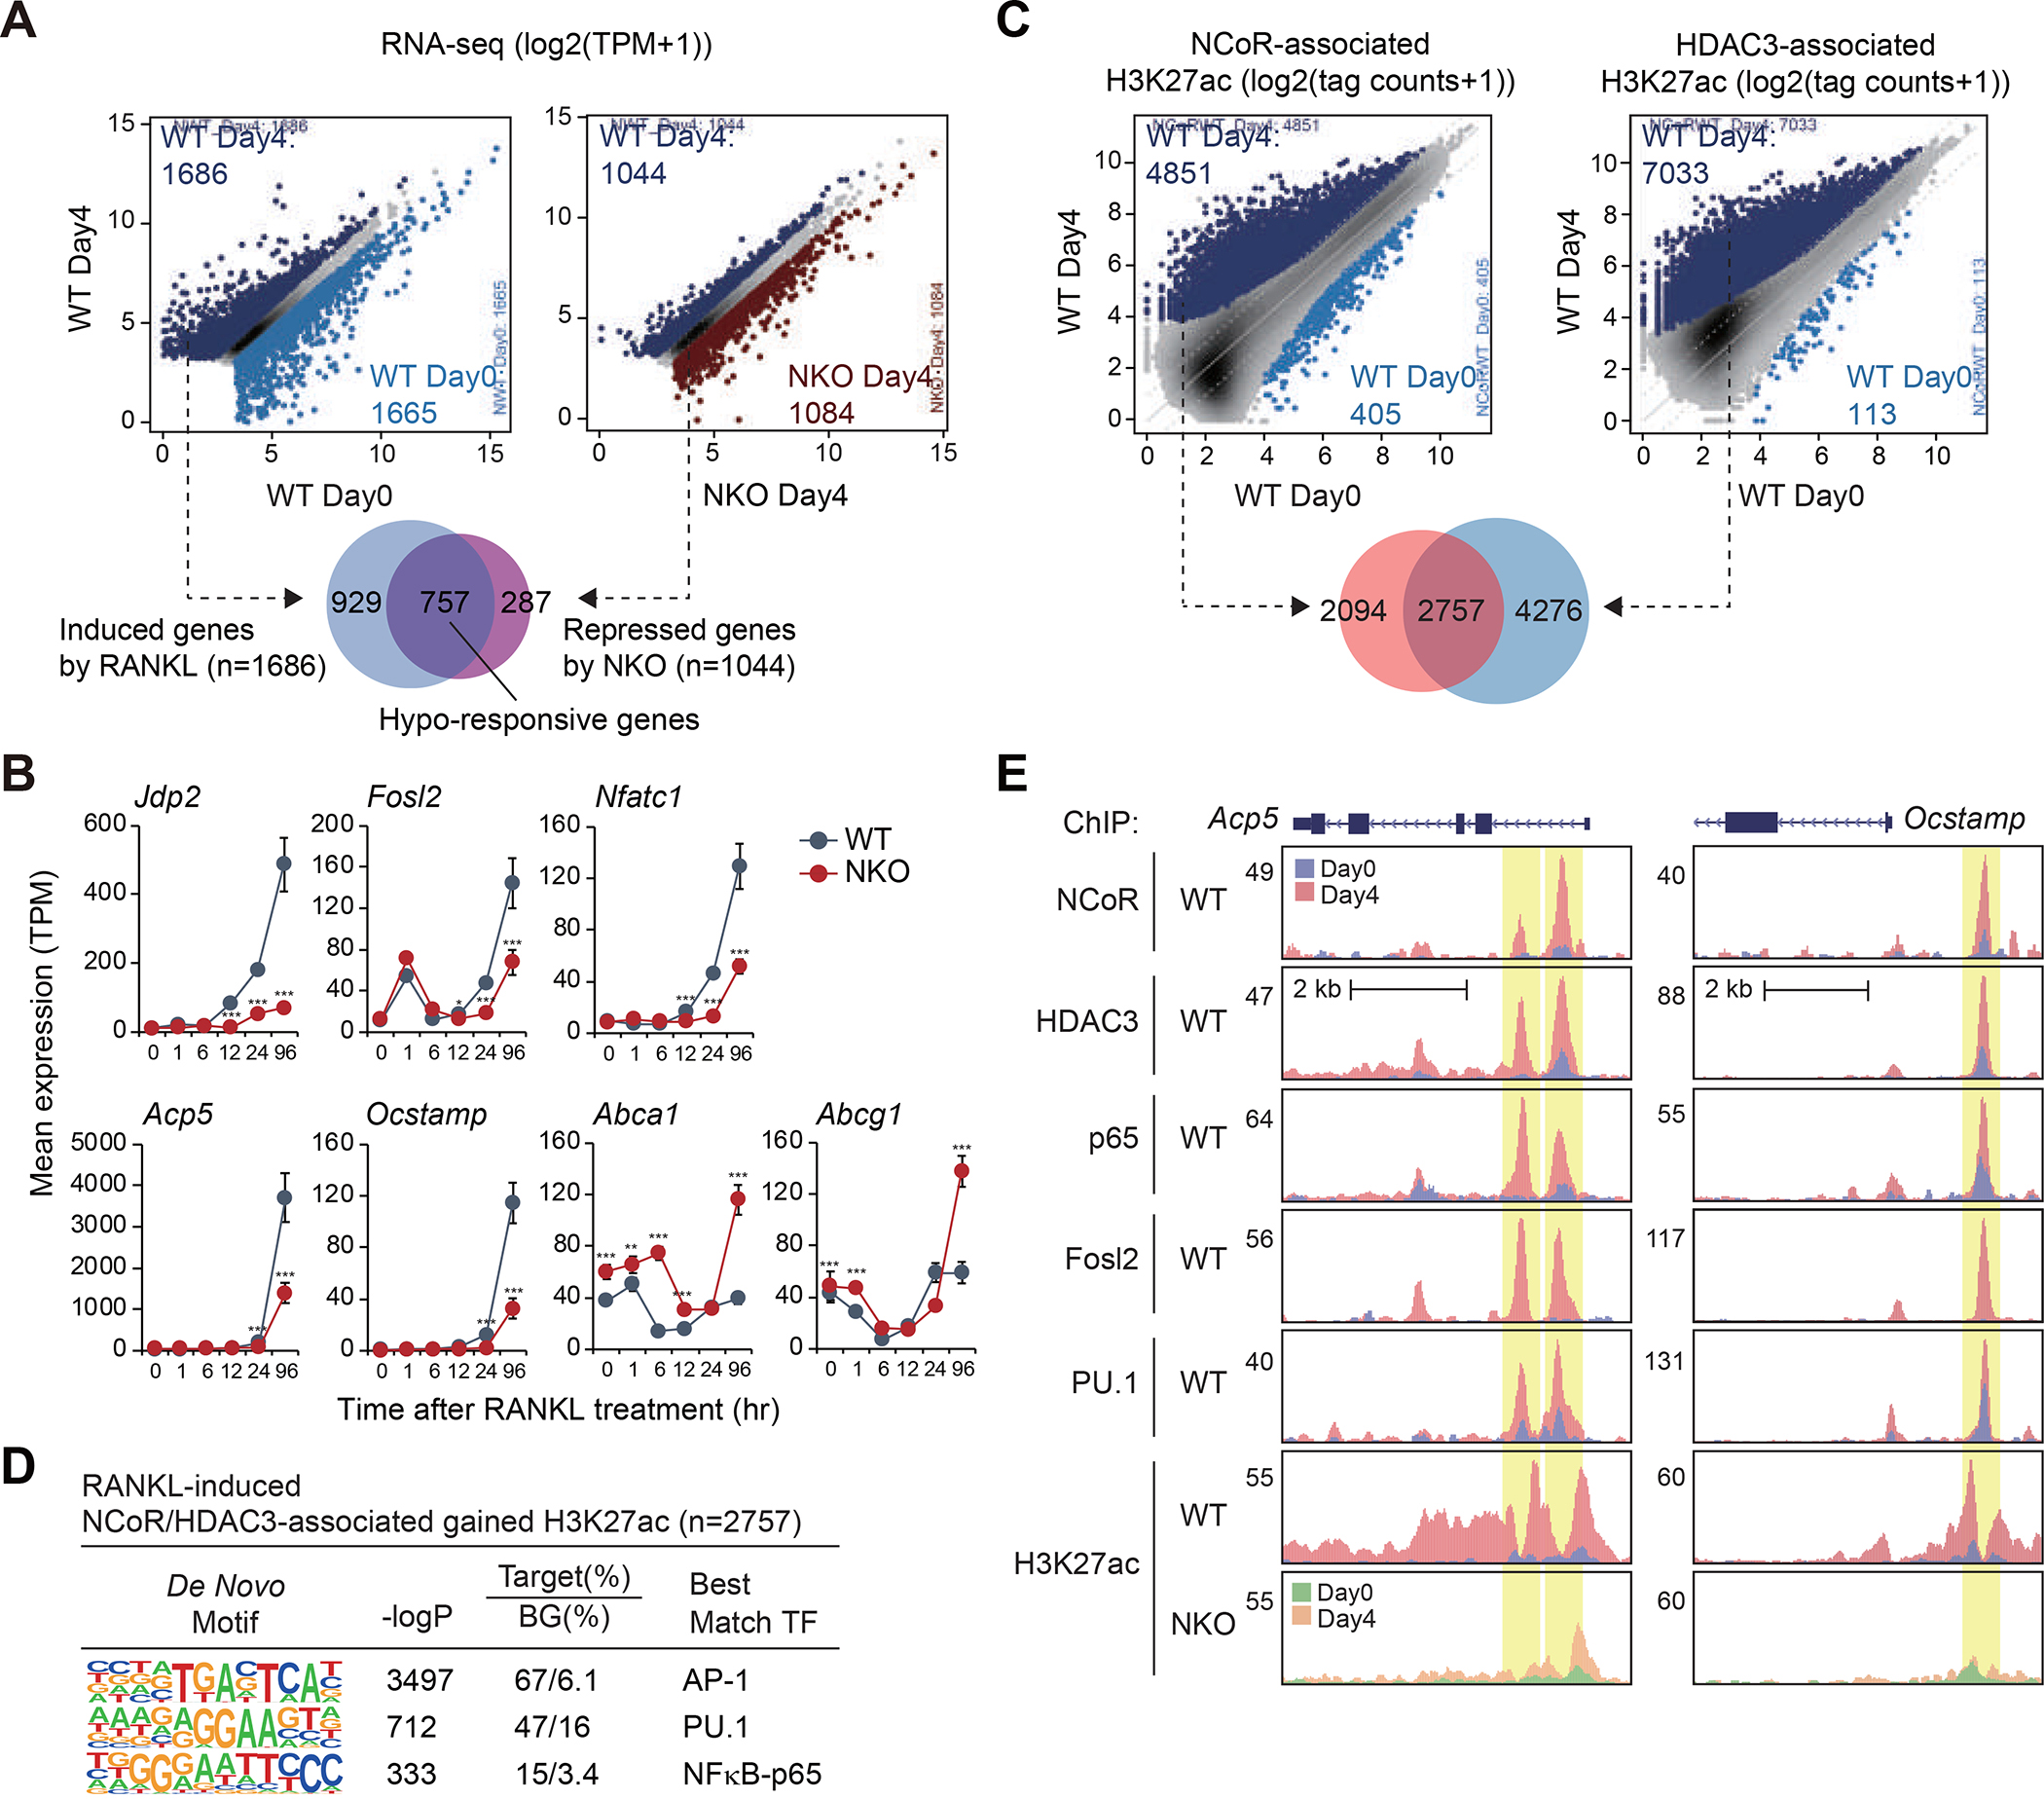
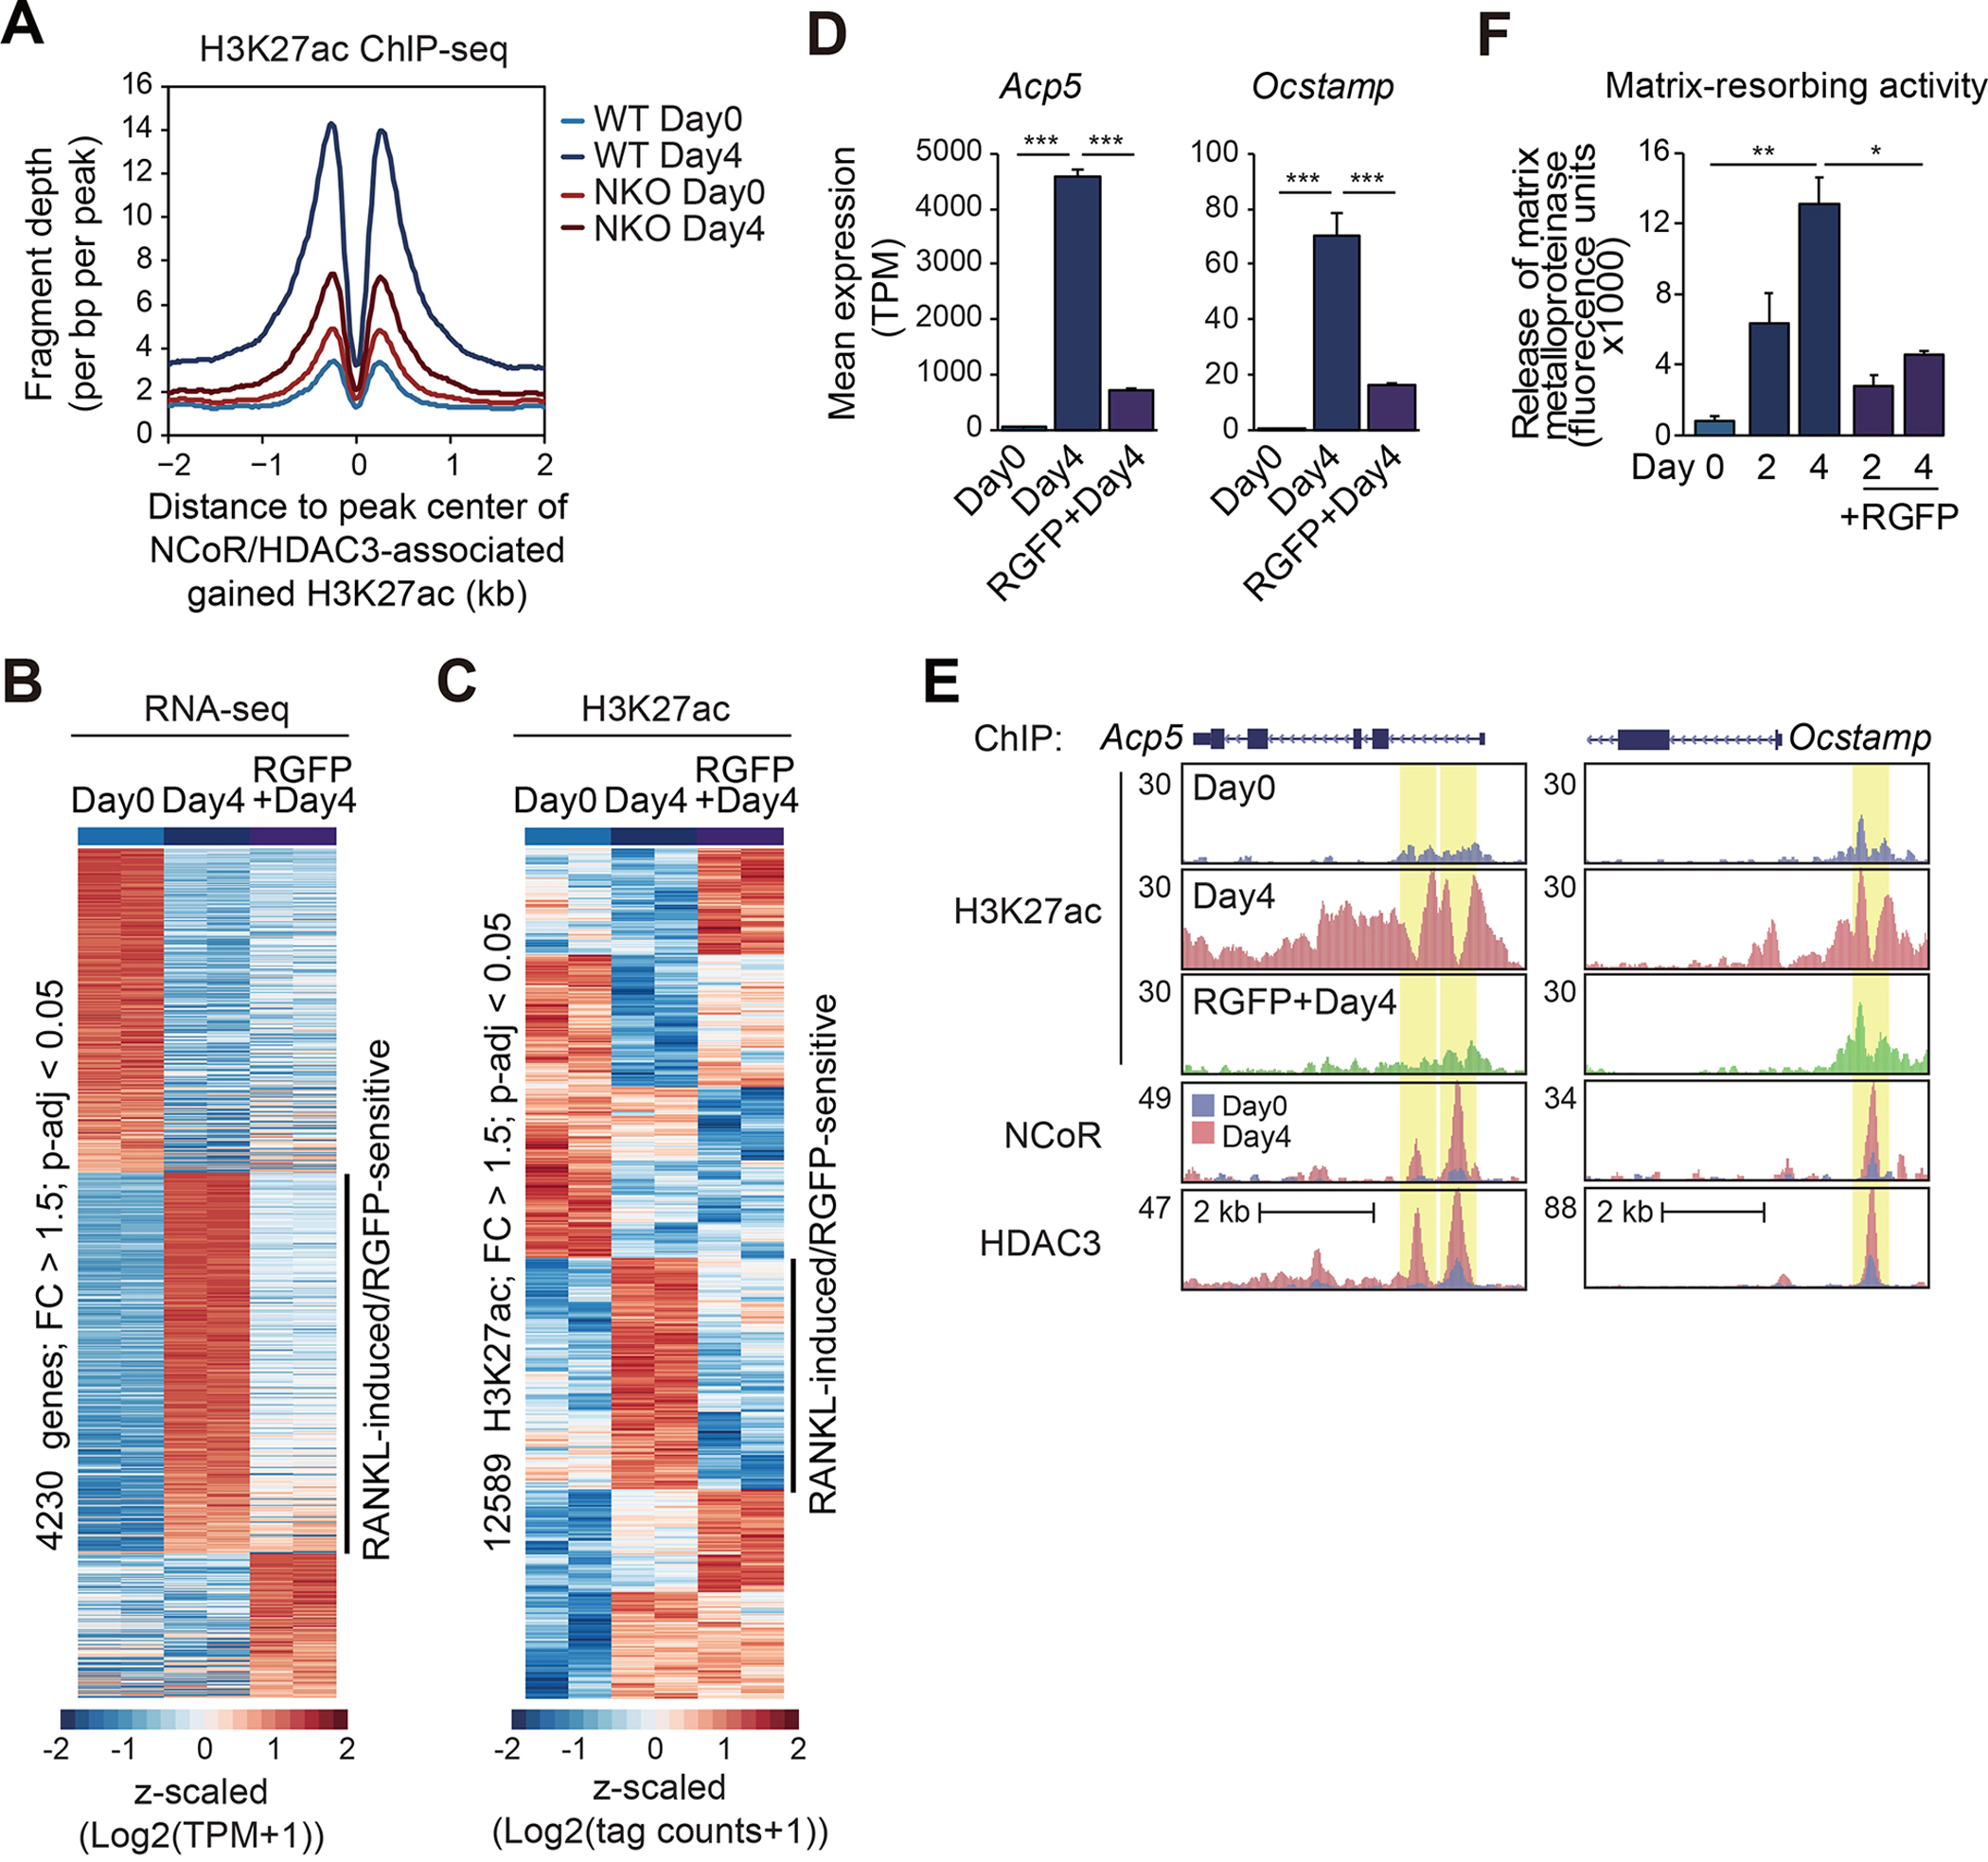
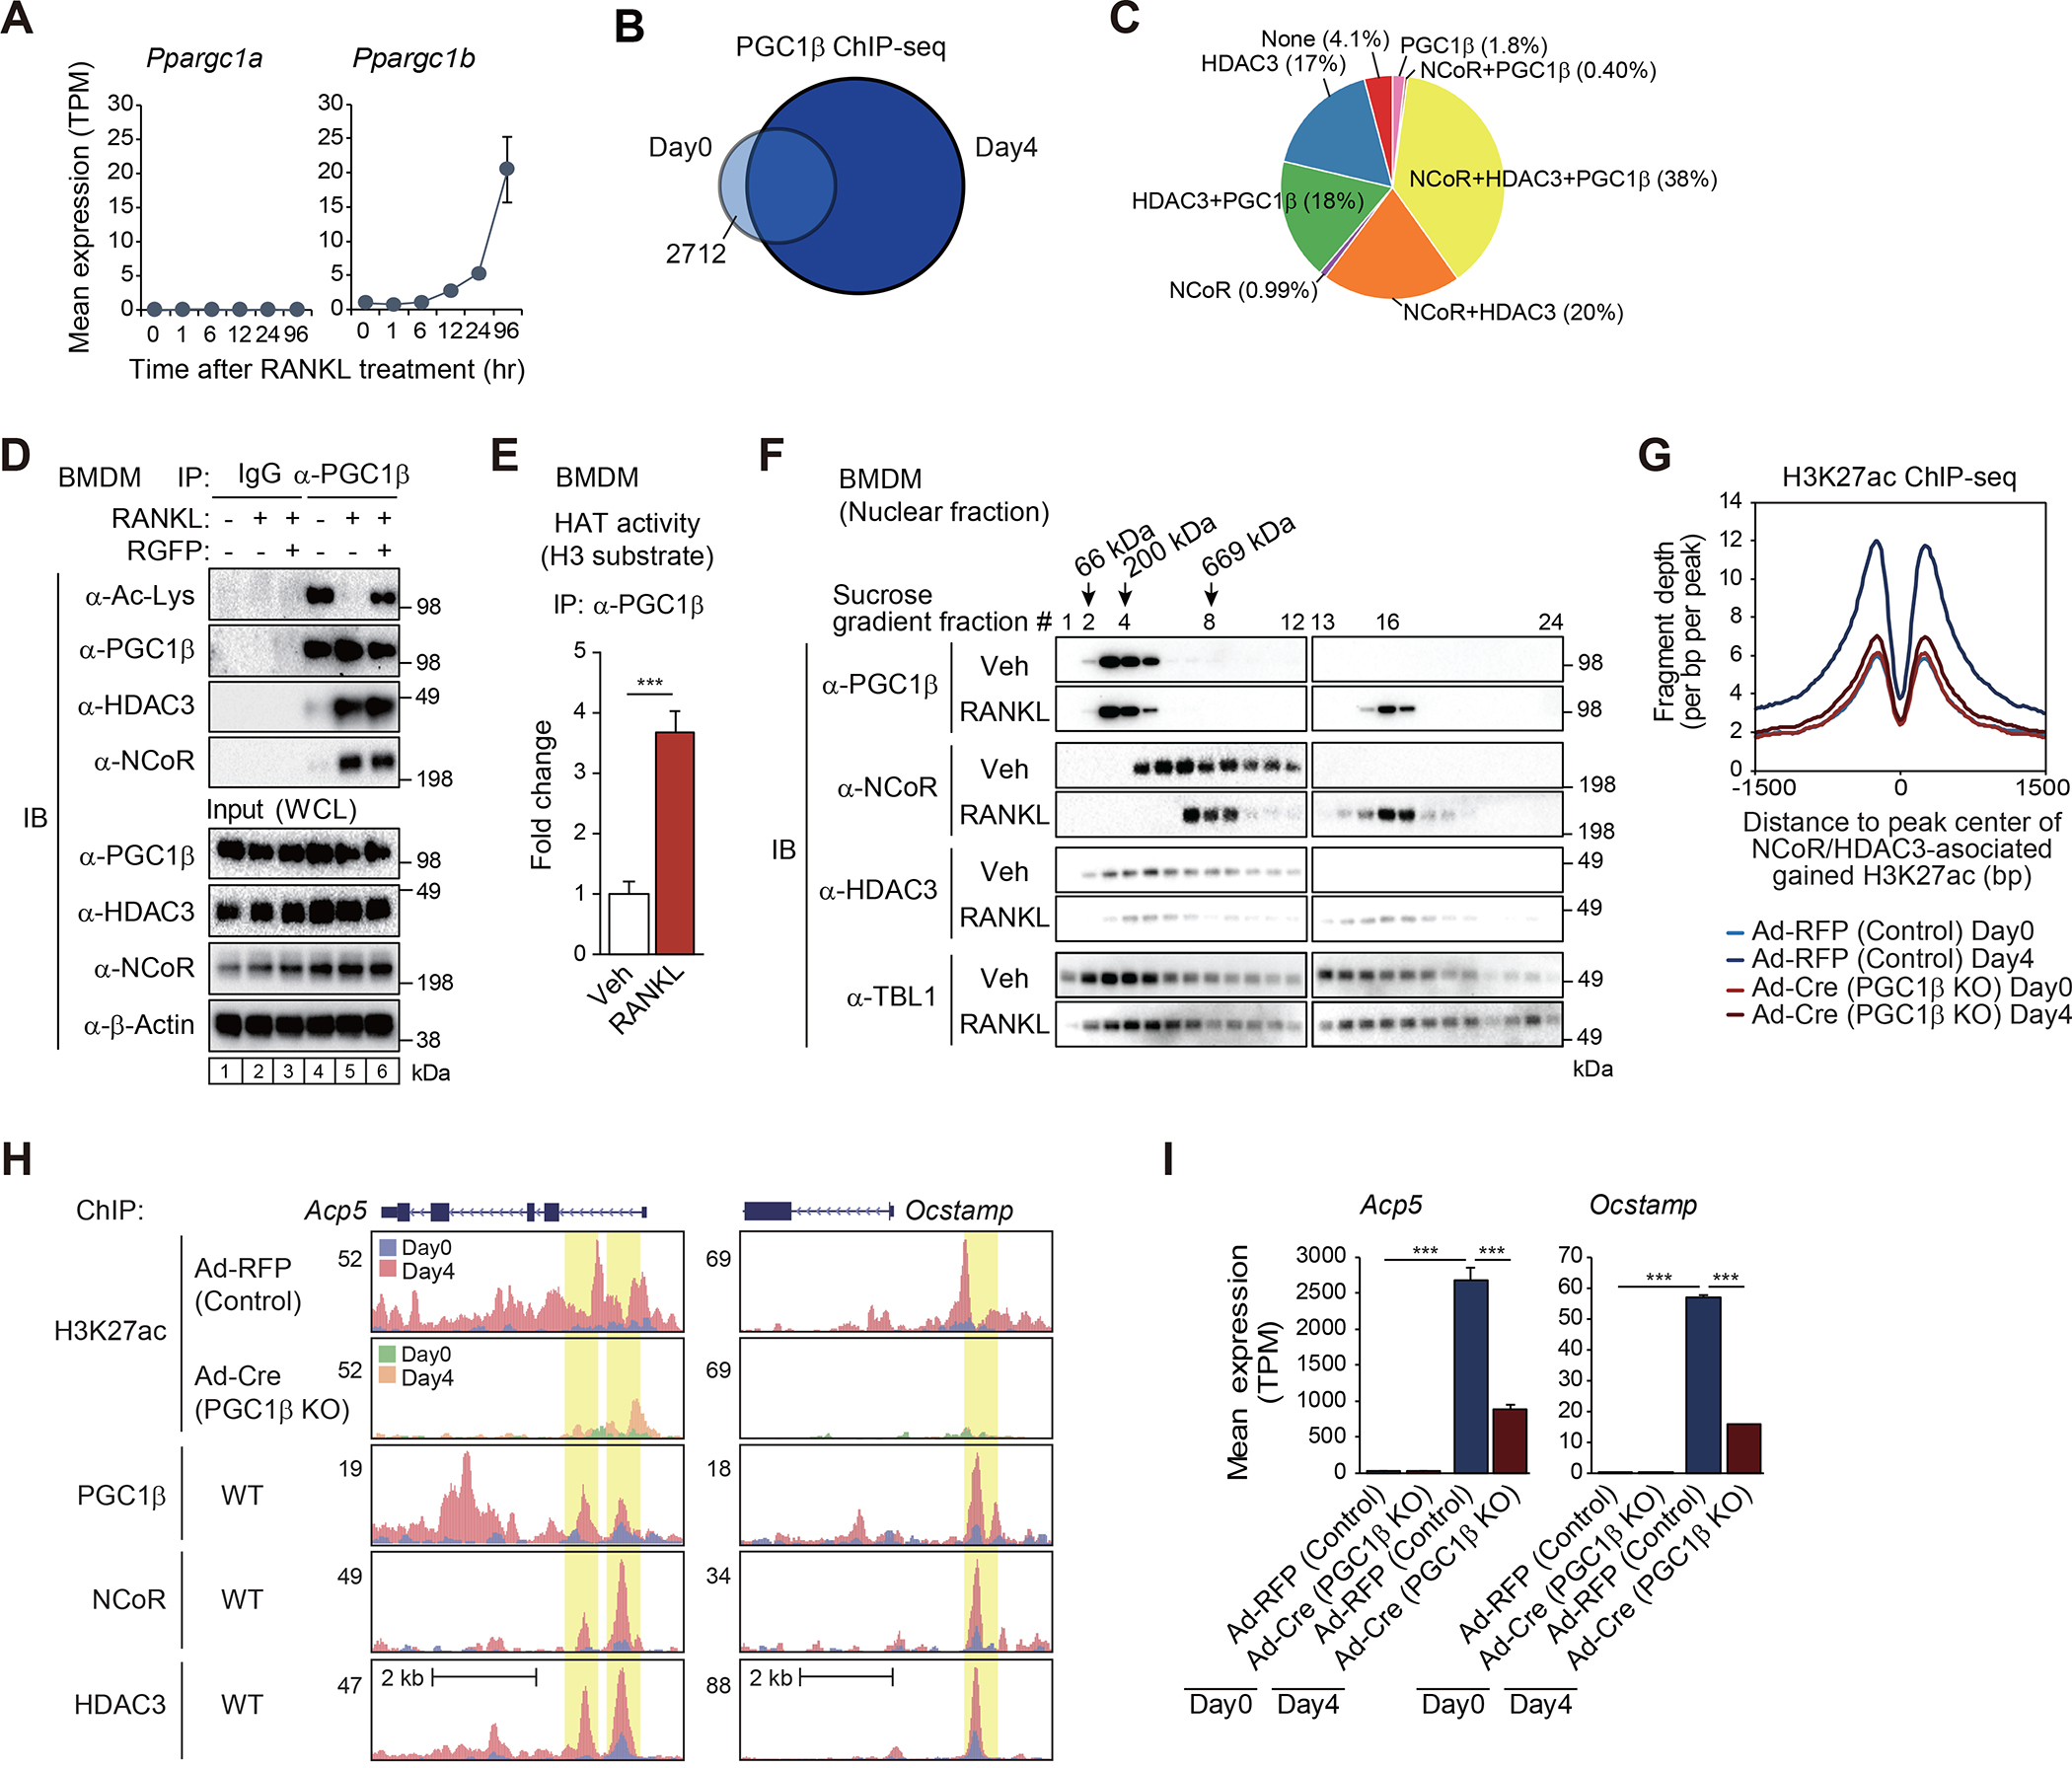
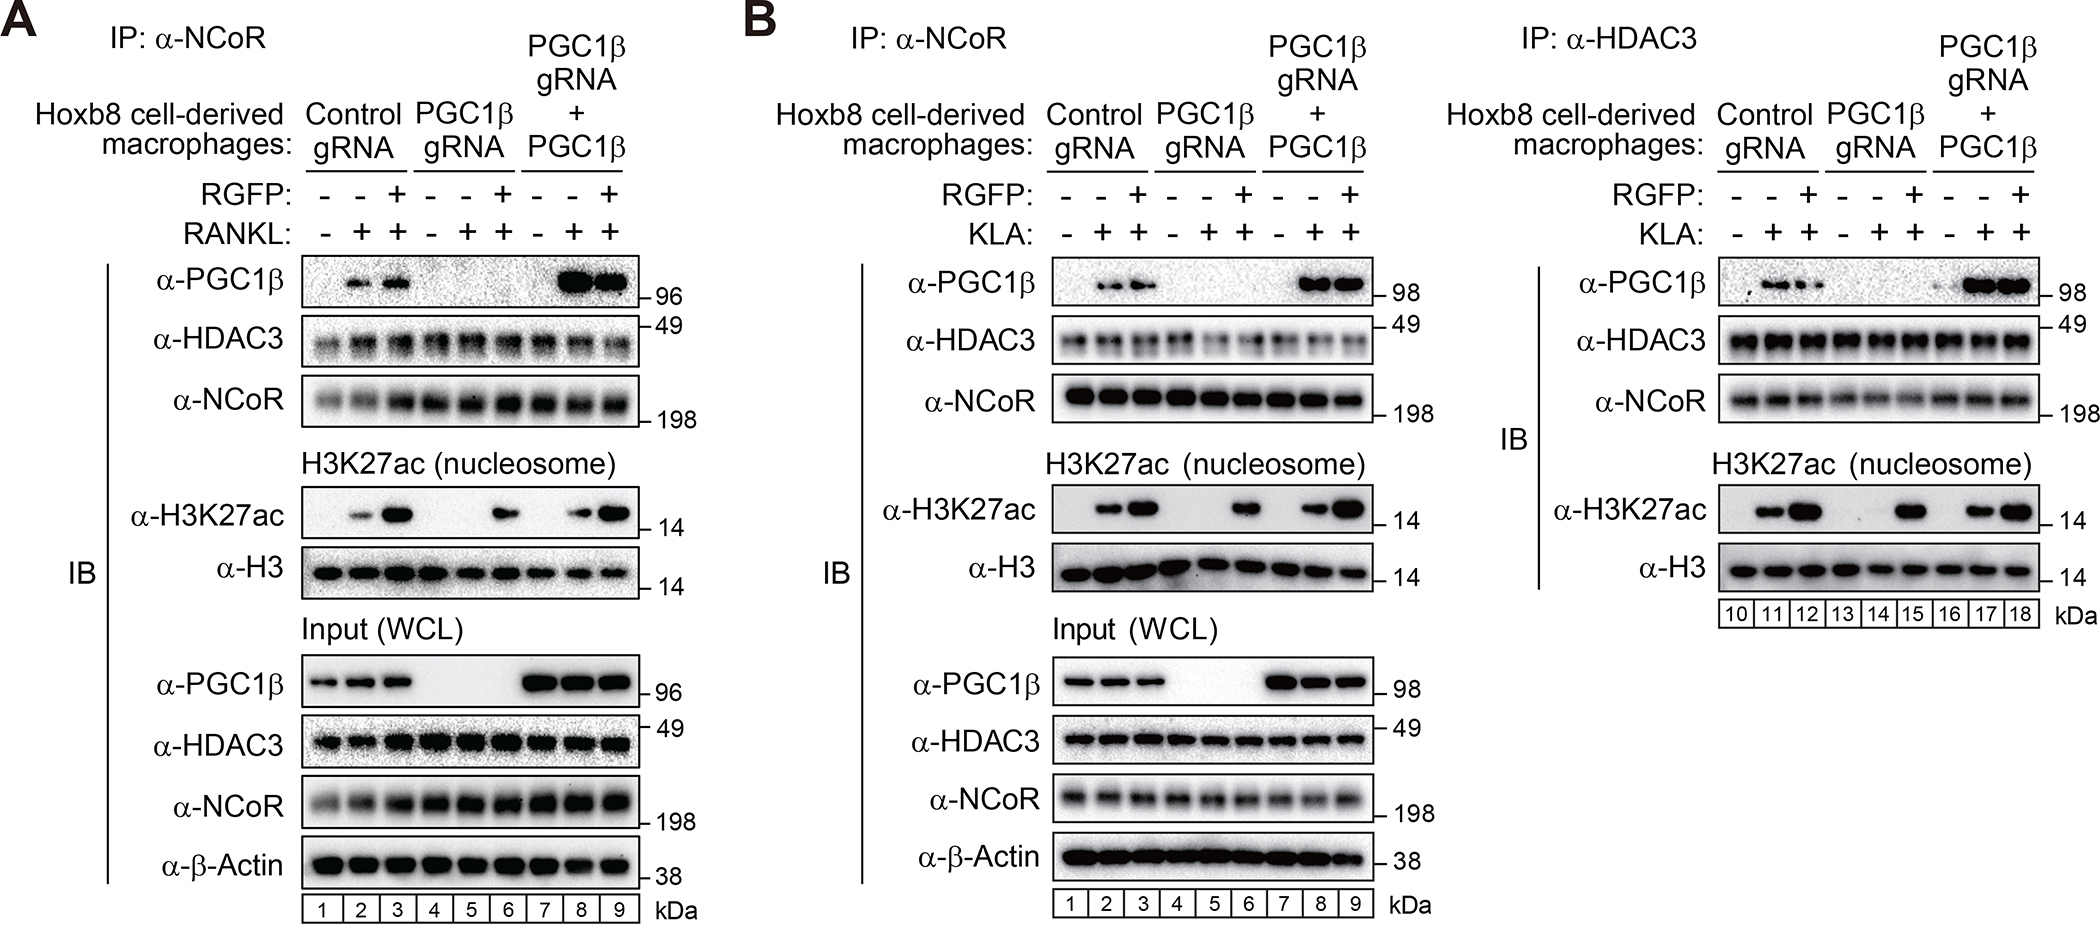
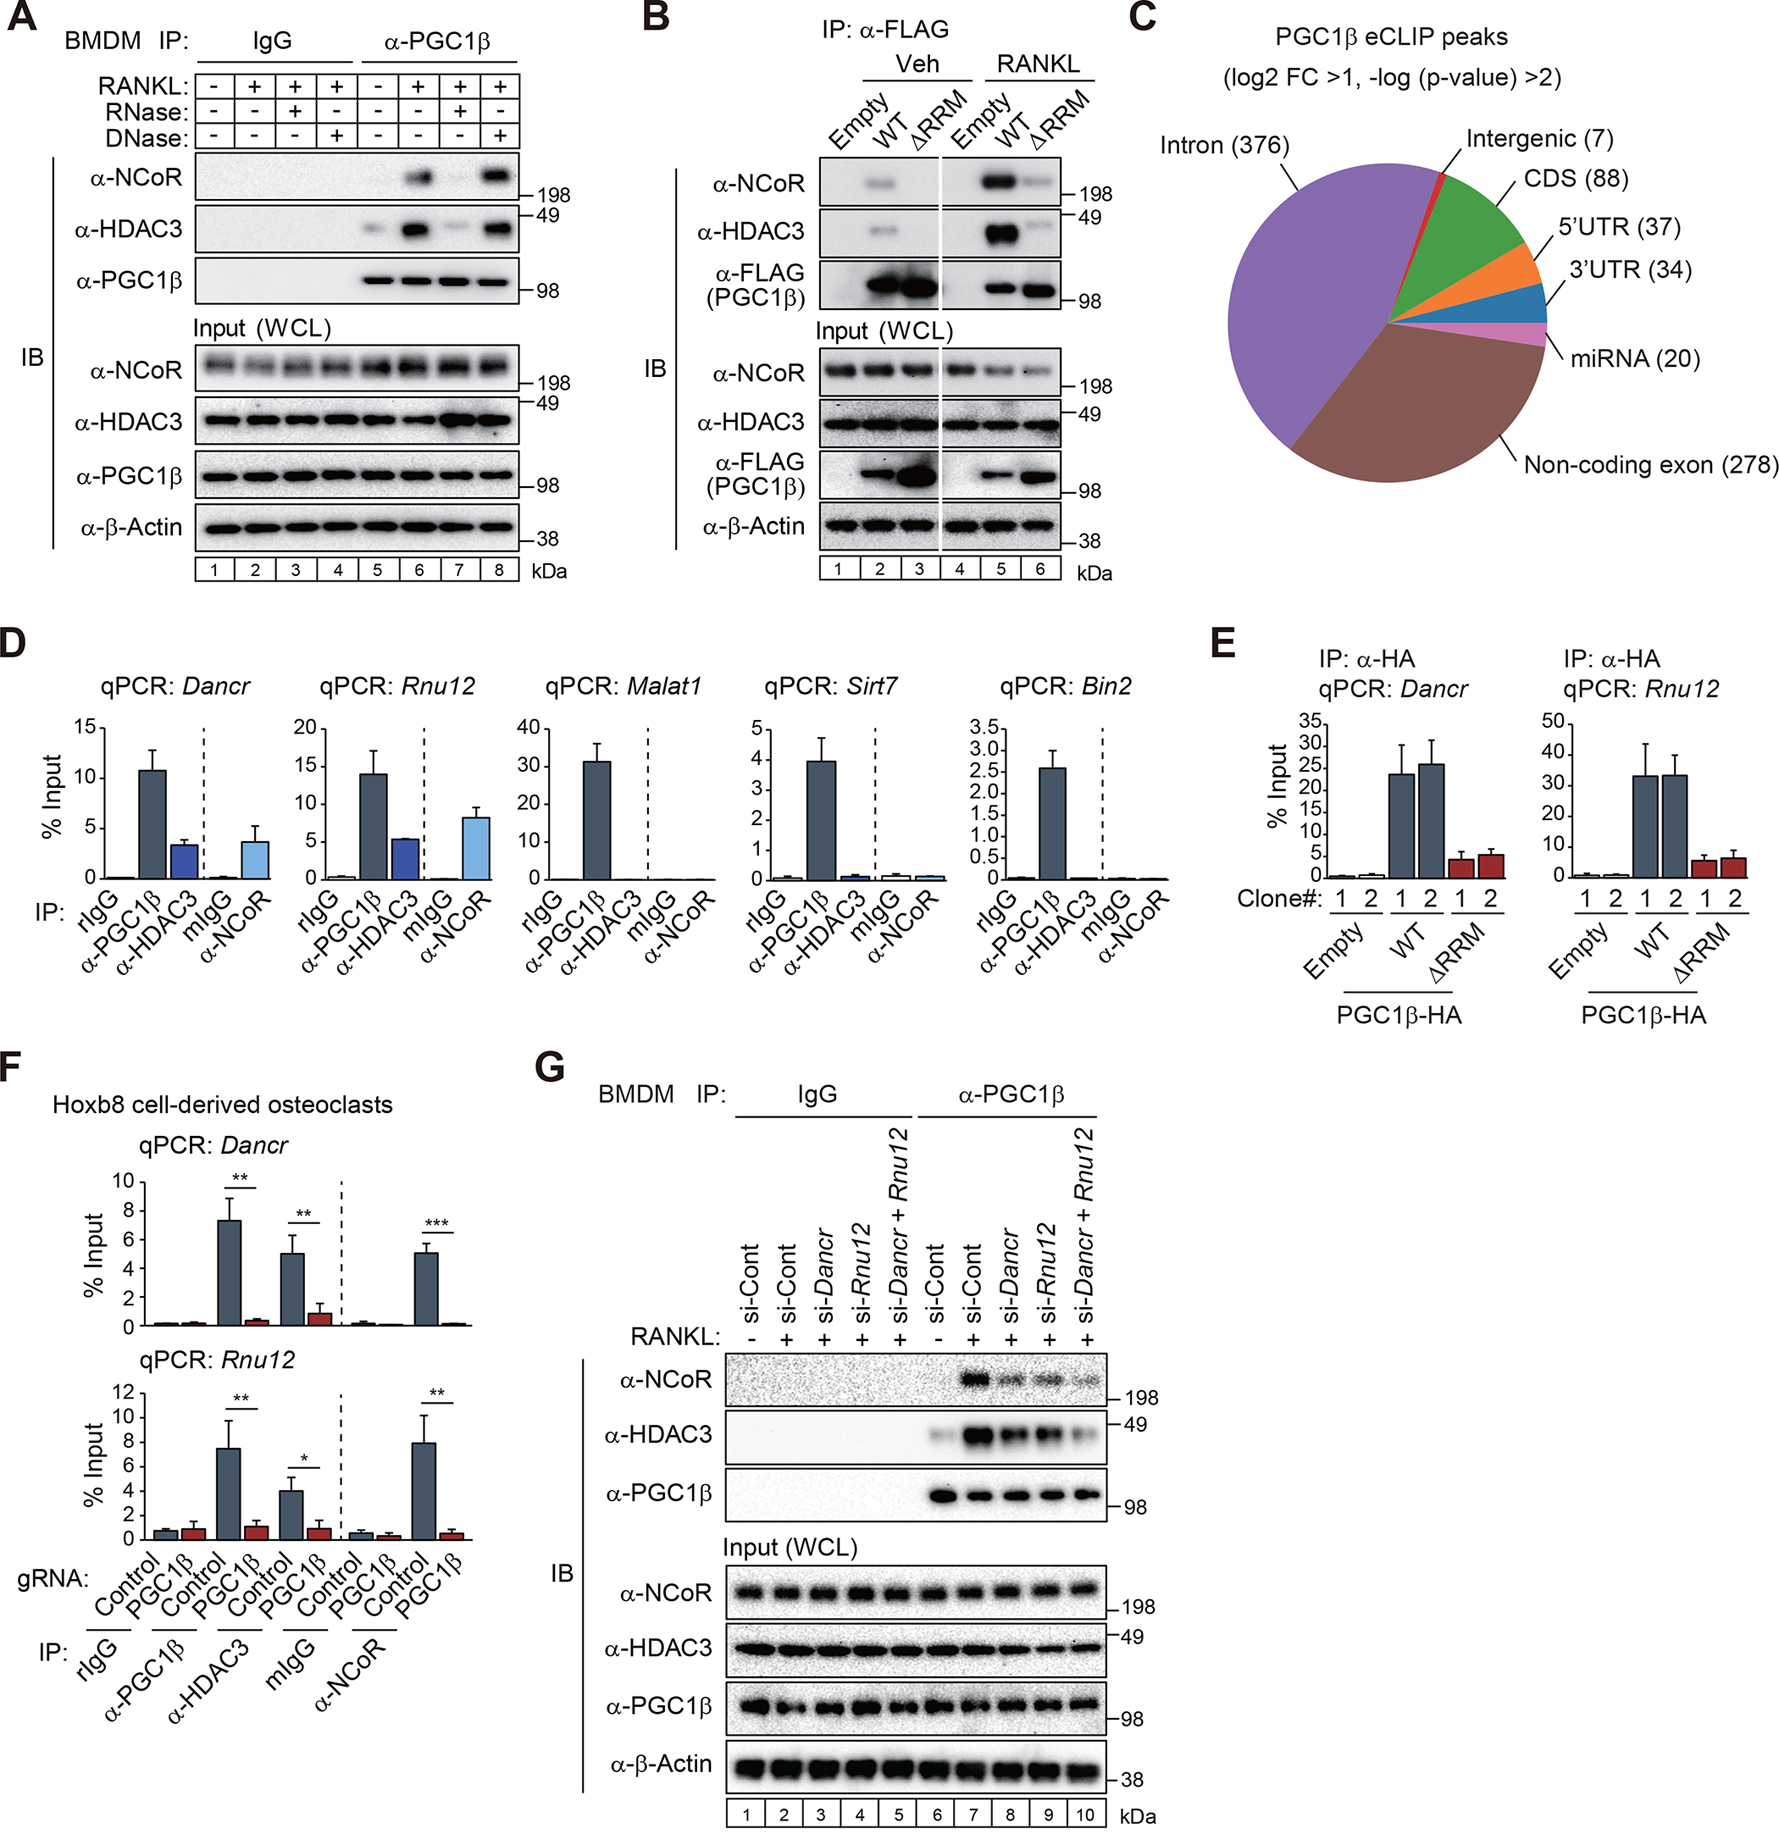
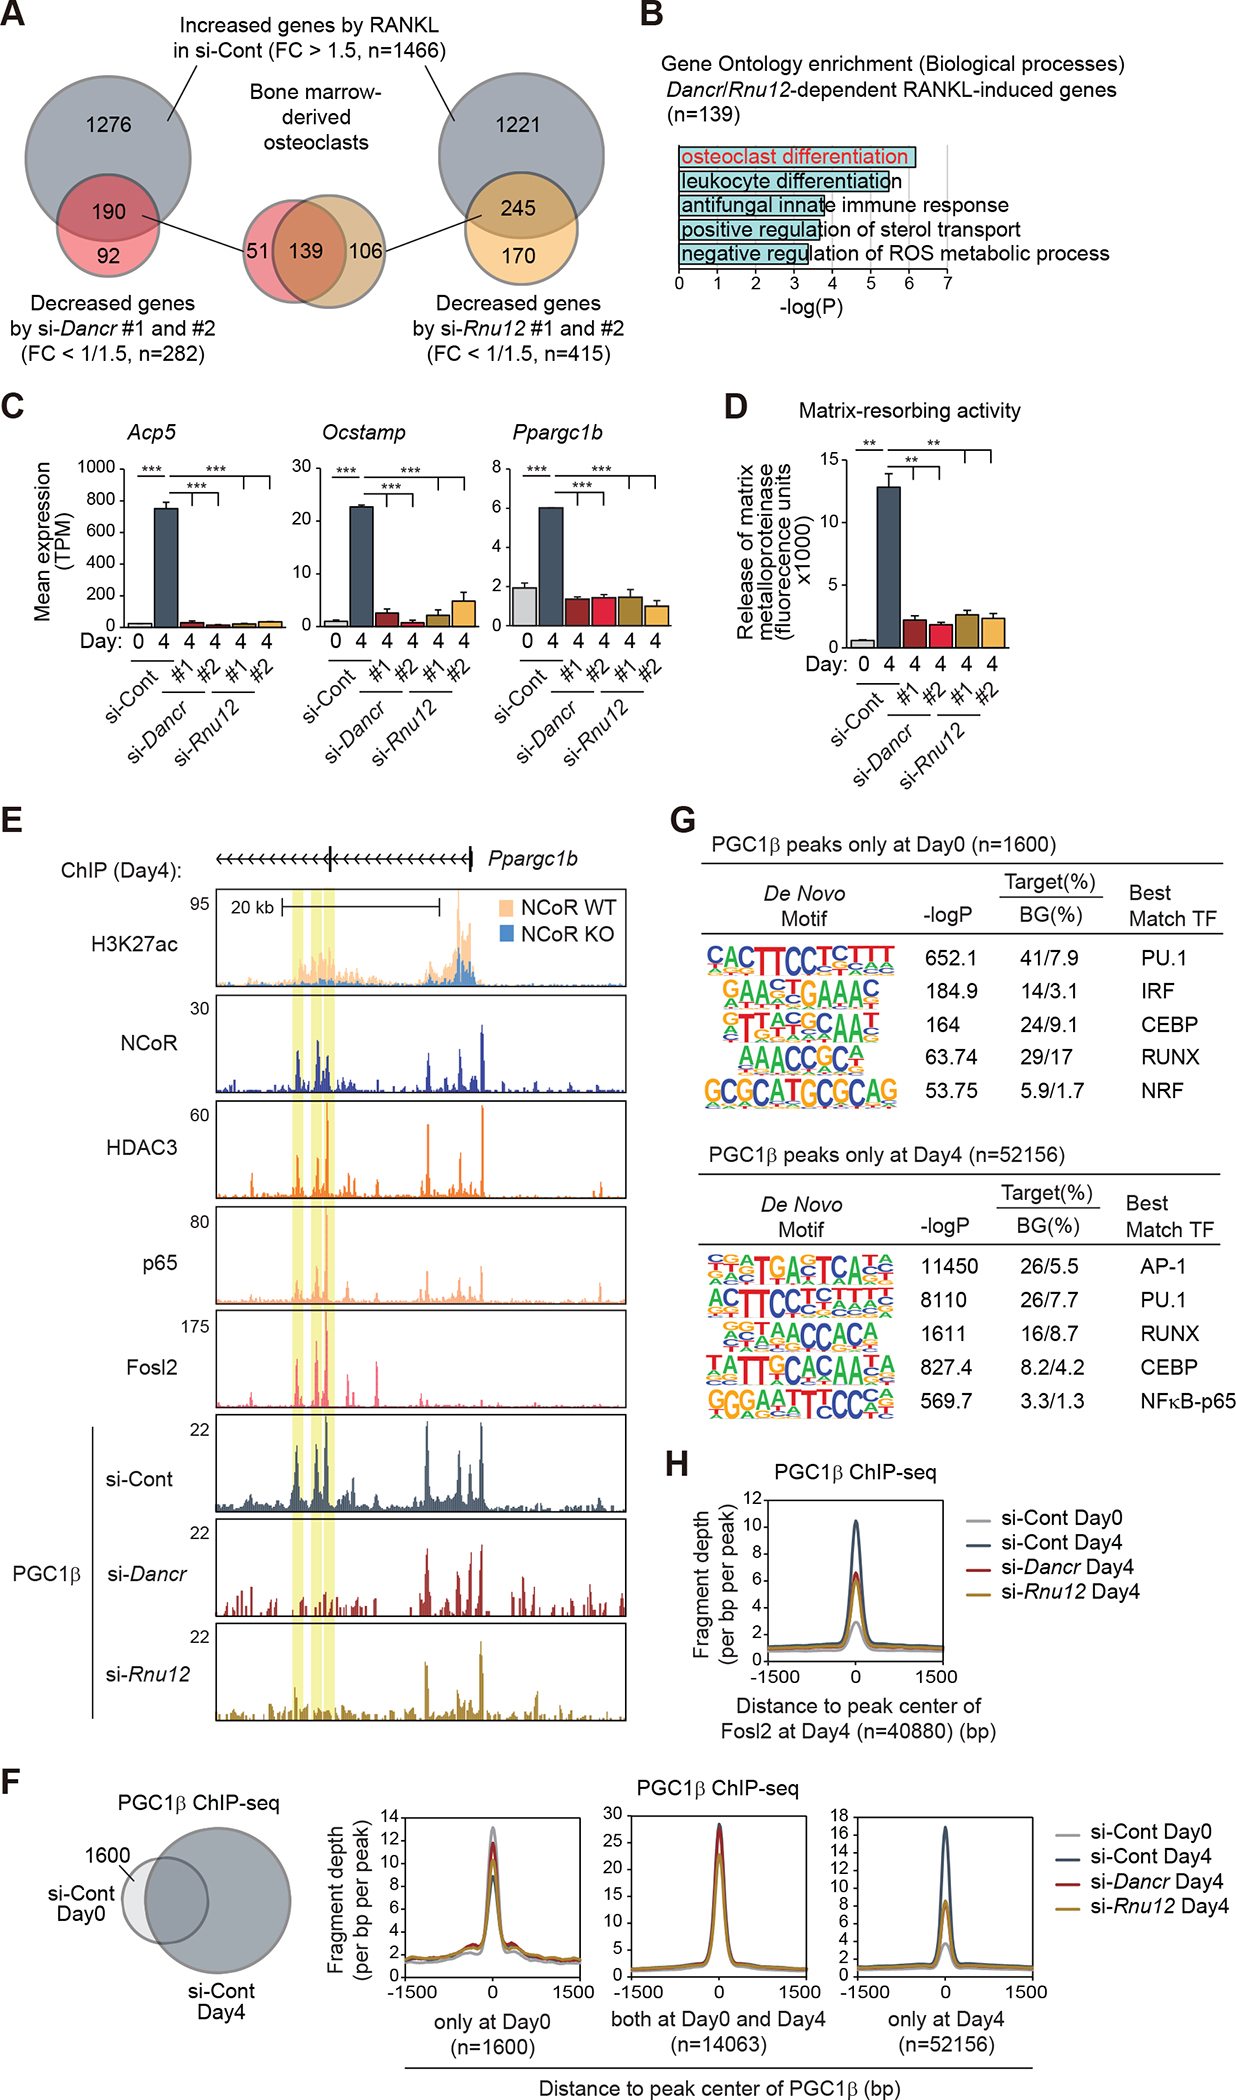
The nuclear receptor co-repressor (NCoR) complex mediates transcriptional repression dependent on histone deacetylation by histone deacetylase 3 (HDAC3) as a component of the complex. Unexpectedly, we found that signaling by the receptor activator of nuclear factor κB (RANK) converts the NCoR/HDAC3 co-repressor complex to a co-activator of AP-1 and NF-κB target genes that are required for mouse osteoclast differentiation. Accordingly, the dominant function of NCoR/HDAC3 complexes in response to RANK signaling is to activate, rather than repress, gene expression. Mechanistically, RANK signaling promotes RNA-dependent interaction of the transcriptional co-activator PGC1β with the NCoR/HDAC3 complex, resulting in the activation of PGC1β and inhibition of HDAC3 activity for acetylated histone H3. Non-coding RNAs Dancr and Rnu12, which are associated with altered human bone homeostasis, promote NCoR/HDAC3 complex assembly and are necessary for RANKL-induced osteoclast differentiation in vitro. These findings may be prototypic for signal-dependent functions of NCoR in other biological contexts.

Keywords: AP-1; H3K27ac; HDAC3; NCoR; NF-κB; PGC1β; RANK; co-activator; deacetylation; gene expression; non-coding RNA; osteoclast.


Conflict of interest statement

Declaration of interests C.K.G. is a co-founder, equity holder, and member of the Scientific Advisory Board of Asteroid Therapeutics. J.T.K. is on the Molecular Cell advisory board.

Figures

Figure 1.
Figure 1.. NCoR is required for osteoclast differentiation and normal bone development
(A, B) Representative microcomputed tomography (μCT) images of the femurs (A) in 5-month-old male WT and NKO or DKO mice. Trabecular bone volume, trabecular number, trabecular separation, trabecular thickness and bone mineral density in the femurs (B) determined by μCT analysis. All box plots show the interquartile range. Data are mean ± s.d. (n=6–8 each). Student’s t-test was performed for comparisons. (C) Immunoblot analysis for ACP5 protein in whole bone (tibia and femur) from 5-month-old male WT and NKO or DKO mice (n=3 each). (D) Serum deoxypyridinoline and osteocalcin concentrations in 5-month-old male WT and NKO or DKO mice. Data are mean ± s.e.m. (n=4 biological replicates). Student’s t-test was performed for comparisons. (E) Quantitative analysis of osteoclast number (upper panel) and surface area (lower panel) in the femurs from 5-month-old male WT and NKO mice. Data are mean ± s.e.m. (n=6 each). Student’s t-test was performed for comparisons. (F) Representative TRAP-stained cell images showing the effect of NKO or DKO on bone marrow-derived osteoclast formation at Day0 and Day4 after RANKL treatment (12-week-old male mice). (G) Matrix-resorbing activity on bone marrow derived-osteoclasts from WT and NKO or DKO mice (12-week-old male) in the presence of only M-CSF or M-CSF plus RANKL. Data are mean ± s.d. (n=3 biological replicates). Analysis of variance was performed followed by Tukey’s post hoc comparison. For panels B, D, E and G; *p < 0.05, **p < 0.01 and ***p < 0.001. See also Figure S1.
Figure 2.
Figure 2.. NCoR/HDAC3 complexes bind to RANKL-induced enhancers and promoters
(A) Scatter plots of RNA-seq data showing RANKL-regulated gene expression in WT cells (left panel) and NKO-regulated gene expression in the presence of RANKL (right panel) (light blue dots in left panel: significantly RANKL-suppressed genes, dark blue dots in left panel: significantly RANKL-induced genes, dark red dots in right panel: significant NKO-induced genes, dark blue dots in right panel: significant NKO-suppressed genes, FDR < 0.05, FC > 1.5). The overlap between RANKL-induced genes in WT cells (n=1686) and NKO-suppressed genes in the presence of RANKL (n=1044) is shown by Venn diagram. (B) Expression of Jdp2, Fosl2, Nfatc1, Acp5, Ocstamp, Abca1 and Abcg1 in WT and NKO cells as a function of time following RANKL treatment. The significance symbols indicate statistical significance comparing NKO to WT, *p-adj < 0.05, **p-adj < 0.01 and ***p-adj < 0.001. (C) Scatter plot of distal NCoR (41058 peaks in Figure S2C)- (left panel) or HDAC3 (31832 peaks in Figure S2D)- (right panel) associated H3K27ac in WT at Day0 vs. WT at Day4. RANKL-induced NCoR- or HDAC3-associated H3K27ac peaks (FDR < 0.05, FC > 2) are color-coded (light blue dots: significantly NCoR- or HDAC3-associated lost H3K27ac in WT at Day4, dark blue dots: significantly NCoR- or HDAC3-associated gained H3K27ac in WT at Day4). The overlap between NCoR-associated gained H3K27ac (n=4851) and HDAC3-associated gained H3K27ac (n=7033) is shown by Venn diagram. (D) De novo motif enrichment analysis of RANKL-induced NCoR and HDAC3-associated gained H3K27ac peaks (n=2757 in Figure 2C) using a GC-matched genomic background. (E) Genome browser tracks of NCoR, HDAC3, p65, Fosl2, PU.1 and H3K27ac ChIP-seq peaks in the vicinity of the Acp5 and Ocstamp loci at Day0 and Day4 after RANKL treatment. Yellow shading: RANKL-induced peaks. See also Figure S2.
Figure 3.
Figure 3.. NCoR and HDAC3 activity are required for RANKL-induced H3K27 acetylation
(A) Normalized distribution of H3K27ac tag density in WT and NKO at the vicinity of NCoR and HDAC3-associated gained H3K27ac peaks in WT at Day4 after RANKL treatment (n=2757 in Figure 2C). (B) Heatmap of differential gene expression (FC > 1.5, p-adj < 0.05) in WT cells treated with the combination of RGFP966 with RANKL. (C) Heatmap of differential H3K27ac ChIP-seq IDR peaks associated with ATAC-seq IDR peaks (FC > 1.5, p-adj < 0.05) at Day0 in a 1000 bp window. (D) Bar plots for expression of Acp5 and Ocstamp. ***p-adj < 0.001. (E) Genome browser tracks of H3K27ac ChIP-seq peaks in WT at Day0 and Day4 with or without RGFP966, and NCoR and HDAC3 ChIP-seq peaks in WT at Day0 and Day4 in the vicinity of the Acp5 and Ocstamp loci. Yellow shading: RANKL-induced RGFP966-sensitive peaks. (F) RANKL-induced matrix-resorbing activity on bone marrow cells from WT mice (12-week-old male) in the presence or absence of RGFP966. Data are mean ± s.e.m. (n=3 biological replicates). Analysis of variance was performed followed by Tukey’s post hoc comparison. *p < 0.05 and **p < 0.01. See also Figure S3.
Figure 4.
Figure 4.. RANK signaling induces NCoR/HDAC3/PGC1β interaction required for H3K27 acetylation
(A) Expression of Ppargc1a and Ppargc1b in WT cells as a function of time following RANKL treatment. (B) The overlap between IDR-defined PGC1β ChIP-seq peaks at Day0 and at Day4 is shown by Venn diagram. (C) The overlaps of ATAC-defined gained H3K27ac peaks in the presence of RANKL (n=1525 in Figure S2E) with NCoR, HDAC3 and/or PGC1β ChIP-seq peaks at Day4 are shown by pie chart. (D) BMDMs were treated with or without RANKL for 6 hours in the presence or absence of RGFP966, and then the whole-cell lysates (WCL) were subjected to immunoprecipitation (IP) using anti-PGC1β antibody and immunoblot (IB) analysis with anti-acetylated lysine, PGC1β, HDAC3 or NCoR antibody. (E) Histone acetyltransferase (HAT) activity of immunoprecipitated PGC1β protein in whole-cell lysates from BMDMs treated with or without RANKL for 6 hours was measured in the presence of acetyl-CoA and histone H3 substrate. Data are mean ± s.d. (n=3 biological replicates). Student’s t-test was performed for comparisons. ***p < 0.001. (F) 10–30% sucrose density gradient centrifugation was performed on nuclear fractions from BMDMs treated with or without RANKL for 6 hours. All fractions (1–24, top to bottom) were subjected to IB analysis with anti-PGC1β, NCoR, HDAC3 or TBL1 antibody. The molecular weight standards are indicated at the top of the panel; 66 kDa, bovine serum albumin; 200 kDa, β-amylase; 669 kDa, thyroglobulin. (G) Normalized distribution of H3K27ac ChIP-seq tag density in control (Ad-RFP) and PGC1β KO (Ad-Cre) at the vicinity of NCoR and HDAC3-associated gained H3K27ac peaks in WT at Day4 after RANKL treatment (n=2757 in Figure 2C). (H) Genome browser tracks of H3K27ac, PGC1β, NCoR and HDAC3 ChIP-seq peaks in the vicinity of Acp5 and Ocstamp loci. Yellow shading: lost H3K27ac by PGC1β KO at RANKL-induced NCoR, HDAC3 and PGC1β binding regions. (I) Bar plots for expression of Acp5 and Ocstamp in control (Ad-RFP) and PGC1β KO (Ad-Cre) at Day0 and Day4 after RANKL treatment. ***p-adj < 0.001. See also Figure S4.
Figure 5.
Figure 5.. RANK and TLR4-induced interaction of PGC1β with NCoR/HDAC3 prevents histone deacetylation by HDAC3
(A, B) Exogenous PGC1β was transiently expressed in PGC1β gRNA-introduced Cas9-Hoxb8 macrophages. Immunoprecipitants with anti-NCoR or HDAC3 antibody in the cells treated with or without RANKL (A) or KLA (B) for 6 hours in the presence or absence of RGFP966 were incubated with nucleosomal H3K27ac followed by immunoblotting with anti-H3K27ac or H3 antibody.
Figure 6.
Figure 6.. The PGC1β RRM mediates RNA-dependent interaction with NCoR/HDAC3 complexes
(A) Bone marrow-derived macrophages (BMDMs) were treated with or without RANKL for 6 hours, and then the whole-cell lysates (WCL) were subjected to immunoprecipitation (IP) using anti-PGC1β antibody. The immunoprecipitants were incubated with RNase or DNase followed by immunoblot (IB) analysis with anti-NCoR, HDAC3 or PGC1β antibody. (B) FLAG-tagged PGC1β WT or RNA-recognition motif deletion mutant (ΔRRM) expressed RAW 264.7 cells were treated with or without RANKL for 6 hours, and then the whole-cell lysates (WCL) were subjected to IP using anti-FLAG antibody followed by IB analysis with anti-NCoR, HDAC3 or FLAG antibody. (C) High confidence PGC1β eCLIP peaks in RAW 264.7 cells treated with RANKL for 4 days (n=2 biological replicates) were evenly split between protein-coding and non-coding transcripts. (D) RNA immunoprecipitation (RIP)-qPCR for Dancr, Rnu12, Malat1, Sirt7 or Bin2 using anti-PGC1β, HDAC3 or NCoR antibody in RAW 264.7 cells treated with RANKL for 4 days. Control rabbit IgG (rIgG) for anti-PGC1β and HDAC3 antibodies and control mouse IgG (mIgG) for anti-NCoR antibody were used. Data are mean ± s.d. (n=2 biological replicates). (E) RIP-qPCR for Dancr or Rnu12 using anti-HA tag antibody in HA-tagged PGC1β (WT or ΔRRM) or the empty (Emp) vector-introduced RAW 264.7 cells in the presence of RANKL and doxycycline (Dox) for 4 days. Data are mean ± s.e.m. (n=4 biological replicate). (F) RIP-qPCR for Dancr or Rnu12 using anti-PGC1β, HDAC3 or NCoR antibody in PGC1β gRNA or control gRNA-introduced Cas9-Hoxb8 cells treated with RANKL for 4 days. Data are mean ± s.e.m. (n=3 biological replicates). Student’s t-test was performed for comparisons. *p < 0.05, **p < 0.01 and ***p < 0.001. (G) IB analysis showing interaction of PGC1β with NCoR/HDAC3 in Dancr and Rnu12 siRNA knockdown BMDMs. Whole-cell lysates (WCL) were subjected to IP using anti-PGC1β antibody followed by IB analysis with anti-NCoR, HDAC3 or PGC1β antibody. See also Figure S5.
Figure 7.
Figure 7.. Dancr and Rnu12 are required for RANKL-induced osteoclast differentiation
(A) The overlaps between RANKL-induced genes in si-Cont (FC > 1.5, FDR < 0.05) and suppressed genes by si-Dancr (left, #1 and #2) or si-Rnu12 (right, #1 and #2) (FC < 1/1.5, FDR < 0.05) in bone marrow-derived osteoclasts are shown by Venn diagram. (B) Significant gene ontology terms associated with Dancr/Rnu12-dependent RANKL-induced genes (n=139 in Figure 7A). (C) Bar plots for expression of Acp5, Ocstamp and Ppargc1b in siRNA (si-Cont, si-Dancr or si-Rnu12)-introduced bone marrow cells at Day0 and Day4 after RANKL treatment. ***p-adj < 0.001. (D) Matrix-resorbing activity on siRNA (si-Cont, si-Dancr or si-Rnu12)-introduced bone marrow cells at Day0 and Day4 after RANKL treatment. Data are mean ± s.e.m. (n=3 biological replicates). Analysis of variance was performed followed by Tukey’s post hoc comparison. **p < 0.01. (E) Genome browser tracks of H3K27ac, NCoR, HDAC3, p65, Fosl2 and PGC1β ChIP-seq peaks in bone marrow cells at Day4 after RANKL treatment in the vicinity of Ppargc1b locus. Yellow shading: lost PGC1β peak by knockdown of Dancr/Rnu12. (F) The overlap between IDR-defined PGC1β ChIP-seq peaks in control siRNA-introduced bone marrow cells at Day0 and Day4 after RANKL treatment is shown by Venn diagram. Normalized distribution of PGC1β ChIP-seq tag density in siRNA (si-Cont, si-Dancr or si-Rnu12)-introduced bone marrow cells at the vicinity of PGC1β binding regions at Day0 and/or Day4. (G) De novo motif enrichment analysis of PGC1β peaks at Day0 (n=1600 in Figure 7F) and at Day4 (n=52156 in Figure 7F) using a GC-matched genomic background. (H) Normalized distribution of PGC1β ChIP-seq tag density in siRNA (si-Cont, si-Dancr or si-Rnu12)-introduced bone marrow cells at the vicinity of Fosl2 binding regions at Day4. See also Figure S6.

References

    1. Emmett MJ, and Lazar MA (2019). Integrative regulation of physiology by histone deacetylase 3. Nat Rev Mol Cell Biol 20, 102–115. 10.1038/s41580-018-0076-0. - DOI - PMC - PubMed
    1. Wong MM, Guo C, and Zhang J (2014). Nuclear receptor corepressor complexes in cancer: mechanism, function and regulation. Am J Clin Exp Urol 2, 169–187. - PMC - PubMed
    1. Perissi V, Jepsen K, Glass CK, and Rosenfeld MG (2010). Deconstructing repression: evolving models of co-repressor action. Nat Rev Genet 11, 109–123. 10.1038/nrg2736. - DOI - PubMed
    1. Guenther MG, Barak O, and Lazar MA (2001). The SMRT and N-CoR corepressors are activating cofactors for histone deacetylase 3. Mol Cell Biol 21, 6091–6101. 10.1128/mcb.21.18.6091-6101.2001. - DOI - PMC - PubMed
    1. Ferrante F, Giaimo BD, Bartkuhn M, Zimmermann T, Close V, Mertens D, Nist A, Stiewe T, Meier-Soelch J, Kracht M, et al. (2020). HDAC3 functions as a positive regulator in Notch signal transduction. Nucleic Acids Res 48, 3496–3512. 10.1093/nar/gkaa088. - DOI - PMC - PubMed

Publication types