. 2023 Oct;33(10):1848-1864.
doi: 10.1101/gr.277947.123. Epub 2023 Sep 26.

An organism-wide ATAC-seq peak catalog for the bovine and its use to identify regulatory variants

Collaborators, Affiliations

An organism-wide ATAC-seq peak catalog for the bovine and its use to identify regulatory variants

Can Yuan et al. Genome Res. 2023 Oct.

Abstract

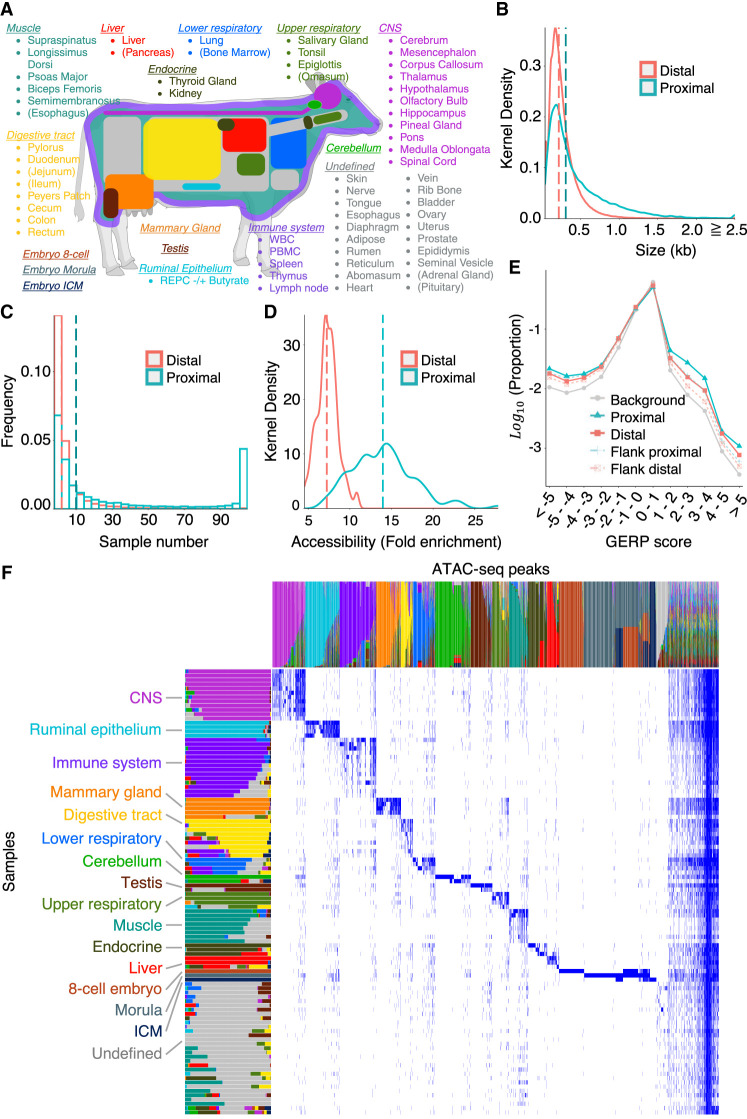
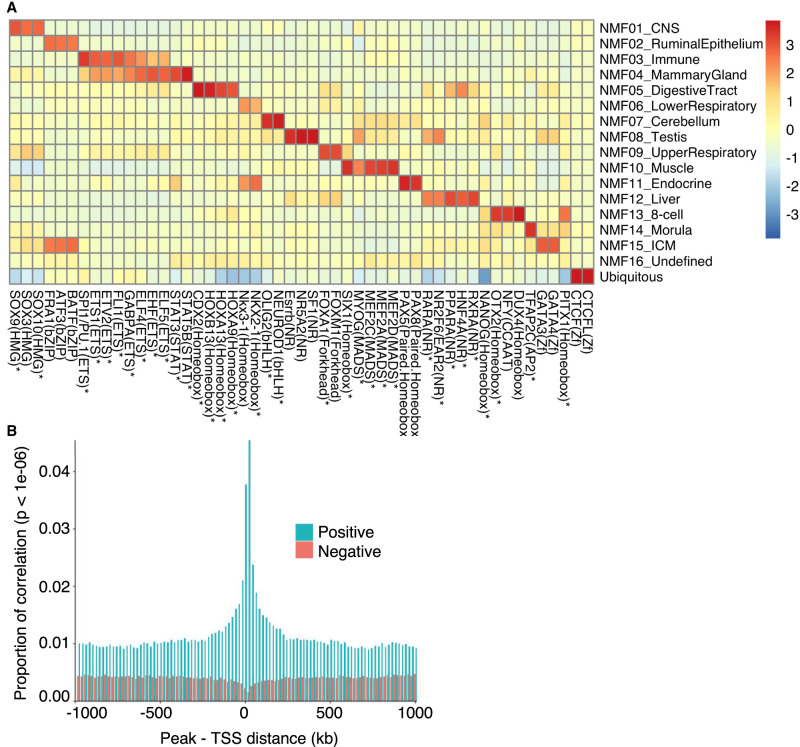
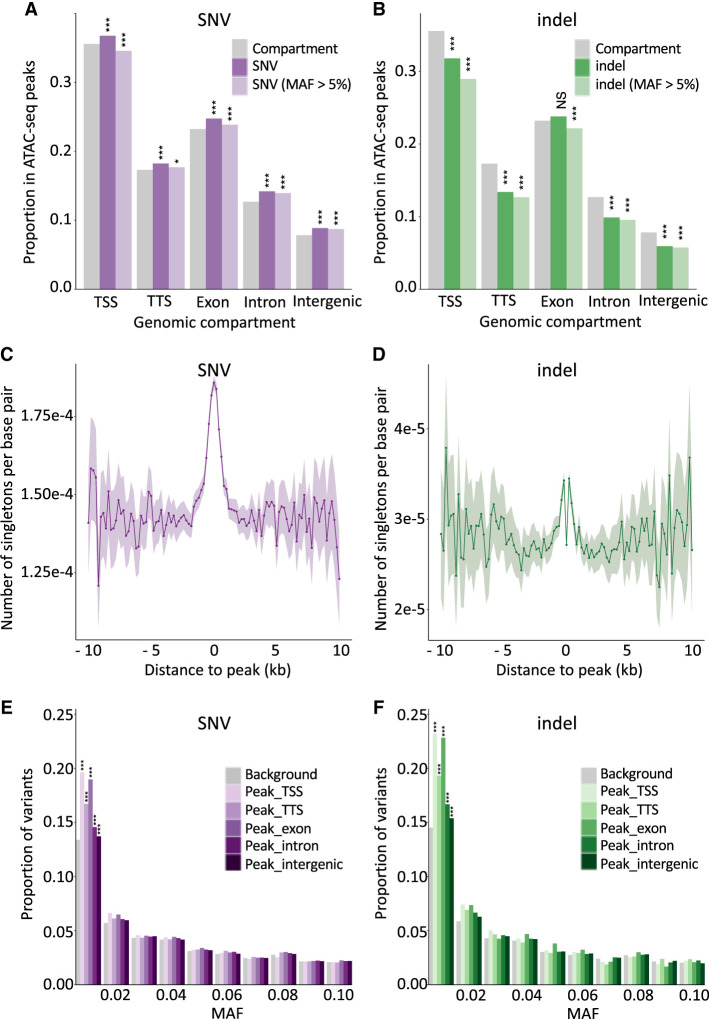
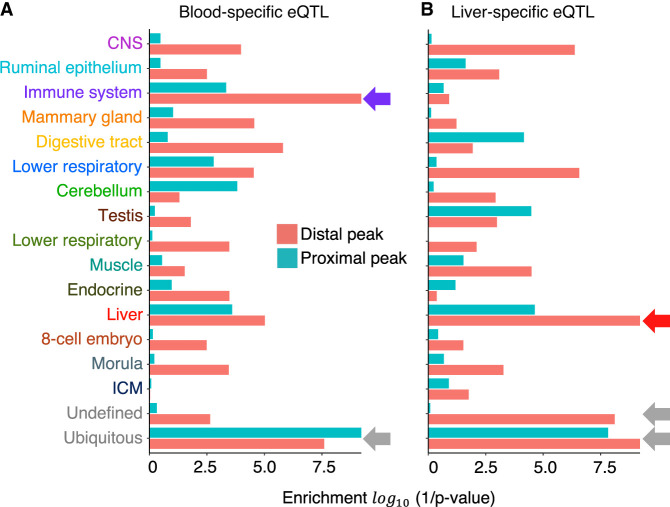
We report the generation of an organism-wide catalog of 976,813 cis-acting regulatory elements for the bovine detected by the assay for transposase accessible chromatin using sequencing (ATAC-seq). We regroup these regulatory elements in 16 components by nonnegative matrix factorization. Correlation between the genome-wide density of peaks and transcription start sites, correlation between peak accessibility and expression of neighboring genes, and enrichment in transcription factor binding motifs support their regulatory potential. Using a previously established catalog of 12,736,643 variants, we show that the proportion of single-nucleotide polymorphisms mapping to ATAC-seq peaks is higher than expected and that this is owing to an approximately 1.3-fold higher mutation rate within peaks. Their site frequency spectrum indicates that variants in ATAC-seq peaks are subject to purifying selection. We generate eQTL data sets for liver and blood and show that variants that drive eQTL fall into liver- and blood-specific ATAC-seq peaks more often than expected by chance. We combine ATAC-seq and eQTL data to estimate that the proportion of regulatory variants mapping to ATAC-seq peaks is approximately one in three and that the proportion of variants mapping to ATAC-seq peaks that are regulatory is approximately one in 25. We discuss the implication of these findings on the utility of ATAC-seq information to improve the accuracy of genomic selection.


Figures

Figure 1.
Figure 1.
Generation of an organism-wide catalog of cis-acting regulatory elements for the bovine. (A) Sixty-three tissue types with ATAC-seq data analyzed in this work. Novel ATAC-seq data were generated for 58 tissue types (89 samples), and public ATAC-seq data were downloaded for five (15 samples). Tissue types are grouped and colored based on the nonnegative matrix factorization (NMF) analysis described in D. Tissues are parenthesized when the largest NMF component in the tissue explains <50% of the total weight. This figure was created with BioRender (https://www.biorender.com). (B) Size distribution of proximal (green) and distal (red) ATAC-seq peaks (consensus peaks). (C) Distribution of the number of samples in which proximal (green) and distal (red) ATAC-seq peaks are open. (D) Distribution of the accessibility (fold-increase in coverage over background) of proximal (green) and distal (red) ATAC-seq peaks. The vertical dotted lines in B, C, and D correspond to the medians. (E) Distribution of GERP scores for nucleotide positions within proximal (solid green) and distal (solid red) ATAC-seq peaks, within sequence segments of same size immediately flanking proximal (dotted green) and distal (dotted red) ATAC-seq peaks, and across the entire genome (gray). The proportion of nucleotide positions without GERP score is not shown. (F) Decomposition of the 976,813-peak × 104-sample matrix in 16 components by nonnegative matrix factorization (NMF) following the method of Meuleman et al. (2020). As a result, each peak and each tissue sample are represented as a linear combination of the 16 components, which are color-coded in the graph. The lengths/heights of the bars measure the loading factor of the corresponding component for each of the tissue samples/peaks. Anatomically related samples typically have the same dominant component and have been ordered accordingly (Supplemental Table S5). The peaks that are predominantly active in the cognate tissue samples are dominated by the same component and are ordered accordingly. Thirty-one samples did not show clear tissue-specific peaks; their ATAC-seq profiles were dominated by the “ubiquitous” peaks shared by nearly all samples and, to a lesser extent, by a group of peaks assigned to the 16th “undefined” NMF component (shown in gray).
Figure 2.
Figure 2.
Open chromatin regions are enriched in cis regulatory elements. (A) TFs (x-axis) whose binding motifs are enriched in tissue type–specific ATAC-seq peaks assigned to the corresponding NMF components (y-axis). The color code measures the excess in the percentage of peaks encompassing the corresponding motif over background, scaled (Z-score) across NMF components. TFs that are also more strongly expressed in tissues corresponding to that component compared with other tissues (Supplemental Table S7) are marked by asterisks. (B) Proportion of significant, across tissue type, correlations (P < 10–6) between ATAC-seq peak accessibility and gene expression as a function of the distance between the TSS and the peak. Green indicates positive correlations; red, negative correlations.
Figure 3.
Figure 3.
Open chromatin regions are mutational hotspots yet are subject to purifying selection. (A) Proportion of SNVs that map in ATAC-seq peaks for different genome compartments (x-axis: TSS, TTS, exon, intron, intergenic). Gray indicates the proportion of a corresponding genome compartment that is occupied by ATAC-seq peaks; dark purple, all SNVs; and light purple, common SNVs (MAF > 0.05). (***) P ≤ 0.001, (*) P ≤ 0.05. (B) As in A for indels. Gray indicates the proportion of a corresponding genome compartment that is occupied by ATAC-seq peaks; dark green, all indels; and light green, common indels (MAF > 0.05). (***) P ≤ 0.001, (NS) nonsignificant. (C) Number of singleton SNVs (per interrogated base pair) in 264 whole-genome-sequenced Holstein-Friesian (HF) animals in nonoverlapping 200-bp windows at increasing distances from the center of ATAC-seq peaks. The shaded area corresponds to 2 × SD for the corresponding window. Fluctuation increases with distance as the number of windows decreases. (D) As in C for singleton indels. The excess near the ATAC-seq peak centers is clearly visible despite the drop at their very center (assumed to reflect purifying selection). (E) Folded SFS (0.0 < MAF ≤ 0.1) for SNVs mapping within ATAC-seq peaks assigned to different genome compartments (purple range indicates TSS, TTS, exon, intron, intergenic) compared with SNVs outside peaks. (***) P ≤ 0.001. (F) Folded SFS (0.0 < MAF ≤ 0.1) for indels mapping within ATAC-seq peaks assigned to different genome compartments (green range indicates TSS, TTS, exon, intron, intergenic) compared with indels outside peaks. (***) P ≤ 0.001.
Figure 4.
Figure 4.
Open chromatin regions are enriched in cis-regulatory variants. Enrichment of variants mapping to NMF component-specific ATAC-seq peaks in credible sets (r2 ≥ 0.9 with the lead variant) of 3857 blood-specific and 2212 liver-specific cis eQTL, evaluated by following the method of Trynka et al. (2015). The x-axis shows statistical significance (log(1/p)) of the enrichment; y-axis, NMF component. Green indicates proximal peaks; red, distal peaks. (A) Blood-specific eQTLs. (B) Liver-specific eQTLs.
Figure 5.
Figure 5.
A retrospective evaluation of the utility of the ATAC-seq catalog for identifying regulatory variants. ATAC-seq peaks at three genomic loci encompassing regulatory QTNs previously identified in domestic animals. Chromosome coordinates, gene annotations, QTN positions, core and consensus reference peak regions (thick bars and horizontal lines, respectively; color-coded based on their highest NFM component), and peaks (ChIP-seq mode tag coverage unless otherwise mentioned) from at least one tissue sample representing each NMF component group with corresponding color code. Positions of the QTNs are highlighted as vertical gray bands. Track height measures the normalized tag coverage (1,000,000/[total tag count]). (A) The bovine orthologous region encompassing the IGF2-intron3-3072 QTN identified in pigs (A/G at susScr11: Chr 2: 1,483,817; bosTau9: Chr 29: 49,408,408) (Van Laere et al. 2003; Markljung et al. 2009) that maps to a 16-bp motif highly conserved among placental mammals disrupts interaction of the ZBED6 repressor, resulting in an approximately threefold up-regulation of IGF2 in postnatal skeletal muscle affecting muscle growth, heart size, and fat deposition. None of ATAC-seq peaks overlapping the 16-bp motif were called across the 104 ATAC-seq data analyzed in this study. (B) The bovine orthologous region encompassing the callipyge (CLPG) muscular hypertrophy mutation identified in sheep (A/G at oviAri4: Chr 18: 64,294,536; bosTau9: Chr 21: 65,691,397) (Freking et al. 2002; Smit et al. 2003). The mutation is located in a 12-bp highly conserved motif among placental mammals and is considered to disrupt a muscle-specific long-range control element (a silencer) that causes ectopic expression of a 327-kb cluster of imprinted genes in postnatal skeletal muscle. ATAC-seq peaks overlapping the mutation site were called only in testis and tongue samples but not in skeletal muscle. (C) Bovine PLAG1 promoter region encompassing two out of eight candidate QTNs influencing bovine stature identified by Karim et al. (2011) (rs209821678 [alternatively ss319607405]: (CCG)11/(CCG)9 at bosTau9: Chr 14: 23375648–23375650; rs210030313 [ss319607406]: G/A at bosTau9: Chr 14: 23375692). The two QTNs reside in a strong 1044-bp-long ubiquitous peak between the PLAG1 and CHCHD7 TSSs. Regions encompassing the other six credible variants do not map to any called peak in our ATAC-seq data and, hence, are not shown. (D) Enlargement of the two QTN loci for three animals that are Qq heterozygous at rs210030313. Peaks called with ATAC-seq and ChIP-seq modes, as well as allelic imbalance in mapped reads, are shown. The two QTNs reside in a footprint of the ATAC-seq mode peak, which is recovered by a ChIP-seq mode peak, indicating the presence of trans-acting factor(s) in the region hindering cleavage events by transposases. Allelic imbalance at rs210030313 (Q = G; q = A) indicates that the Q allele is more accessible compared with the q allele. Previous work showed that the two regulatory variants affect bidirectional promoter strength and that the Q allele, associated with bigger stature, showed approximately 1.5-fold higher promoter activity compared with the q allele in a luciferase assay. Figures were created using the Integrative Genomics Viewer (Robinson et al. 2011).

References

    1. Adey A, Morrison HG, Asan, Xun X, Kitzman JO, Turner EH, Stackhouse B, MacKenzie AP, Caruccio NC, Zhang X, et al. 2010. Rapid, low-input, low-bias construction of shotgun fragment libraries by high-density in vitro transposition. Genome Biol 11: R119. 10.1186/gb-2010-11-12-r119 - DOI - PMC - PubMed
    1. Anders S, Huber W. 2010. Differential expression analysis for sequence count data. Genome Biol 11: R106. 10.1186/gb-2010-11-10-r106 - DOI - PMC - PubMed
    1. Aulchenko YS, Ripke S, Isaacs A, van Duijn CM. 2007. GenABEL: an R library for genome-wide association analysis. Bioinformatics 23: 1294–1296. 10.1093/bioinformatics/btm108 - DOI - PubMed
    1. Barnett DW, Garrison EK, Quinlan AR, Strömberg MP, Marth GT. 2011. BamTools: a C++ API and toolkit for analyzing and managing BAM files. Bioinformatics 27: 1691–1692. 10.1093/bioinformatics/btr174 - DOI - PMC - PubMed
    1. Benjamini Y, Hochberg Y. 1995. Controlling the false discovery rate: a practical and powerful approach to multiple testing. J R Statist Soc 57: 289–300. 10.1111/j.2517-6161.1995.tb02031.x - DOI

Publication types

MeSH terms