. 2023 Sep 26;14(1):5995.
doi: 10.1038/s41467-023-41608-9.

Tracing immune cells around biomaterials with spatial anchors during large-scale wound regeneration

Affiliations

Tracing immune cells around biomaterials with spatial anchors during large-scale wound regeneration

Yang Yang et al. Nat Commun. .

Erratum in

Abstract

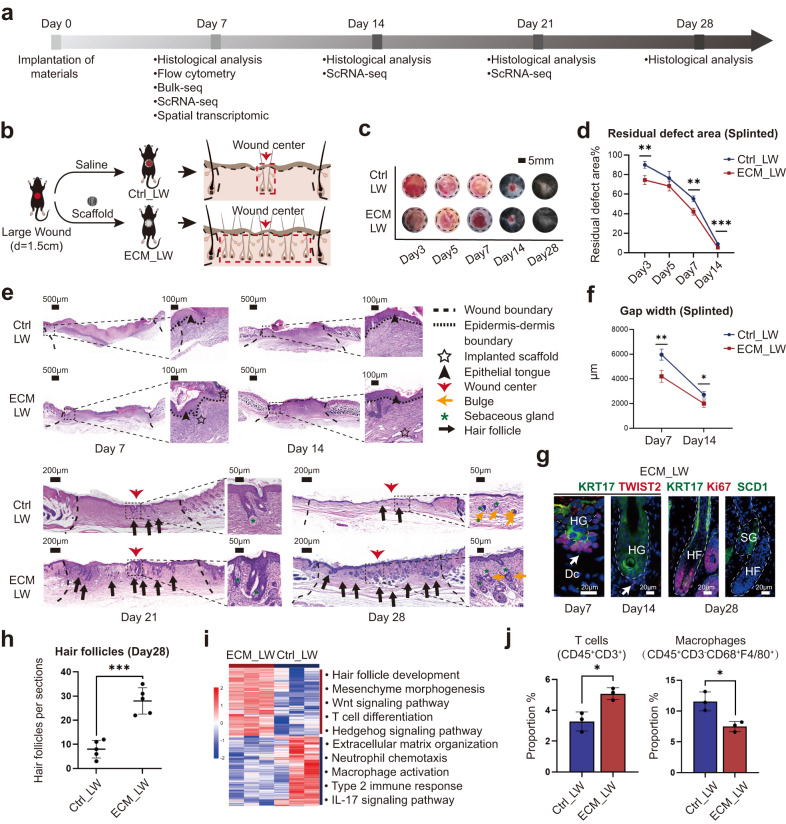
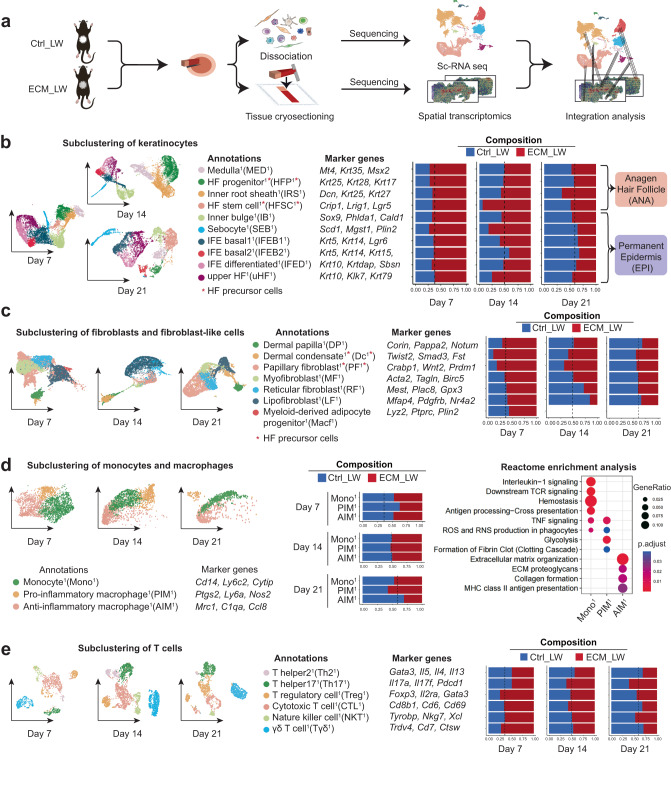
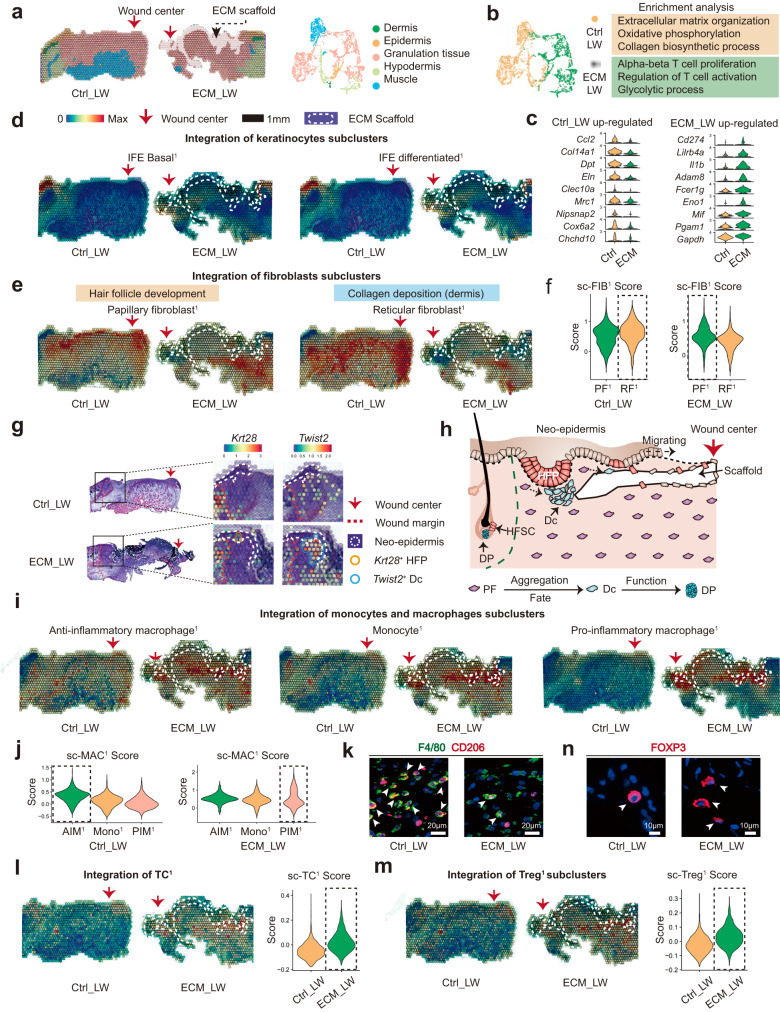
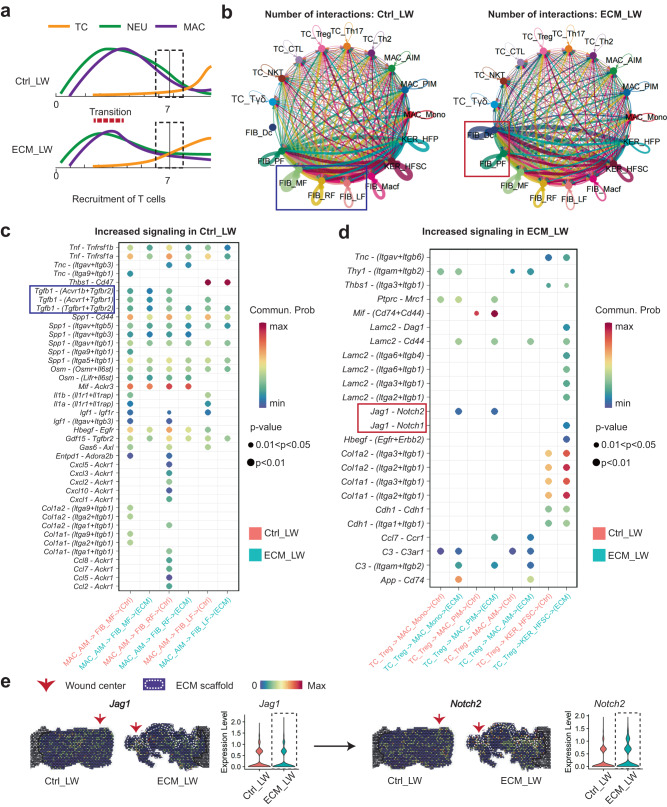
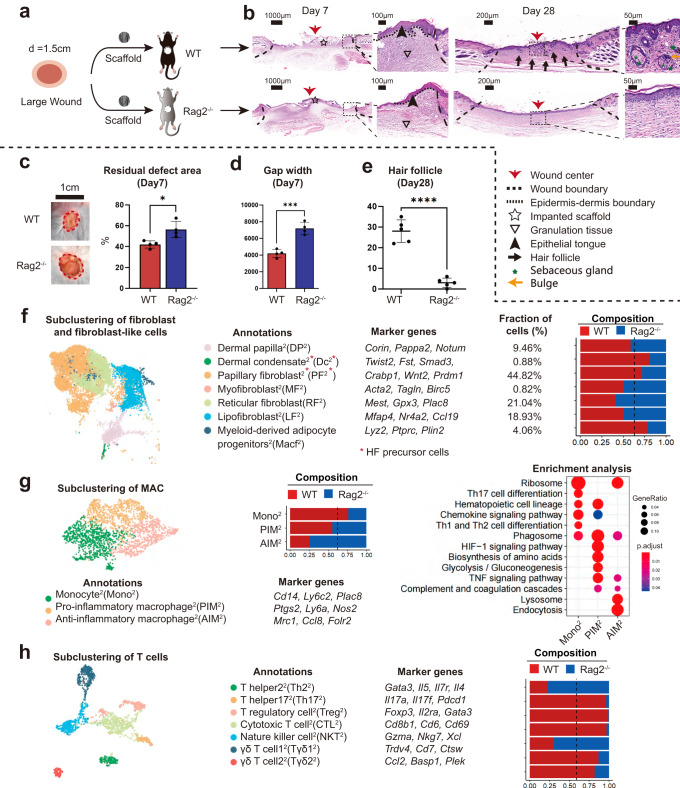
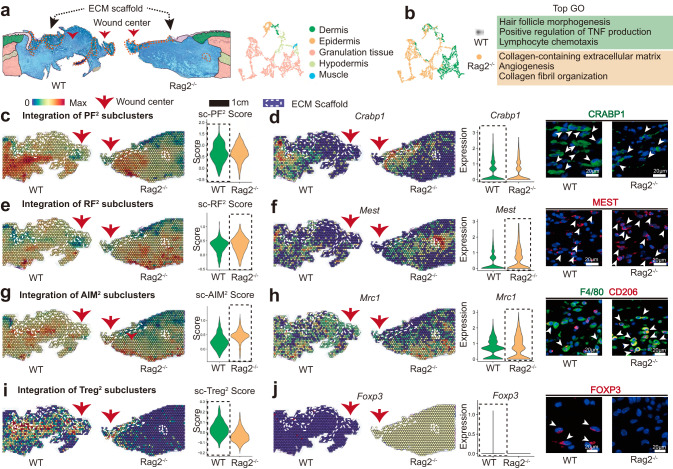
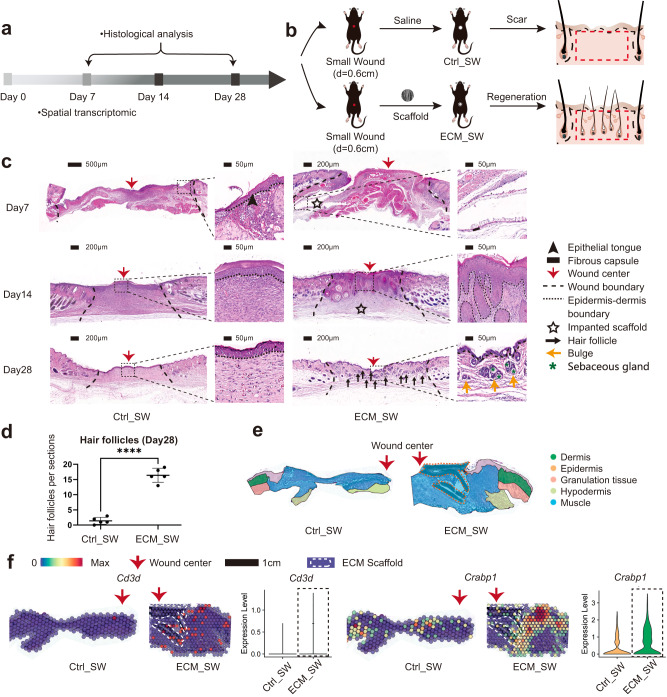
Skin scarring devoid of dermal appendages after severe trauma has unfavorable effects on aesthetic and physiological functions. Here we present a method for large-area wound regeneration using biodegradable aligned extracellular matrix scaffolds. We show that the implantation of these scaffolds accelerates wound coverage and enhances hair follicle neogenesis. We perform multimodal analysis, in combination with single-cell RNA sequencing and spatial transcriptomics, to explore the immune responses around biomaterials, highlighting the potential role of regulatory T cells in mitigating tissue fibrous by suppressing excessive type 2 inflammation. We find that immunodeficient mice lacking mature T lymphocytes show the typical characteristic of tissue fibrous driven by type 2 macrophage inflammation, validating the potential therapeutic effect of the adaptive immune system activated by biomaterials. These findings contribute to our understanding of the coordination of immune systems in wound regeneration and facilitate the design of immunoregulatory biomaterials in the future.


Conflict of interest statement

The authors declare no competing interests.

Figures

Fig. 1
Fig. 1. Evaluation of the wound healing process treated with ECM scaffolds.
a Workflow for evaluating large-scale wound healing. b Surgical processes for skin splinted excisional wound model. c Residual wound area at 3, 5, 7, 14, and 28 days, black dashed circles denoting the original wound area. d corresponding analysis of residual wound (Data are presented as mean ± SD, n = 4 biologically independent samples, two-tailed t-test, Day3 **p = 0.002; Day5 p = 0.104; Day7 **p = 0.001; Day14 ***p = 0.000444). e Representative H&E images of two groups at 7, 14, 21, and 28 days. f Quantitative evaluation of the gap width of neo-epithelium (Data are presented as mean ± SD, n = 4 biologically independent samples, two-tailed t-test, Day7 **p = 0.002; Day14 *p = 0.011). g Representative IF images of nascent HFs within the ECM_LW group, stained for KRT17 (green) and TWIST2 (red), Ki67 (red), and SCD1 (green), respectively. Abbreviations: HF, hair follicle; HG, hair germ; Dc, dermal condensate; SG, sebaceous gland. h Histologic quantification of de novo HFs on POD28 (Data are presented as mean ± SD, n = 5 biologically independent samples, two-tailed t-test, ***p = 0.000141). i Bulk-RNA sequencing analysis of ECM_LW versus Ctrl_LW mice on POD7 (n = 3 for each group). Heatmap (left) showing hierarchical clustering of differentially expressed genes (p value < 0.05 & |log2FC | > 1) between two groups, and corresponding gene set enrichment analysis (right) showing the enriched terms in ECM_LW (top) versus Ctrl_LW (bottom) groups. j Proportions of T cells (CD45+CD3+) and macrophages (CD45+CD3-F4/80+CD68+) cell populations in the wound environment on POD7, determined by flow cytometry (% = the number of target cells / the number of all single live cells) (Data are presented as mean ± SD, n = 3 biologically independent samples, two-tailed t-test, T cells *p = 0.013; Macrophages *p = 0.016). p value: *p < 0.05, **p < 0.01, ***p < 0.001, and ****p < 0.0001.
Fig. 2
Fig. 2. The single-cell atlas of the biomaterials-mediated microenvironment.
a Schematic for generating scRNA-seq and spatial transcriptomics data from large area excisional wounds on POD 7, 14, and 21. b Subclustering of keratinocytes showing four subsets from the anagen hair follicle and six subsets from the permanent epidermis. The composition and marker genes for each subset are listed. c Subclustering of fibroblasts showing two fibroblast-like subsets and five fibroblast subsets. The marker genes and composition for each subset are listed. d Subclustering of monocyte/macrophage showing three subsets. The marker genes, composition, and enrichment analysis for each subset are listed. e Subclustering of T cells showing six subsets. The marker genes and composition for each subset are listed.
Fig. 3
Fig. 3. Spatial anchors tracing the cell distribution around the ECM scaffold.
a The unsupervised clustering indicated the anatomical structure of samples. b Gene enrichment analysis between ECM_LW and Ctrl_LW group. c Violin plot showing the up-regulated genes of Ctrl_LW and ECM_LW samples of ST profile. d Spatial feature plot showing the distribution of IFEB1 and IFED1 subclusters in tissue sections. e Spatial feature plot showing the distribution of PF1 and RF1 subclusters in tissue sections. f Violin plots of FIB scores of individual spots derived from scRNA-seq data (sc-FIB score) for each subcluster. Dotted boxes stressed clusters with the higher average sc-FIB scores. g The spatial feature plot highlighted the expression of Krt28+ hair follicle progenitor and Twist2+ dermal condensate in migrating neo-epidermis. h Illustration showing the epithelialization along with de novo HF formation in the biomaterials-mediated healing process. i Spatial feature plot showing the distribution of MAC subclusters in tissue sections. j Violin plots of MAC scores of individual spots derived from scRNA-seq data (sc-MAC score) for each subcluster. Dotted boxes stressed clusters with the highest average sc-MAC score. k Representative IF images of stained AIM1 (F4/80+CD206+), white arrowheads showing the F4/80+CD206+ cells.l Spatial feature plot and violin plot showing TC1 distribution and expression level in tissue sections. m Spatial feature plot and violin plot showing the distribution and expression level of Treg1 in tissue sections. n Representative IF images of stained Treg1 (FOXP3), white arrowheads showing the FOXP3+ cells.
Fig. 4
Fig. 4. Cellular communication landscape between immune cells and cutaneous cells.
a Schematic timeline highlighting the recruitment of immune cells from innate and adaptive immune systems in Ctrl_LW (top) and ECM_LW (bottom) groups. b Comparison of overall cell-cell interaction numbers of immune cells and cutaneous cells between Ctrl_LW and ECM_LW using CellChat. c The ligand–receptor pairs up-regulated in the Ctrl_LW group in specificity between AIM1 and fibroblasts (MF1, RF1, and LF1). d The ligand–receptor pairs up-regulated in the ECM_LW group in specificity between Treg1, MAC (Mono1, PIM1, AIM1), and HFSC1. e Spatial feature plots and corresponding violin plots showed the expression level of the ligand and cognate receptor in the Notch signaling pathway.
Fig. 5
Fig. 5. Evaluation of wound healing in immunodeficient mice lacking mature T cells.
a The surgical process for evaluating large area wound healing mediated by ECM scaffold in WT and Rag2−/− mice. b Representative histological images of wound healing in WT and Rag2−/− mice at 7 and 28 days. c Residual defect area on POD 7 (Data are presented as mean ± SD, n = 4 biologically independent samples, two-tailed t-test, *p = 0.014). d Semiquantitative evaluation of gap width (Data are presented as mean ± SD, n = 4 biologically independent samples, two-tailed t-test, ***p = 0.00046). e Histologic quantification of de novo HFs (Data are presented as mean ± SD, n = 5 biologically independent samples, two-tailed t-test, ****p = 0.000013). f Subclustering of fibroblasts and fibroblast-like cells showing two fibroblast-like subsets and five fibroblast subsets. Marker genes for fibroblast subsets are listed. g Subclustering of monocyte/macrophage showing three subsets. The marker genes, composition, and enrichment analysis for each subset are listed. h Subclustering of T cells showing seven subsets. The marker genes and composition for each subset are listed. p value: *p < 0.05, **p < 0.01, ***p < 0.001 and ****p < 0.0001.
Fig. 6
Fig. 6. Spatial atlas of cell microenvironment around biomaterials of immunodeficient mice.
a The anatomical structure of each sample. b Gene enrichment analysis between WT and Rag2-/- group. c Spatial feature plot and violin plot showing the distribution and expression level of integrated PF2 subcluster in tissue sections. d Spatial feature plot and violin plot showing the distribution and expression level of Crabp1 (marker gene of PF2) in tissue sections; Representative IF images of stained PF2 (CRABP1+), white arrowheads showing the CRABP1+ cells. e Spatial feature plot and violin plot showing the distribution and expression level of integrated RF2 subcluster in tissue sections. f Spatial feature plot and violin plot showing the distribution and expression level of Mest (marker gene of RF2) in tissue sections; Representative IF images of stained RF2 (MEST+), white arrowheads showing the MEST + cells. g Spatial feature plot and violin plot showing the distribution and expression level of integrated AIM2 subcluster in tissue sections. h Spatial feature plot and violin plot showing the distribution and expression level of Mrc1 (marker gene of AIM2) in tissue sections; Representative IF images of stained AIM2(F4/80 +CD206+), white arrowheads showing the F4/80 +CD206+ cells. i Spatial feature plot and violin plot showing the distribution and expression level of integrated Treg2 subcluster in tissue sections. j Spatial feature plot and violin plot showing the distribution and expression level of Foxp3 (marker gene of Treg2) in tissue sections; Representative IF images of stained Treg2 (FOXP3+), white arrowheads showing the FOXP3+ cells.
Fig. 7
Fig. 7. Evaluation of the healing of small full-thickness wounds treated with ECM scaffolds.
a Workflow for evaluating skin wound healing. b The surgical process for skin excisional wound model of Ctrl_SW and ECM_SW group. c Representative H&E images of Ctrl_SW and ECM_SW samples. d Histologic quantification of de novo HFs on POD28 (Data are presented as mean ± SD, n = 5 biologically independent samples, two-tailed t-test, ****p = 0.000001). e The anatomical structure of samples. f Spatial feature plot showing the expression of Cd3d (marker gene of T cells) and Crabp1 (marker gene of papillary fibroblasts) in ST profile and corresponding quantitative analysis. p value: *p < 0.05, **p < 0.01, ***p < 0.001, and ****p < 0.0001.

References

    1. Willyard C. Unlocking the secrets of scar-free skin healing. Nature. 2018;563:S86–s88. - PubMed
    1. Boothby IC, Cohen JN, Rosenblum MD. Regulatory T cells in skin injury: at the crossroads of tolerance and tissue repair. Sci. Immunol. 2020;5:eaaz9631. - PMC - PubMed
    1. Shook BA, et al. Myofibroblast proliferation and heterogeneity are supported by macrophages during skin repair. Sci. (N. Y., N. Y.) 2018;362:eaar2971. - PMC - PubMed
    1. Gay D, et al. Phagocytosis of Wnt inhibitor SFRP4 by late wound macrophages drives chronic Wnt activity for fibrotic skin healing. Sci. Adv. 2020;6:eaay3704. - PMC - PubMed
    1. Wang X, et al. Macrophages induce AKT/β-catenin-dependent Lgr5(+) stem cell activation and hair follicle regeneration through TNF. Nat. Commun. 2017;8:14091. - PMC - PubMed

Publication types

Substances