. 2023 Sep 27;11(1):50.
doi: 10.1038/s41413-023-00283-8.

Loss of Notch signaling in skeletal stem cells enhances bone formation with aging

Affiliations

Loss of Notch signaling in skeletal stem cells enhances bone formation with aging

Lindsey H Remark et al. Bone Res. .

Abstract

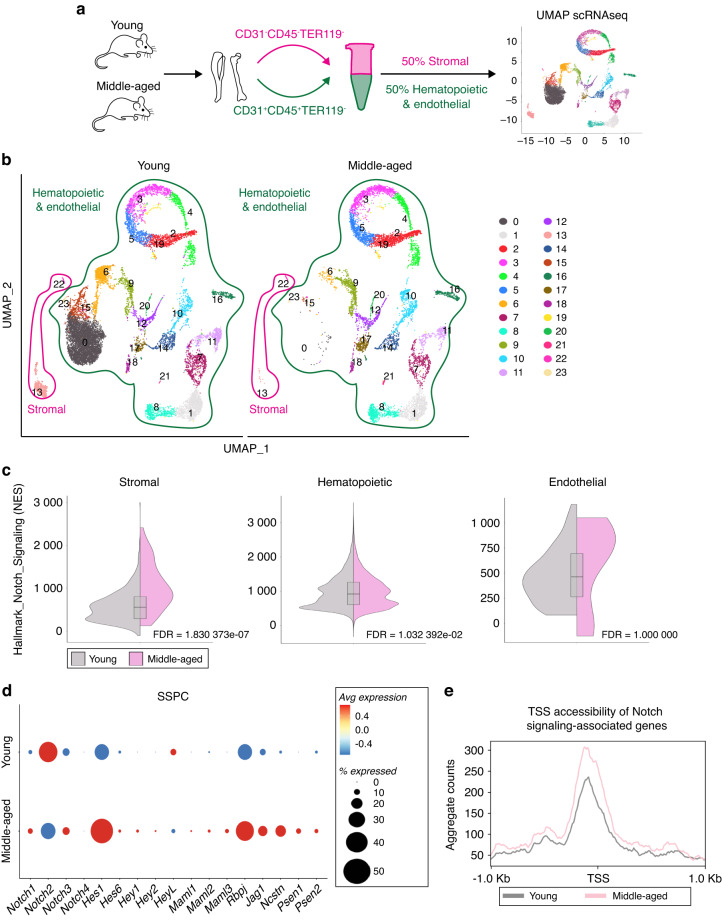
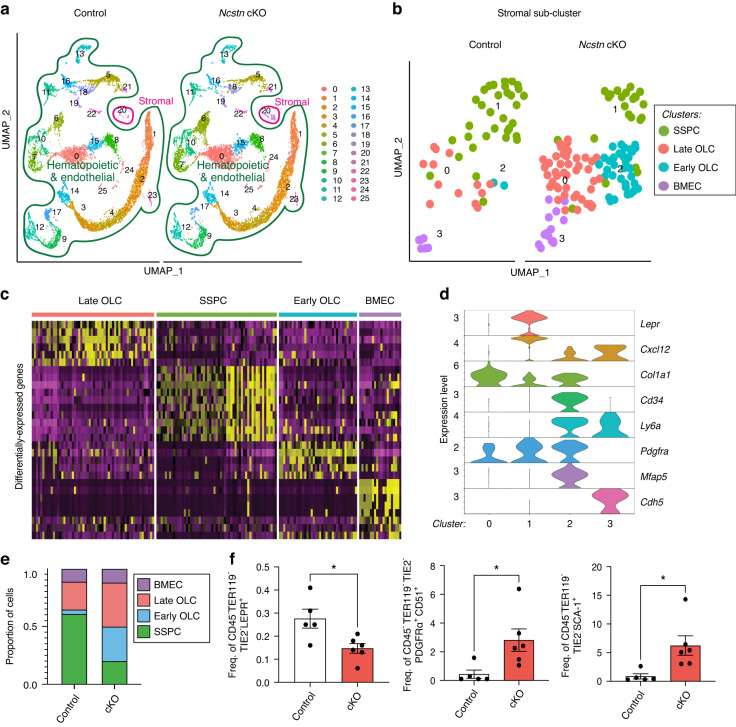
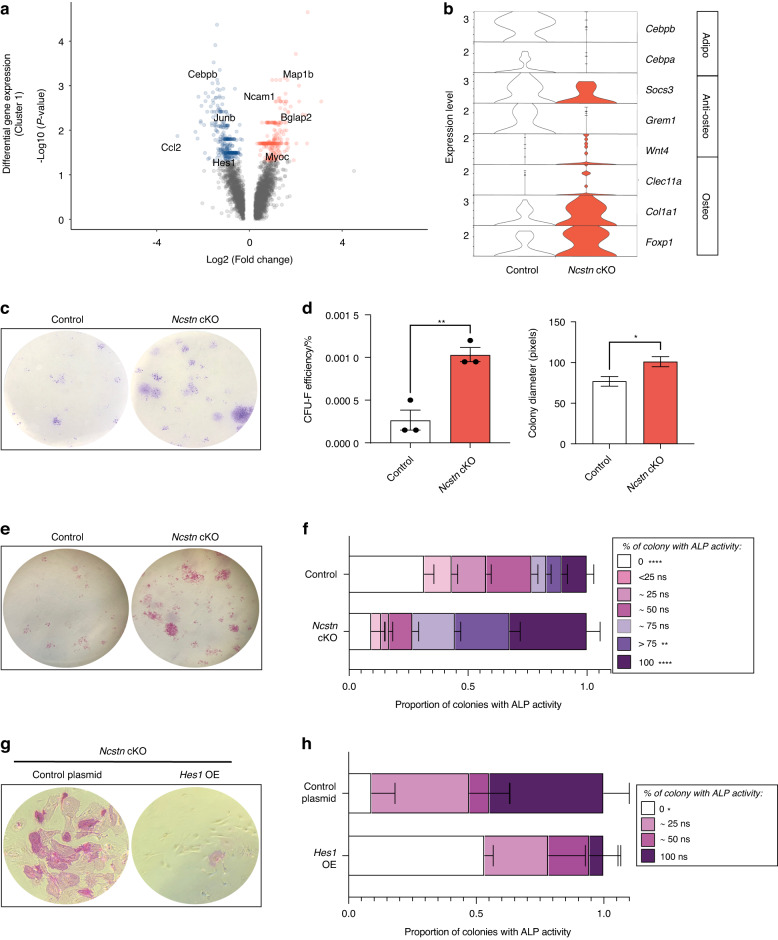
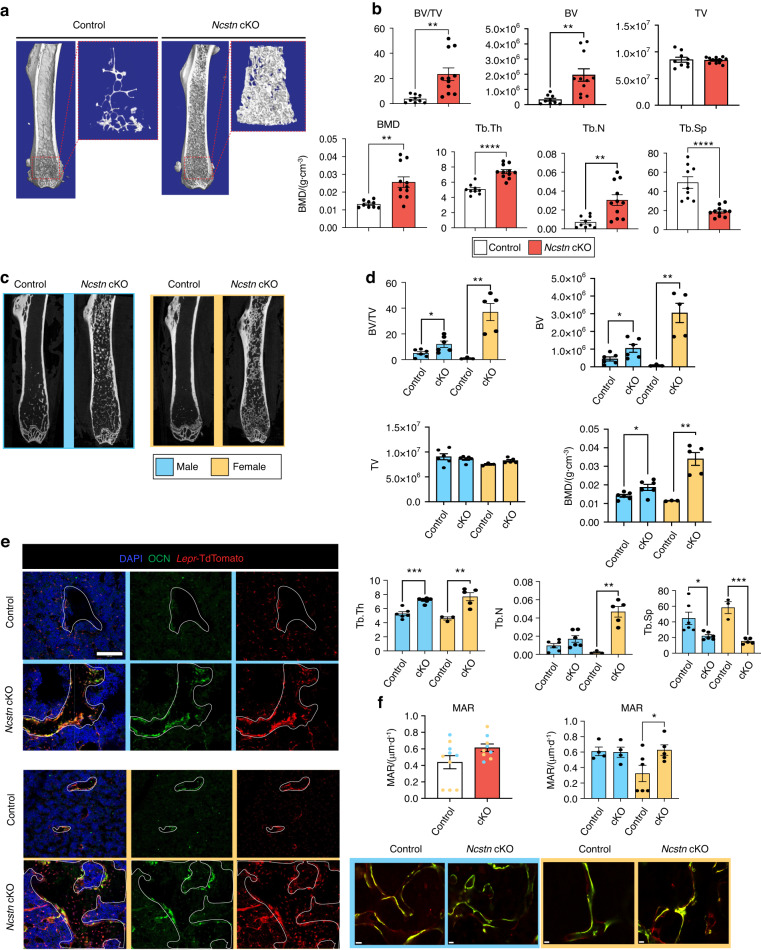
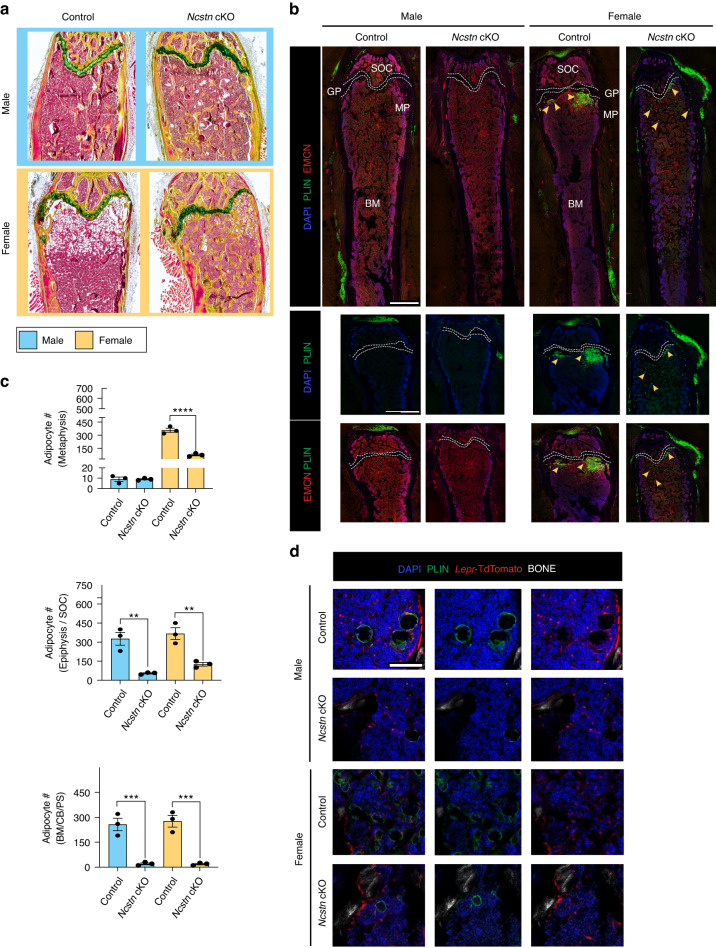
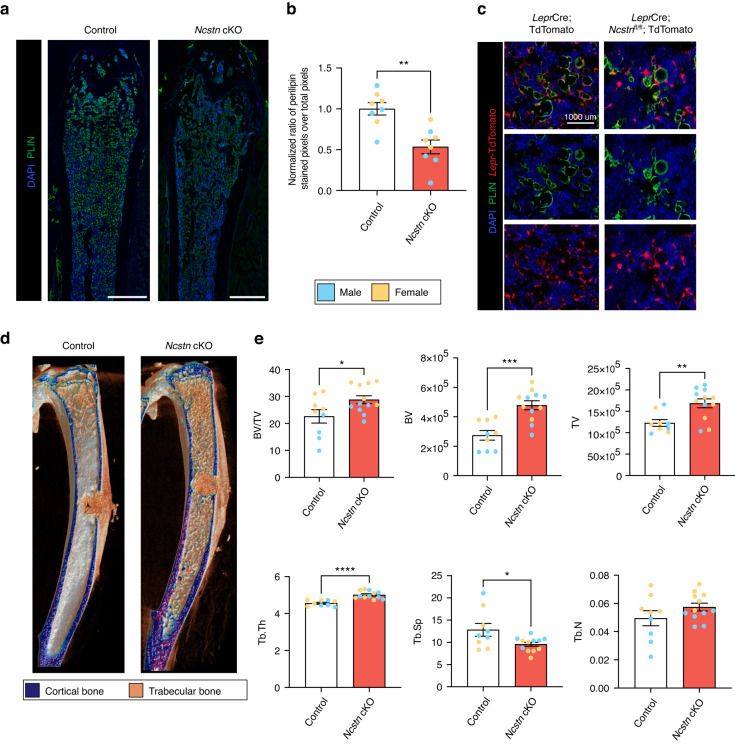
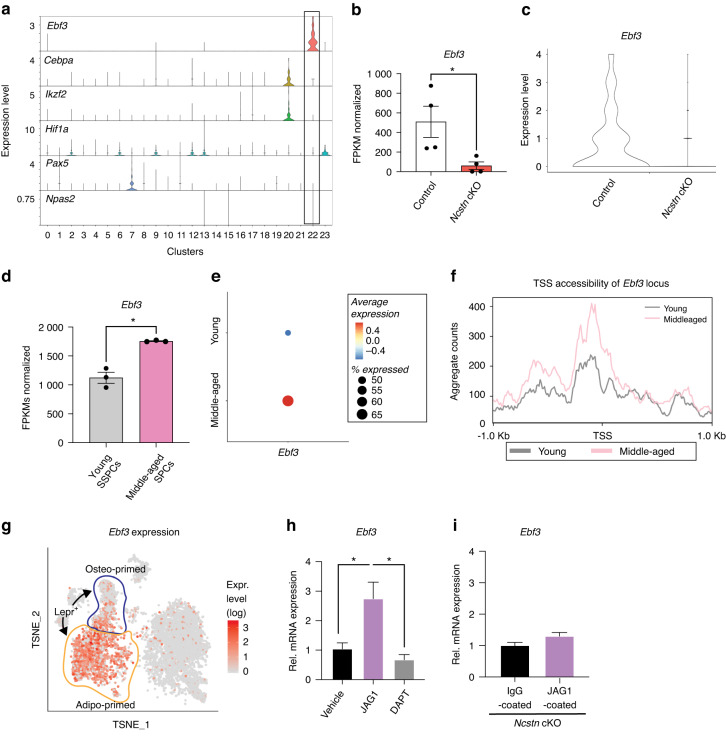
Skeletal stem and progenitor cells (SSPCs) perform bone maintenance and repair. With age, they produce fewer osteoblasts and more adipocytes leading to a loss of skeletal integrity. The molecular mechanisms that underlie this detrimental transformation are largely unknown. Single-cell RNA sequencing revealed that Notch signaling becomes elevated in SSPCs during aging. To examine the role of increased Notch activity, we deleted Nicastrin, an essential Notch pathway component, in SSPCs in vivo. Middle-aged conditional knockout mice displayed elevated SSPC osteo-lineage gene expression, increased trabecular bone mass, reduced bone marrow adiposity, and enhanced bone repair. Thus, Notch regulates SSPC cell fate decisions, and moderating Notch signaling ameliorates the skeletal aging phenotype, increasing bone mass even beyond that of young mice. Finally, we identified the transcription factor Ebf3 as a downstream mediator of Notch signaling in SSPCs that is dysregulated with aging, highlighting it as a promising therapeutic target to rejuvenate the aged skeleton.


Conflict of interest statement

The authors declare no competing interests.

Figures

Fig. 1
Fig. 1
Aging activates Notch signaling genes in skeletal stem cells. a Schematic of experimental workflow for scRNAseq of young adult (~3-month-old) and middle-aged (~12-month-old) bone stromal (CD31CD45TER119) and hematopoietic and endothelial compartments (CD31+CD45+TER119) from hindlimb bone tissue sorted and combined at a 1:1 ratio, then processed for scRNAseq. b scRNAseq UMAP-based visualization of stromal, hematopoietic, and endothelial bone and bone marrow populations with 24 clusters. Young n = 15 225 cells, Middle-aged n = 8 831 cells. The pink outline indicates the stromal compartment and the green outline indicates the hematopoietic and endothelial compartment. c Gene set enrichment analysis (GSEA) using the package escape 1.4.1. GSEA analysis was performed on the stromal hematopoietic, and endothelial compartments separately. Split Violin plot shows normalized enrichment score (NES) for hallmark_notch_signaling from the H:hallmark gene sets between young and middle-aged stromal (FDR = 1.830 372e−07, young median NES = 536.031, middle-aged median NES = 927.393), hematopoietic (FDR = 1.032 392e-02, young median NES = 939.566, middle-aged median NES = 899.742), and endothelial populations (FDR = 1.000 000, young median NES = 695.455, middle-aged median NES = 437.276) Wilcoxon test. d Dotplot showing expression of Notch signaling pathway genes in cluster 22, which is mainly comprised of Lepr+ expressing SSPCs between middle-aged and young mice. e SSPCs were subjected to ATAC sequencing. Compared to young SSPCs, chromatin in middle-aged SSPCs was more accessible around the transcriptional start site (TSS) in genes associated with Notch signaling
Fig. 2
Fig. 2
Decreased Notch signaling during aging increases osteogenic and decreases adipogenic gene signatures. a UMAP clusters from control Ncstnfl/fl (n = 8 831 cells) and LeprCre; Ncstnfl/fl cKO (n = 9 439 cells) middle-aged digested bone and bone marrow showing a stromal (outlined in pink) and hematopoietic/ endothelial compartment (outlined in green). b UMAP after sub-clustering of the stromal compartment of control and Ncstn cKO middle-aged mice. SSPC skeletal stem and progenitor cell, OLC osteo-lineage cell, BMEC Bone marrow endothelial cell. c Heatmap showing the separation of the 4 clusters. d Violin plot showing expression of marker genes for each cluster and of SSPC (Lepr, Cxcl12), osteolineage cells (Cd34, Ly6a, Pdgfra, Mfap5, Col1a1), and bone marrow endothelial cells (Cdh5). e Proportion of each cluster found in control and Ncstn cKO mice. f Flow cytometry analysis to confirm the proportional shift seen in scRNAseq of primitive Lepr+ SSPCs and more mature osteolineage populations PDGFRα+ and SCA-1+ cells between middle-aged control (n = 5) and Ncstn cKO (n = 6) mice. *P < 0.05, **P < 0.01, ***P < 0.001. Data were represented as mean ± s.e.m
Fig. 3
Fig. 3
Loss of Notch signaling during aging increases the number of osteoprogenitors. a Volcano plot showing differential gene expression between Ncstn cKO and control SSPC cluster. Red genes are upregulated in Ncstn cKO SSPCs and blue genes are downregulated in Ncstn cKO SSPCs compared to control (average log2FC > 0, P value < 0.05). b Violin plot showing expression of adipogenic, anti-osteogenic, and osteogenic genes between control and Ncstn cKO SSPCs. c Colony-forming unit fibroblast assay (CFU-F) of control and Ncstn cKO middle-aged bone marrow showing representative colony staining with crystal violet. d Quantification of CFU-F efficiency (number of cells plated/number of colonies formed) and colony diameter (in pixels)(n = 3). e Colony-forming unit fibroblast assay (CFU-F) of control and Ncstn cKO middle-aged bone marrow showing representative colony staining for alkaline phosphatase (ALP) enzymatic activity, an early osteogenic differentiation marker. f Quantification of CFU-Fs showing specified percentages of ALP+ cells per colonies (n = 3). g Colony-forming unit fibroblast assay (CFU-F) of Ncstn cKO middle-aged bone marrow showing representative colony staining with ALP with a control plasmid or Hes1 over-expression plasmid. High-magnification image of a representative colony. h Quantification of CFU-Fs showing specified percentages of ALP+ cells per colonies (n = 3). *P < 0.05, **P < 0.01, ****P < 0.000 1. Data were represented as mean ± s.e.m
Fig. 4
Fig. 4
Loss of Notch signaling causes an age and sex-dependent increase in osteogenesis. a 3D-rendered coronal microCT cross-section of Ncstnfl/fl (control) and LeprCre; Ncstnfl/fl (Ncstn cKO) middle-aged mouse femurs. Dotted red box shows isolated metaphyseal trabecular bone. b Quantification of trabecular bone parameters throughout the marrow cavity. BV/TV bone volume/tissue volume, BMD Bone Mineral Density, Tb.Th trabecular thickness, Tb.N trabecular number, Tb.Sp trabecular spacing. Control (n = 9), Ncstn cKO (n = 8). c Coronal microCT images of the femur separated by sex. Blue = male, yellow = female. d Quantification of trabecular bone parameters throughout the marrow cavity separated by sex. Control male (n = 6), control female (n = 3), Ncstn cKO male (n = 6), Ncstn cKO female (n = 5). e Representative immunofluorescent images from the femoral metaphysis of LeprCre; TdTomato and Ncstn cKO ; TdTomato male and female mice showing the contribution of the Lepr lineage to trabecular bone. Trabecular bone is outlined in white and TdTomato+ OCN+ osteoblast lining the bone and TdTomato+ osteocytes which have a spindle appearance within the trabecular bone. Scale bar = 100 um. f Mineral apposition rate (MAR) for control and cKO middle-aged mice with representative imaged, scale bar = 30 um. *P < 0.05, **P < 0.01, ***P < 0.001, ****P < 0.000 1. Data were represented as mean ± s.e.m
Fig. 5
Fig. 5
Loss of Notch signaling causes an age and sex-dependent decrease in adipogenesis. a Histological sections of control and Ncstn cKO middle-aged femurs stained with Movat’s Pentachrome (yellow, bone; red, marrow; blue/green, cartilage). Adipocytes can be seen in the metaphysis as white marrow “ghosts”. Males = blue, females = yellow. b Representative immunofluorescent sections of male and female control and Ncstn cKO middle-aged femurs stained for perilipin (PLIN)+ adipocytes and endomucin (EMNC)+ vasculature. Yellow arrowheads point to characteristic adipocyte accumulation in the metaphysis with aging. SOC secondary ossification center, BM bone marrow, MP metaphysis. Top row, scale bar = 1 000 um. Bottom 2 rows, scale bar = 500 um. c Quantification of PLIN+ adipocytes throughout different compartments of the bone marrow. BM bone marrow, CB cortical bone, PS periosteum. Control male (n = 3), control female (n = 3), Ncstn cKO male (n = 3), Ncstn cKO female (n = 3). d Representative immunofluorescent images from the metaphysis of LeprCre; TdTomato and Ncstn cKO; TdTomato mice. Lepr lineage cells in TdTomato can been seen to give rise to PLIN+ adipocytes by overlap of TdTomato and PLIN (green). Scale bar = 100 um. *P < 0.05, **P < 0.01, ***P < 0.001. Data were represented as mean ± s.e.m
Fig. 6
Fig. 6
During physical and chemical stress loss of Notch signaling causes decreased adipogenic and increased osteogenic responses. a Representative immunofluorescent images from control and Ncstn cKO mouse femurs 10 days after 5-FU chemical stress known to induce adipogenesis (PLIN+ adipocytes). Scale bar = 1 000 um. b Quantification of PLIN+ staining measured in pixels in the metaphyseal region over the total pixel volume between control (n = 8) and Ncstn cKO (n = 8) mice, (female, yellow; male, blue). c Representative immunofluorescent images from LeprCre; TdTomato and Ncstn cKO; TdTomato mouse femurs after 5-FU treatment showing Lepr lineage cells marked by TdTomato expression giving rise to PLIN+ adipocytes. Scale bar = 1 000 um. d Mono-cortical defect injury microCT 3D reconstruction for middle-aged control and Ncstn cKO mice, post-operative day (POD) 10. e Quantification of trabecular bone parameters for the new woven bone at the injury site formed at POD 10 between control (n = 9) and Ncstn cKO (n = 12) mice. (female, yellow; male, blue). BV/TV bone volume/tissue volume, Tb.Th trabecular thickness, Tb.N trabecular number, Tb.Sp trabecular spacing. *P < 0.05, **P < 0.01, ***P < 0.001. Data were represented as mean ± s.e.m
Fig. 7
Fig. 7
The transcription factor Ebf3 acts downstream of Notch signaling in SSPCs. a Violin plot of compiled scRNAseq data from wildtype young and middle-aged bone/bone marrow showing the expression level of transcription factors identified as differentially expressed in Ncstn cKO vs. control SSPC bulk RNAseq. Ebf3 is one of the few transcription factors that is specific for SSPC cluster 22. b Normalized FPKMs of Ebf3 from bulk RNAseq of control and Ncstn cKO middle-aged SSPCs. c Violin plot showing Ebf3 expression from scRNAseq of control and Ncstn cKO stromal cluster. d Bulk RNAseq of young and middle-aged SSPCs showing Normalized FPKMs of Ebf3. e Dotplot showing expression of Ebf3 in the SSPC cluster of young and middle-aged mice. f SSPCs were subjected to ATAC sequencing. Compared to young SSPCs, chromatin in middle-aged SSPCs was more accessible around the Ebf3 transcriptional start site (TSS). g Expression of Ebf3 in the Lepr lineage cluster from Tikhonova et al. (Nature 2019). Osteo-primed population outlined in blue and adipo-primed population outlined in orange (https://compbio.nyumc.org/niche/). h Ebf3 expression in wildtype SSPCs that were either grown on IgG or JAG1 -coated plates treated with DMSO (1 μL·mL−1) (control) or DAPT (10 μmol·L−1) (a γ-secretase inhibitor) to inhibit Notch signaling, showing an increase in Ebf3 with Notch stimulation and decrease in Ebf3 when Notch signaling is inhibited. i qRT-PCR for Ncstn cKO SSPCs on IgG or JAG1 -coated plates showing that Ncstn cKO SSPCs are not responsive to Notch induced increases in Ebf3 expression. *P < 0.05, **P < 0.01, ***P < 0.001. Data were represented as mean ± s.e.m

References

    1. Josephson AM, et al. Age-related inflammation triggers skeletal stem/ progenitor cell dysfunction. Proc. Natl. Acad. Sci. USA. 2019;116:6995–7004. - PMC - PubMed
    1. Nishida S, Endo N, Yamagiwa H, Tanizawa T, Takahashi HE. Number of osteoprogenitor cells in human bone marrow markedly decreases after skeletal maturation. J. Bone Miner. Metab. 1999;17:171–177. - PubMed
    1. Noel SE, Santos MP, Wright NC. Racial and ethnic disparities in bone health and outcomes in the United States. J. Bone Miner. Res. 2021;36:1881–1905. - PMC - PubMed
    1. Liang, B., Burley, G., Lin, S. & Shi, Y. C. Osteoporosis pathogenesis and treatment: existing and emerging avenues. Cell. Mol. Biol. Lett. 27, 72 (2022). - PMC - PubMed
    1. Zou W, et al. Ablation of fat cells in adult mice induces massive bone gain. Cell Metab. 2020;32:801–813.e6. - PMC - PubMed

Publication types

LinkOut - more resources