. 2023 Sep 26;14(1):5983.
doi: 10.1038/s41467-023-41737-1.

PARP14 inhibition restores PD-1 immune checkpoint inhibitor response following IFNγ-driven acquired resistance in preclinical cancer models

Affiliations

PARP14 inhibition restores PD-1 immune checkpoint inhibitor response following IFNγ-driven acquired resistance in preclinical cancer models

Chun Wai Wong et al. Nat Commun. .

Abstract

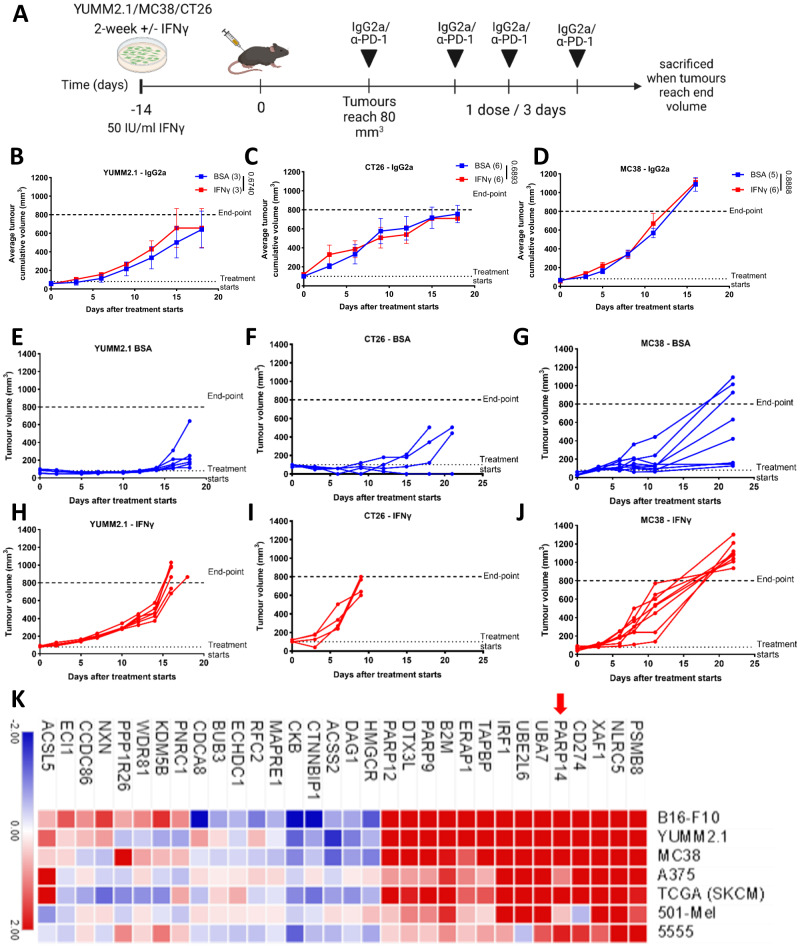
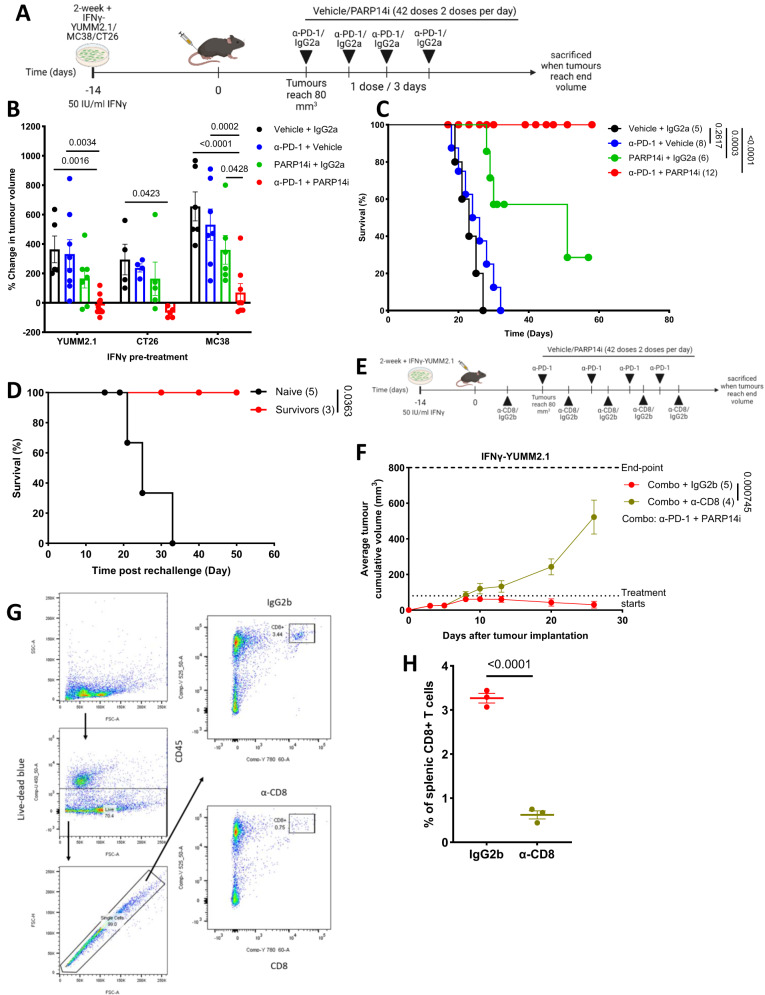
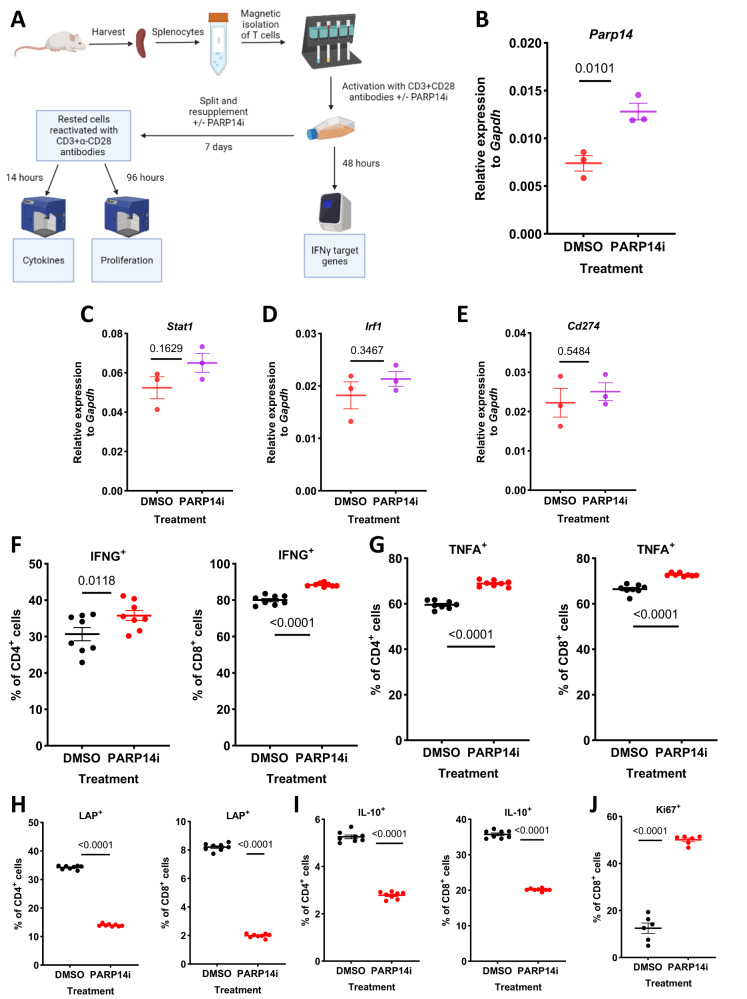
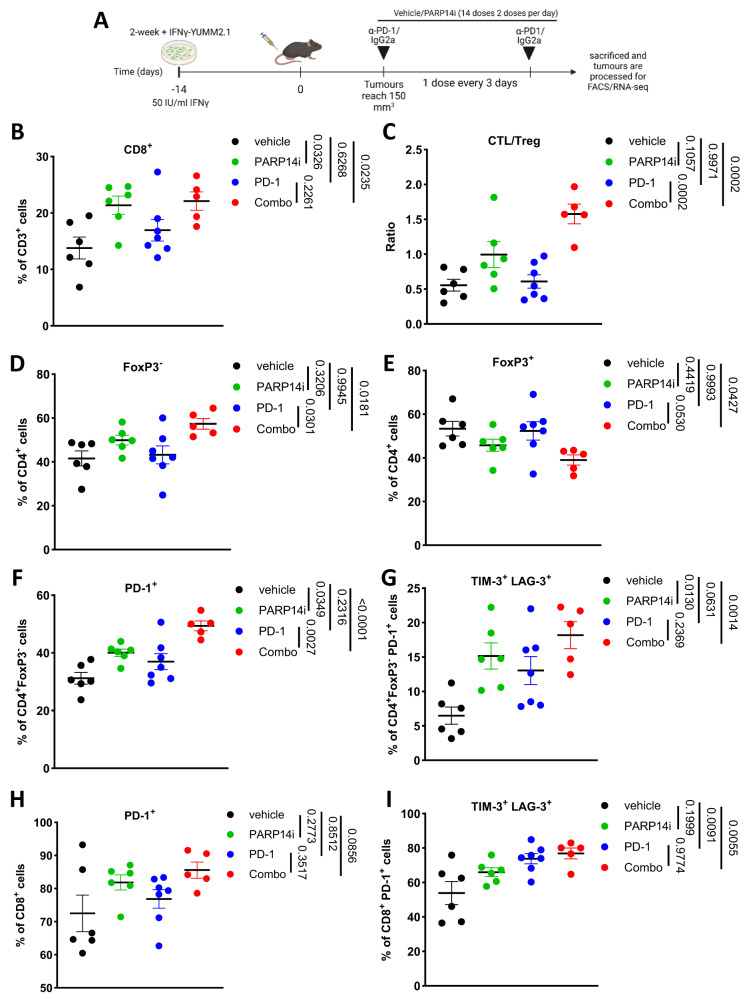
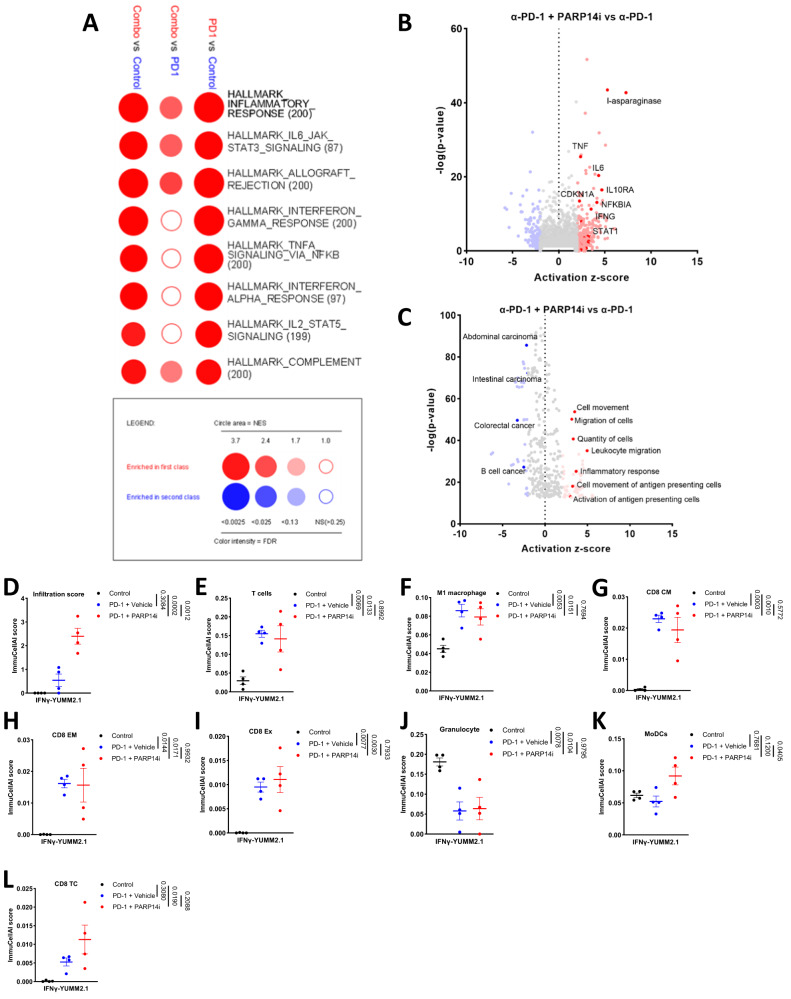
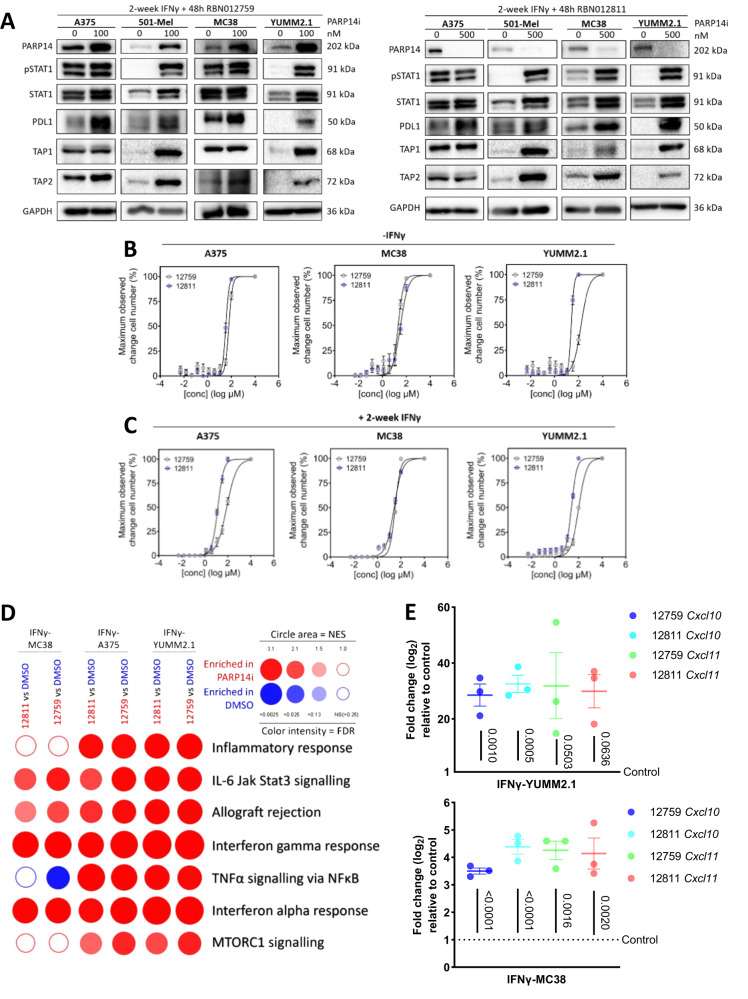
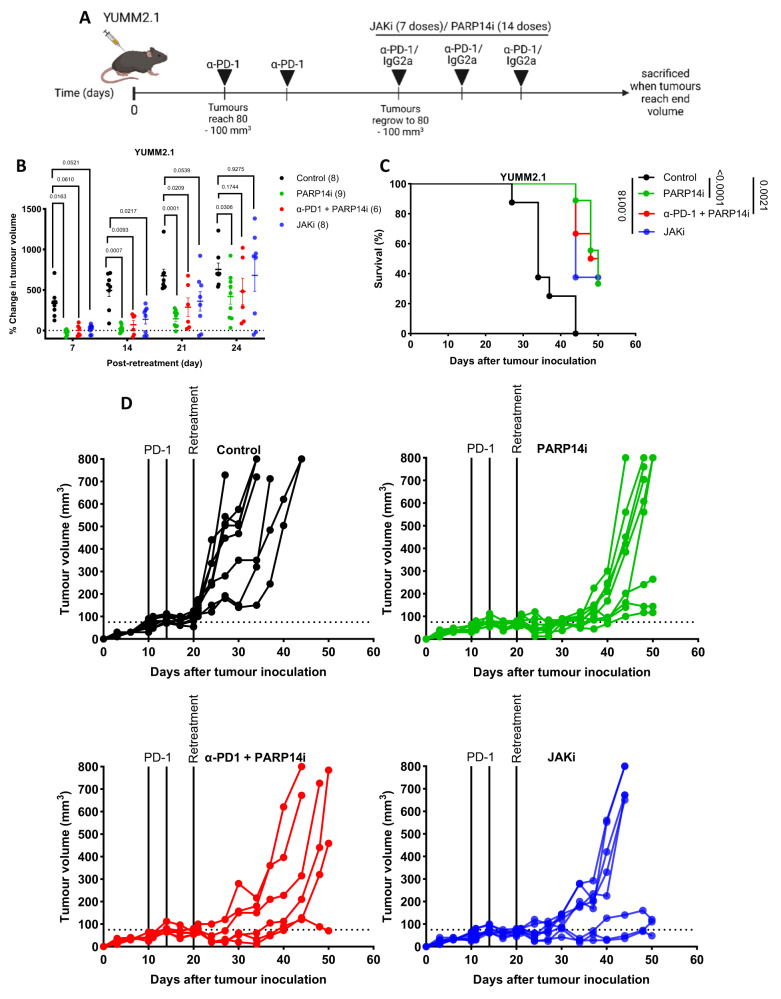
Resistance mechanisms to immune checkpoint blockade therapy (ICBT) limit its response duration and magnitude. Paradoxically, Interferon γ (IFNγ), a key cytokine for cellular immunity, can promote ICBT resistance. Using syngeneic mouse tumour models, we confirm that chronic IFNγ exposure confers resistance to immunotherapy targeting PD-1 (α-PD-1) in immunocompetent female mice. We observe upregulation of poly-ADP ribosyl polymerase 14 (PARP14) in chronic IFNγ-treated cancer cell models, in patient melanoma with elevated IFNG expression, and in melanoma cell cultures from ICBT-progressing lesions characterised by elevated IFNγ signalling. Effector T cell infiltration is enhanced in tumours derived from cells pre-treated with IFNγ in immunocompetent female mice when PARP14 is pharmacologically inhibited or knocked down, while the presence of regulatory T cells is decreased, leading to restoration of α-PD-1 sensitivity. Finally, we determine that tumours which spontaneously relapse in immunocompetent female mice following α-PD-1 therapy upregulate IFNγ signalling and can also be re-sensitised upon receiving PARP14 inhibitor treatment, establishing PARP14 as an actionable target to reverse IFNγ-driven ICBT resistance.


Conflict of interest statement

The authors declare the following competing interests: D.T.I., C.L., N.R.P. and M.N are all employees and shareholders of Ribon Therapeutics at the time of data collection. P.E.R. served as a consultant to Ribon Therapeutics. A.H. received research sponsorship from Ribon Therapeutics. All other authors declare no competing interests.

Figures

Fig. 1
Fig. 1. Chronic IFNγ exposure drives resistance to α-PD-1 therapy and upregulates PARP14.
A YUMM2.1, CT26, and MC38 cells were implanted into 8–12-week-old wild-type syngeneic female mice after two-weeks pre-treatment with IFNγ (50 IU/mL) or BSA. Treatment with the control IgG2a or α-PD-1 antibody was initiated once tumour volume reached 80–100 mm3, with dosing every three days for a total of four doses. B–D Average tumour growth curve for B YUMM2.1 (BSA: n = 3; IFNγ: n = 3), C CT26 (BSA: n = 6; IFNγ: n = 6), and D MC38 (BSA: n = 5; IFNγ: n = 6) cells after initiating treatment with the control IgG2a antibody. Number of mice treated indicated in parentheses. The p-value for tumour growth was assessed for the last day of IgG2a treatment and were determined by an unpaired two-sided t-test with Welch’s correction. The data were presented as the mean ± SEM. E–G The growth curve of each E YUMM2.1 (n = 6), F CT26 (n = 4), and G MC38 (n = 8) tumour pre-treated with BSA receiving α-PD-1 therapy. H–J The growth curve of each H YUMM2.1 (n = 6), I CT26 (n = 4), and J MC38 (n = 8) tumour pre-treated with IFNγ receiving α-PD-1 therapy. K Gene expression heatmap of differentially expressed genes (complete Euclidean HCL clustered; log2 fold change ≥ ±0.5; FDR ≤ 0.1) in mouse (B16-F10, YUMM2.1, MC38, 5555) or human (A375, 501-Mel,) tumour cell lines treated with chronic IFNγ (50 IU/mL for mouse and 20 IU/mL for human) compared to BSA treatment. Three independent cell line samples were sequenced for both conditions and the average for each cell line is shown. Heatmap also includes differential gene expression comparing melanoma patient samples with the 15% highest IFNG expression level with the 15% lowest (data retrieved from TCGA SKCM RNA sequencing data using Broad GDAC Firehose). Source data are provided as a Source Data file.
Fig. 2
Fig. 2. PARP14 expression reaches a plateau after 3-weeks IFNγ treatment and multiple inflammatory-related pathways are significantly upregulated after chronic IFNγ treatment.
A YUMM2.1 and B CT26 tumour cells were treated continuously with IFNγ for 3-weeks being periodically restimulated as indicated. PARP14, pSTAT1 and STAT1 protein expression were determined via western blot with GAPDH used as a loading reference. Samples from left to right: 0 w Ctrl (n = 3): 0-week no treatment; 0 w 2 h (n = 3): IFNγ treatment for 2 h (2 h) at 0-week; 0 w 24 h (n = 3): IFNγ treatment for 24 h (24 h) at 0-week; 1 w NR (n = 3): IFNγ treatment for 1-week with no restimulation (NR); 1 w 2 h (n = 3): IFNγ treatment for 1-week plus restimulation of IFNγ for 2 h; 1 w 24 h (n = 3): IFNγ treatment for 1-week plus restimulation of IFNγ for 24 h; 2 w NR (n = 3): IFNγ treatment for 2-week with NR; 2 w 2 h (n = 3): IFNγ treatment for 2-week plus restimulation of IFNγ for 2 h; 1 w 24 h (n = 3): IFNγ treatment for 2-week plus restimulation of IFNγ for 24 h; 3 w NR (n = 3): IFNγ treatment for 3-week with NR; 3 w 2 h (n = 3): IFNγ treatment for 3-week plus restimulation of IFNγ for 2 h; 3 w 24 h (n = 3): IFNγ treatment for 3-week plus restimulation of IFNγ for 24 h. The images were representatives of 1 of 3 independent experiments. GSEA of RNA-seq data from C YUMM2.1 and D CT26 cell lines treated in triplicate as in (A) and (B), highlighting different hallmark processes enriched at different time points. Source data are provided as a Source Data file.
Fig. 3
Fig. 3. PARP14 pharmacological antagonism reverses adaptive resistance to α-PD-1 therapy.
A Chronic IFNγ pre-treated YUMM2.1/MC38/CT26 cells were subcutaneously implanted into 8–12-week-old wild-type syngeneic female mice. Treatment with either α-PD-1 or IgG2a antibody was initiated once tumour volume reached 80–100 mm3, with antibodies administered every three days for a total of four doses. In parallel, the animals also received two daily doses of the PARP14 inhibitor (PARP14i) RBN012759 or vehicle for a total of three weeks. B The percentage change in tumour volume between the first dose of treatment and the administration of the final α- PD-1 dose of mice receiving implants of chronic IFNγ pre-treated YUMM2.1 (Vehicle + IgG2a: n = 5; α-PD-1 + Vehicle: n = 8; PARP14i + IgG2a: n = 6; α-PD-1 + PARP14i: n = 12), CT26 (Vehicle + IgG2a: n = 4; α-PD-1 + Vehicle: n = 4; PARP14i + IgG2a: n = 5; α-PD-1 + PARP14i: n = 5), and MC38 (Vehicle + IgG2a: n = 6; α-PD-1 + Vehicle: n = 7; PARP14i + IgG2a: n = 6; α-PD-1 + PARP14i: n = 8). The adjusted p-values were determined by two-way ANOVA Tukey’s test and the data were presented as the mean ± SEM. C Kaplan–Meier plots of IFNγ pre-treated YUMM2.1 (Vehicle + IgG2a: n = 5; α-PD-1 + Vehicle: n = 8; PARP14i + IgG2a: n = 6; α-PD-1 + PARP14i: n = 12) in different treatment groups with the number of mice in each arm indicated in parentheses and the p-values were determined by Log-rank (Mantel-Cox) test. D Survivors of α-PD-1 and PARP14i combinatorial therapy were maintained for 60 days and then re-implanted with IFNγ pre-treated YUMM2.1 cells (Naïve: n = 5; Survivors: n = 3). Age-matched naive mice act as a control group. Survival is shown for both groups. The p-value was assessed by Log-rank (Mantel-Cox) test. E Tumour-bearing mice received a total of four doses of α-PD-1 antibodies, 42 doses of PARP14i (twice daily for three weeks), and five doses of α-CD8 or IgG2b antibodies (a single dose every five days). F Average cumulative tumour volume over the course of treatment (Combo + IgG2b: n = 5; Combo + α-CD8: n = 4). The p-value was assessed at day 24 post-tumour implantation by two-sided unpaired t-test and the data were presented as the mean ± SEM. G Flow cytometry gating strategy for assessing the efficiency of splenic CD8 + T cell depletion by α-CD8. H Frequency of CD8+ cells among splenic T cells for animals receiving combination therapy with IgG2a (green: n = 3) or α-CD8 (red: n = 3). The p-value was assessed by two-sided unpaired t-test and the data were presented as the mean ± SEM. Source data are provided as a Source Data file.
Fig. 4
Fig. 4. PARP14 inhibition promotes pro-inflammatory CD4+ and CD8 + T cell phenotype.
A BALB/C mice were sacrificed and their spleens harvested. Isolated T cells were firstly stimulated with α-CD3 and α-CD28 antibodies, with 1 μM RBN012759 or DMSO. After 48 h, sample aliquots were processed for RT-qPCR analyses, while remaining cells were passaged refreshing the DMSO/ PARP14i for an additional 7 days. Subsequently, cells were re-activated with α-CD3 and α-CD28 antibodies and stained for cytokines after 14 h and for proliferation marker Ki-67 after 96 h. B–E, B Parp14, C Stat1, D Irf1, E Cd274 mRNA expression in cells treated with DMSO (n = 3) or PARP14i (n = 3) relative to the housekeeping gene Gapdh. The data were presented as mean ± S.E.M. and the p-values were determined by two-sided unpaired t-test. F–I Percentage of DMSO (n = 8) and PARP14i (n = 8) pre-treated cells that were F CD4 + IFNG+ (left) and CD8 + IFNG+ (right), G CD4 + TNFA+ (left) and CD8 + TNFA+ (right), H CD4 + LAP+ (left) and CD8 + LAP+ (right), I CD4 + IL-10+ (left) and CD8 + IL-10+ (right). The data were presented as mean ± S.E.M. and the p-values were assessed by two-sided unpaired t-test. J Percentage of DMSO (n = 6) and PARP14i (n = 6) pre-treated cells that were CD8+ Ki- 67+ cells. The data was presented as mean ± S.E.M. and the p-value was assessed by two-sided unpaired t-test. Source data are provided as a Source Data file.
Fig. 5
Fig. 5. PARP14 depletion in tumour cells reverses adaptive resistance to α-PD-1 therapy while reversing chronic IFNγ driven immune regulatory effects.
A Chronic IFNγ pre-treated YUMM2.1 cells expressing two independent PARP14-targeting shRNAs (shPARP14) (shPARP14.1: n = 6; shPARP14.2: n = 7) or a non-target control shRNA (shNTC) (shNTC: n = 6) were subcutaneously implanted into 8–12 weeks-old wild-type C57BL/6 female mice. Treatment of tumour-bearing mice was initiated once tumour volume reached ~80 mm3, with dosing every three days for a total of four doses. B The percentage tumour volume change between the first α-PD-1 treatment dose and the final dose (left) and Kaplan–Meier plots for these mice (right). The p-values were assessed by (left) the one-way ANOVA Dunnett’s test and (right) the Log-rank (Mantel- Cox) test. C–E Individual tumour growth rates for C shNTC, D shPARP14.1, and E shPARP14.2 expressing cells. F 8–12-week-old wild-type C57BL/6 mice were subcutaneously implanted with IFNγ-naïve YUMM2.1 cells expressing shNTC (n = 8) or chronic IFNγ pre-treated YUMM2.1 cells expressing shNTC (n = 8) or shPARP14 (n = 8). Tumours were allowed to grow to 300–400 mm3 and then dissected and disaggregated for analysis by flow cytometry. G–J Populations of G total immune cells (CD45+), H T cells (TCRαβ+), I CD4 effector T cells (CD4+ FoxP3-), and J regulatory T cells (Treg cells; CD25+FoxP3+) in the tumour infiltrate. The data were presented as mean ± S.E.M and the p-values were assessed by one-way ANOVA Dunnett’s test. Source data are provided as a Source Data file.
Fig. 6
Fig. 6. Combination treatment with α-PD-1 and PARP14 inhibition remodels the tumour immune microenvironment.
A 8–12-week-old wild-type C57BL/6 mice were subcutaneously implanted with chronic IFNγ pre-treated YUMM2.1 cells. Treatment with either α-PD-1 or IgG2a antibody was initiated once tumour volume reached 150 mm3 (two doses, three days apart) and PARP14i or vehicle (two doses daily for a week). At the end of the treatment period, tumours were dissected and disaggregated for analysis by flow cytometry and RNA-seq. B–I Populations of B CD8+ T cells, C the ratio of CD8+ GzmB+ cytotoxic lymphocytes (CTLs) to Treg cells, D CD4+ effector T cells (CD4+ FoxP3-), E Treg cells (CD4+ FoxP3+), PD-1+ of F CD4+ and H CD8+ T cells, and triple positive PD-1, TIM-3, LAG-3 of G CD4+ and I CD8+ T cells in the tumour infiltrate treated with different conditions (vehicle: n = 6; PARP14i: n = 6; α-PD-1: n = 7; Combo: n = 5). The data were presented as mean ± S.E.M. and the adjusted p-values were determined by one-way ANOVA Šídák’s test. Source data are provided as a Source Data file.
Fig. 7
Fig. 7. Combination treatment with α-PD-1 and PARP14 inhibition induces an inflammatory response.
A GSEA based on RNA-seq data depicting hallmark processes enriched in chronic IFNγ pre-treated tumours treated with α-PD-1 alone (n = 4) versus Control (n = 4); combined αPD-1 and PARP14 inhibition (Combo) (n = 4) versus α-PD-1 alone (n = 4); Combo (n = 4) versus Control (n = 4). Circle area depicts the NES, and colour intensity depicts the FDR, with ≤0.25 classed as significant. B–C Ingenuity Pathway Analysis (IPA) was performed to identify up- or down-regulation of B upstream regulators and C disease-related or functional pathways in tumours receiving α-PD-1/PARP14i combination treatment (n = 4) versus α-PD-1 alone treatment (n = 4). Results were displayed with their P-value (-log(P-value)) and activation z-score. The p-values were assessed by two-tailed unpaired t-test. D–L Bulk-tumour RNA-seq results treated with Control (n = 4); PD-1 + Vehicle (n = 4); or PD-1 + PARP14i (n = 4) analysed by cell-type enrichment analysis (ImmuCellAI), with scores shown for D infiltration, E T cell, F M1 macrophage, G CD8 central memory (CM) T cells, H CD8 effector memory (EM) T cells, I exhausted (Ex) CD8 T cells, J Granulocytes, K Myeloid Dendritic cell (MoDC), L CD8 cytotoxic T cell (Tc). The data were presented as mean ± S.E.M. and the adjusted p-values were determined by one-way ANOVA Tukey’s test. Source data are provided as a Source Data file.
Fig. 8
Fig. 8. PARP14 is a negative feedback regulator of IFNγ signalling.
A Chronic IFNγ pre-treated A375, 501-Mel, MC38, or YUMM2.1 cells were treated for 48 h with PARP14 pharmacological inhibitors RBN012759 (left) and RBN012811 (right). Expression of PARP14, pSTAT1, STAT1 and STAT1 target proteins is shown by western blot, with GAPDH visualised as a loading reference. B–C Graphs showing the relative maximum observed change in cell number as determined by crystal violet following 48 h treatment with varying concentrations of PARP14 inhibitor (12759: n = 9 per concentration; 12811: n = 9 per concentration) without IFNγ (B) or with 2-week IFNγ (C). The data were presented as mean ± S.E.M. D GSEA based on RNA-seq data depicting hallmark processes enriched in chronic IFNγ pre-treated tumours treated with RBN012759 or RBN012811 versus control (DMSO). The circle area depicts the NES, and colour intensity depicts the FDR, with ≤0.25 classed as significant. E RT-qPCR analysis of Cxcl10 and Cxcl11 mRNA expression levels in IFN-γ-YUMM2.1 and IFN-γ-MC38 cells treated with DMSO (n = 3); 12759 (n = 3); 12811 (n = 3). The data were presented as mean ± S.E.M. and the adjusted p-values were assessed by one-way ANOVA Dunnett’s test. Source data are provided as a Source Data file.
Fig. 9
Fig. 9. YUMM2.1 tumours spontaneously relapsing after α-PD-1 treatment are highly inflamed with T cells.
A RT-qPCR analysis of Cxcl10, Ifng, Stat1, Irf1, and Parp14 mRNA expression levels in YUMM2.1 tumours which (relapsed after α-PD-1 antibody treatment: n = 4) compared to IgG2a-treated tumours (control: n = 4). The data were presented as mean ± S.E.M. and the p-values were assessed by two-tailed unpaired t-test. B Differential gene expression of IFNγ targent genes in short-term melanoma cell cultures derived from ICBT-progressing lesions with elevated IFNγ-signalling compared to cultures where intrinsic IFN-signalling was minimal. Circle area depicts-log2 fold change and colour intensity depicts-log10(p-value), with ≥1.30 classed as significant. The p-values were assessed by two-tailed unpaired t-test. C GSEA based on RNA-seq data depicting hallmark processes enriched when comparing YUMM2.1 tumours that relapsed after α-PD-1 treatment versus control; and relapsing after α-PD-1 treatment versus responding during α-PD-1 treatment. Circle area depicts the NES, and colour intensity depicts the FDR, with ≤0.25 classed as significant. D–K Bulk-tumour RNA-seq results derived from Untreated (n = 4), PD-1 Responders (n = 4), and PD-1 Progressors (n = 4) analysed by cell-type enrichment analysis (ImmuCellAI), with scores shown for D infiltration, E T cell, F CD8 T cell, G CD8 Tcm, H CD8 Tem, I CD8 Tex, J Macrophage, and K Naive CD8 T cell. The data were presented as mean ± S.E.M. and the adjusted p-values were assessed by one-way ANOVA Šídák’s test. L Expression differences of immunosuppressive gene in tumours derived from α-PD-1-relapsing condition compared with control condition by sequencing bulk mRNA. Circle area depicts-log2 fold change and colour intensity depicts -log10(p-value), with ≥1.30 classed as significant. The p-values were assessed by two-tailed unpaired t-test. Source data are provided as a Source Data file.
Fig. 10
Fig. 10. Both PARP14 inhibition and JAK inhibition can improve the survival of mice bearing relapsing YUMM2.1 tumours.
A 8–12-week-old wild-type C57BL/6 J mice were subcutaneously implanted with YUMM2.1 cells. Treatment with α-PD-1 antibodies (two doses, three days apart) was initiated once tumour volume reached ~80 mm3. Once the tumours had regrown to roughly the size at which α-PD-1 treatment was initially commenced, they were randomised into four treatment groups: control (n = 8); PARP14i (14 doses; 2 doses per day) (n = 9); α-PD-1 antibodies (3 doses of α-PD-1 in every 3 days) and PARP14i (14 doses; 2 doses per day) (n = 6); Ruxolitinib (7 doses; 1 dose per day) (n = 8). B The percentage change in tumour volume between the start of retreatment and day 7, 14, 21, and 24 post-retreatment. The data were presented as mean ± S.E.M. and the adjusted p-values were assessed by two-way ANOVA Tukey’s test. C Kaplan–Meier survival plots for each treatment arm. The p-values were assessed by Log-rank (Mantel-Cox) test. D Growth curves for each tumour per condition. Source data are provided as a Source Data file.

References

    1. Patsoukis N, Wang Q, Strauss L, Boussiotis VA. Revisiting the PD-1 pathway. Sci. Adv. 2020;6:eabd2712. - PMC - PubMed
    1. Ribas A, Wolchok JD. Cancer immunotherapy using checkpoint blockade. Science. 2018;359:1350–1355. - PMC - PubMed
    1. Schoenfeld AJ, Hellmann MD. Acquired resistance to immune checkpoint inhibitors. Cancer Cell. 2020;37:443–455. - PMC - PubMed
    1. Shankaran V, et al. IFNγ and lymphocytes prevent primary tumour development and shape tumour immunogenicity. Nature. 2001;410:1107–1111. - PubMed
    1. Ayers M, et al. IFN-γ–related mRNA profile predicts clinical response to PD-1 blockade. J. Clin. Investig. 2017;127:2930–2940. - PMC - PubMed

Publication types

Substances