. 2023 Sep 26;14(9):635.
doi: 10.1038/s41419-023-06161-9.

The oleic/palmitic acid imbalance in exosomes isolated from NAFLD patients induces necroptosis of liver cells via the elongase-6/RIP-1 pathway

Affiliations

The oleic/palmitic acid imbalance in exosomes isolated from NAFLD patients induces necroptosis of liver cells via the elongase-6/RIP-1 pathway

Maria Principia Scavo et al. Cell Death Dis. .

Abstract

Excessive toxic lipid accumulation in hepatocytes underlies the development of non-alcoholic fatty liver disease (NAFLD), phenotypically characterized by necrosis and steato-fibrosis, whose molecular mechanism is not yet fully understood. Patients with NAFLD display an imbalanced palmitic (PA) to oleic acid (OA) ratio. Moreover, increasing experimental evidence points out a relevant involvement of the exosomal content in disease progression. Aim of the study was to highlight the PA/OA imbalance within circulating exosomes, the subsequent intracellular alterations, and the impact on NALFD. Liver cells were challenged with exosomes isolated from both healthy subjects and NAFLD patients. The exosomal PA/OA ratio was artificially modified, and biological effects were evaluated. A NAFLD-derived exosomal PA/OA imbalance impacts liver cell cycle and cell viability. OA-modified NAFLD-derived exosomes restored cellular viability and proliferation, whereas the inclusion of PA into healthy subjects-derived exosomes negatively affected cell viability. Moreover, while OA reduced the phosphorylation and activation of the necroptosis marker, Receptor-interacting protein 1 (phospho-RIP-1), PA induced the opposite outcome, alongside increased levels of stress fibers, such as vimentin and fibronectin. Administration of NAFLD-derived exosomes led to increased expression of Elongase 6 (ELOVL6), Stearoyl-CoA desaturase 1 (SCD1), Tumor necrosis factor α (TNF-α), Mixed-lineage-kinase-domain-like-protein (MLKL) and RIP-1 in the hepatocytes, comparable to mRNA levels in the hepatocytes of NAFLD patients reported in the Gene Expression Omnibus (GEO) database. Genetic and pharmacological abrogation of ELOVL6 elicited a reduced expression of downstream molecules TNF-α, phospho-RIP-1, and phospho-MLKL upon administration of NAFLD-derived exosomes. Lastly, mice fed with high-fat diet exhibited higher phospho-RIP-1 than mice fed with control diet. Targeting the Elongase 6-RIP-1 signaling pathway offers a novel therapeutic approach for the treatment of the NALFD-induced exosomal PA/OA imbalance.


Conflict of interest statement

The authors declare no competing interests.

Figures

Fig. 1
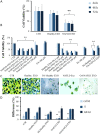
Fig. 1. Lipidomic evaluation.
A Comparison between the peak intensity of PA (light blue bar) and OA (blue bar) obtained by GC-FID chromatography of FA extracted from exosomes of healthy and NAFLD subjects. *P < 0.005 and **P < 0.001. B Percentage of PA and OA determined by GC-FID chromatography in exosomes from healthy subjects (Control) and NAFLD patients (NAFLD-Exo), before and after loading with exogenous PA and OA, respectively.
Fig. 2
Fig. 2. Cell viability evaluation and live cell cycle detection.
Cell viability was evaluated by MTS assay, on Hepa-RG cells, after incubation with Healthy-Exo and NAFLD-Exo samples (A, B), alone or in combination with free PA (fPA) or OA (fOA) at different concentrations (5–100 µM), hybrid exosomes (PA/Healthy-Exo and OA/NAFLD-Exo) and fPA or fOA at 100 μM. Representative bright-field images of live Hepa-RG cells stained with CellClock™ Dye Reagent to monitor the four major cell cycle phases: dark green-blue (G2/M phases), light green (S phase) and Yellow (G0/G1 Phases) (C). Cells were treated with exosomes derived from healthy subjects and NAFLD patients, or hybrid exosomes loaded with FA. Scale bar 50 μm. The histogram represents the quantification of differences (%) between the different cell cycle phases (D). The exosomes concentration in terms of the total protein content was fixed at 20 µg/µL. The PA and OA concentrations were 10 and 13.5 µM respectively in PA/Healthy-Exo and OA/NAFLD-Exo samples. Negative controls were untreated cells (CTR). Experiments were repeated three times. **P < 0.001.
Fig. 3
Fig. 3. Cell death evaluation by PI and Annexin-5.
Cell death was evaluated by PI assay, on Hepa-RG cells, untreated (CTR) (A), and after incubation with NAFLD-Exo (B) and Healthy-Exo samples (C). Experiments were repeated three times and the PI% intensity was reported in (D). **P < 0.001. Western blotting assay was performed for Annexin V. Negative controls were untreated cells normalized using GAPDH in the same way as the cells treated with NAFLD-Exo and Healthy-Exo samples (E). In the histogram, semi-quantitative evaluation, performed by means of video-densitometry, of the relative expression levels of the Annexin-5 (F, average of three experiments). For all the experiments, the exosomes concentration was fixed at 20 µg/µL in terms of total protein content.
Fig. 4
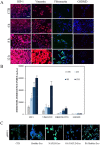
Fig. 4. Detection of RIP-1, fibronectin, vimentin, GSDMD and phospho-RIP-1 in Hepa-RG cells by immunofluorescence confocal microscopy.
A Immunofluorescence imaging and analysis. B RIP-1, fibronectin, vimentin and GSDMD in cells incubated for 4, 8, and 12 h with NAFLD-Exo. (**P < 0.001). Blue channel: nuclei; red channel: RIP-1 or vimentin or GSDMD, green channel: fibronectin. C Immunofluorescence imaging and phospho-RIP-1 in Hepa-RG cells treated with pristine exosomes (Healthy-Exo and NAFLD-Exo) and hybrid exosomes (PA/Healthy-Exo and OA/NAFLD-Exo) for 12 h. Blue channel: nuclei, green channel: phospho-RIP-1. Experiments were repeated three times. Scale bar 50 μm.
Fig. 5
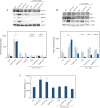
Fig. 5. Intracellular expression of RIP-1, phospho-RIP-1, GSDMD, and TGF-β1 in Hepa-RG cells.
Representative western blotting of Hepa-RG cells treated with pristine exosomes (A) and hybrid exosomes (B) for RIP-1, phospho-RIP-1, GSDMD and TGF-β1, normalized using AKT and LAMIN A/C housekeeping proteins for the cytoplasm (C) and nuclei (N), respectively. Semi-quantitative evaluation, performed by means of video-densitometry, of the relative expression levels of RIP-1, phospho-RIP-1, GSDMD, and TGF-β1, normalized using AKT and LAMIN A/C for the cytoplasm, and nuclei, respectively, in the cells treated with exosomes and hybrid exosomes, C and D, respectively. Negative controls are untreated cells. *P < 0.001 and **P < 0.005. For all the experiments, the exosomes concentration was fixed at 20 µg/µL in terms of total protein content. The PA and OA concentration was 10 and 13.5 µM in PA/Healthy-Exo and OA/NAFLD-Exo samples, respectively.
Fig. 6
Fig. 6. ELOVL6, SCD1, RIP-1, MLKL, TNF-α, and CASP1 mRNA expression in liver tissue of NAFLD patients.
mRNA and cellular expression proteins. Data were obtained from RNA sequencing analysis, as downloaded from the Gene Expression Omnibus database (GSE130970), of liver tissue obtained from 72 patients with NAFLD and from 6 controls (CTRL). Mean expression data are expressed as TPM (transcripts per million) (A). Representative western blotting analysis of ELOVL6, SCD1, RIP-1, MLKL, TNF-α, CASP1 proteins, and marker protein GAPDH in Hepa-RG cells treated with NAFLD-Exo and Healthy-Exo samples (B). Semiquantitative evaluation of proteins expression level in the Hepa-RG cell line treated with NAFLD-Exo and Healthy-Exo samples, by video-densitometry analysis of proteins bands on western blotting. GAPDH protein band was used for the normalization of the targeted protein bands for each sample considered. *P < 0.005 and **P < 0.001 vs healthy subjects or untreated cells (CTR) (C).
Fig. 7
Fig. 7. ELOVL6, phospho-RIP-1, and phospho-MLKL expression in Hepa-RG cells.
A Representative western blotting of ELOVL6, phospho-RIP-1, and phospho-MLKL (upper panel) with the corresponding densitometry analysis of protein level (lower panel) in silenced Hepa-RG cells, after incubation with pristine exosomes only or in combination with transfection complex; 20 μg of total protein extract were loaded. Negative control (CTR) was untreated cells and the vehicle was cells with si‐PORT‐NeoFX transfection agent only; GAPDH was used to normalize the targeted protein for each sample considered. **P < 0.001 vs negative control. B Representative western blotting of RIP-1, phospho-RIP-1 and phospho-MLKL (upper panel) with the corresponding densitometry analysis of protein level (lower panel), upon incubation of Hepa-RG cells with exosomes, only or in combination with Necrostatin-1 (NEC); 20 μg of total protein extract were loaded. Negative control (CTR) was untreated cells and GAPDH was used to normalize the targeted protein for each sample considered. **P < 0.001 vs negative control. C ROS evaluation by oxidation of 2,7-dichlorophluorescein diacetate (DCFH-DA) upon incubation of Hepa-RG cells with exosomes, only or in combination with transfection complex. Negative control (CTR) was untreated cells, while positive CTR was cells treated with H2O2. *P < 0.005 vs negative control.
Fig. 8
Fig. 8. Histology of mice liver tissue.
He-E in mice tissues, WT (without treatment) and at 12 and 20 weeks of treatment with a high fat diet (A). Immunohistochemical expression of ELOVL6 (B), phospho-RIP-1 (C) and phospho-MLKL (D) in mice without treatment (WT) and fed a high fat diet for 12 weeks and 20 weeks (B). Number of pixels per cell cytoplasm or total number of nuclei, mean ± SD obtained for ELOVL6 only for cytoplasm (E), phospho-RIP-1 expression in the nuclei (F) and cytoplasm (F1). Number of pixels per cell cytoplasm or total number of nuclei, mean ± SD obtained for phospho-MLKL expression in the nuclei (G) and cytoplasm (G1). The values observed in the different cellular districts were significantly different by ANOVA test **P < 0.001 and *P < 0.005. Scale bar 50 μm. Black arrows indicate the presence of phospho-RIP-1 or phospho-MLKL in the nuclei.

References

    1. Ibrahim SH, Kohli R, Gores GJ. Mechanisms of lipotoxicity in NAFLD and clinical implications. J Pediatr Gastroenterol Nutr. 2011;53:131–40. doi: 10.1097/MPG.0b013e31822578db. - DOI - PMC - PubMed
    1. Haas JT, Francque S, Staels B. Pathophysiology and mechanisms of nonalcoholic fatty liver disease. Annu Rev Physiol. 2016;78:181–205. doi: 10.1146/annurev-physiol-021115-105331. - DOI - PubMed
    1. Masoodi M, Gastaldelli A, Hyötyläinen T, Arretxe E, Alonso C, Gaggini M, et al. Metabolomics and lipidomics in NAFLD: biomarkers and non-invasive diagnostic tests. Nat Rev Gastroenterol Hepatol. 2021;18:835–56. doi: 10.1038/s41575-021-00502-9. - DOI - PubMed
    1. Puri P, Baillie RA, Wiest MM, Mirshahi F, Choudhury J, Cheung O, et al. A lipidomic analysis of nonalcoholic fatty liver disease. Hepatology. 2007;46:1081–90. doi: 10.1002/hep.21763. - DOI - PubMed
    1. Carta G, Murru E, Banni S, Manca C. Palmitic acid: physiological role, metabolism and nutritional implications. Front Physiol. 2017;8:1–14. doi: 10.3389/fphys.2017.00902. - DOI - PMC - PubMed