. 2023 Sep 26;14(1):6007.
doi: 10.1038/s41467-023-41744-2.

Social memory deficit caused by dysregulation of the cerebellar vermis

Affiliations

Social memory deficit caused by dysregulation of the cerebellar vermis

Owen Y Chao et al. Nat Commun. .

Abstract

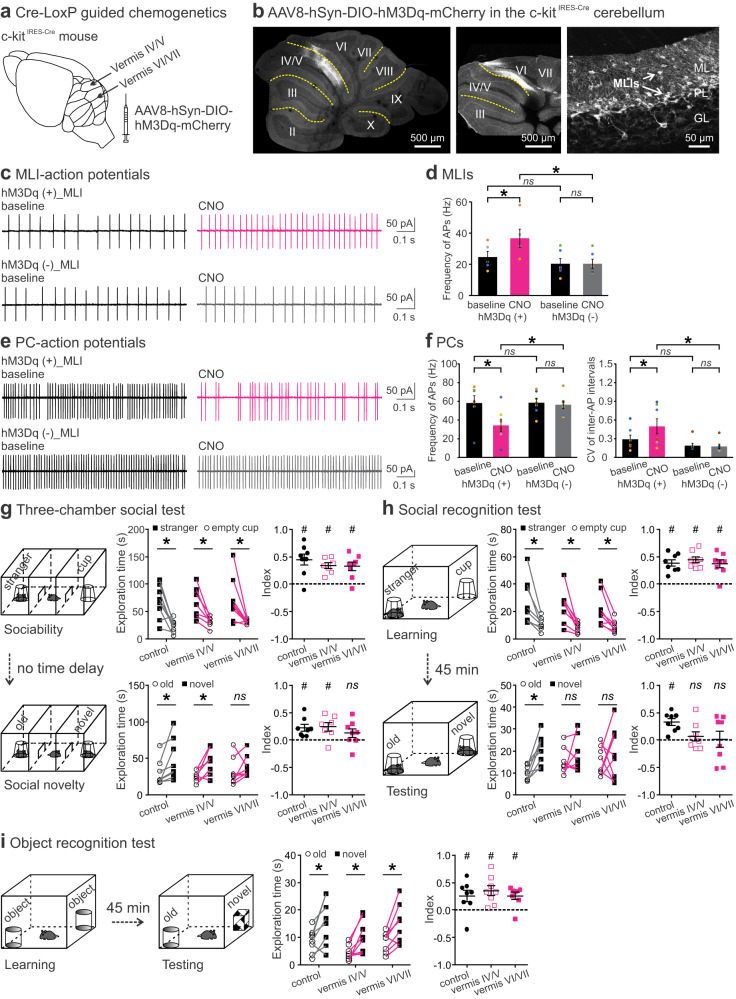
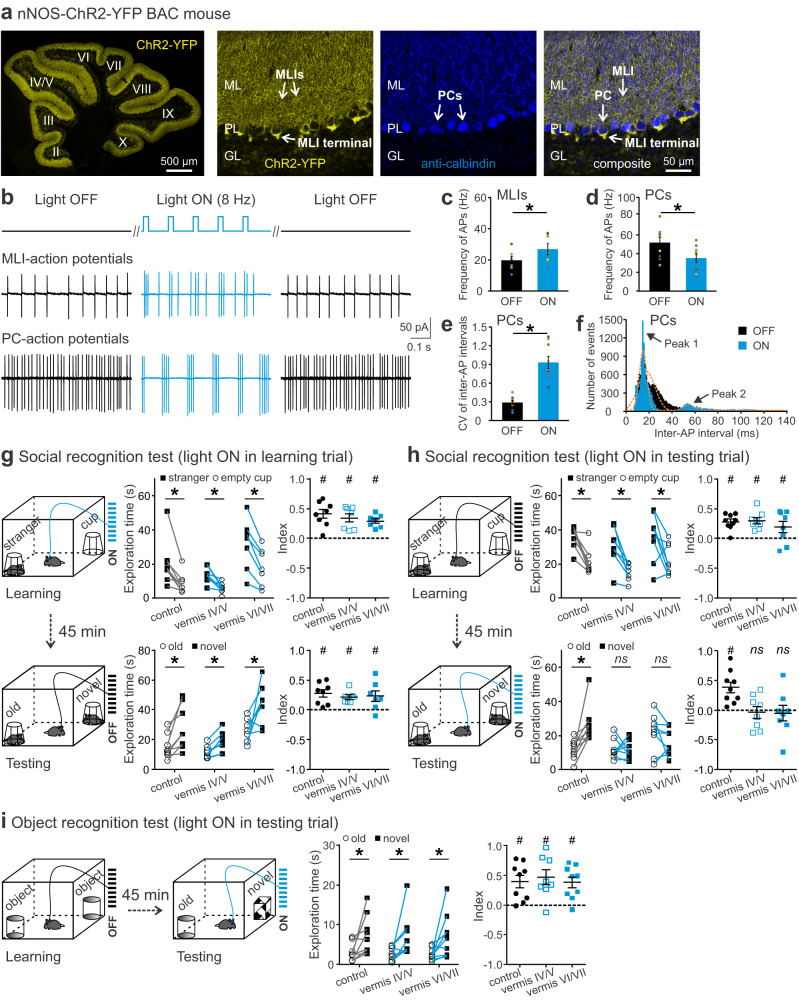
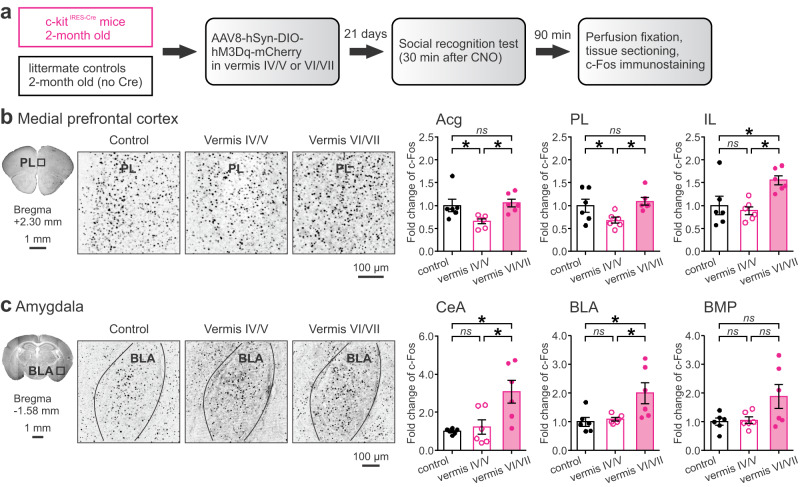
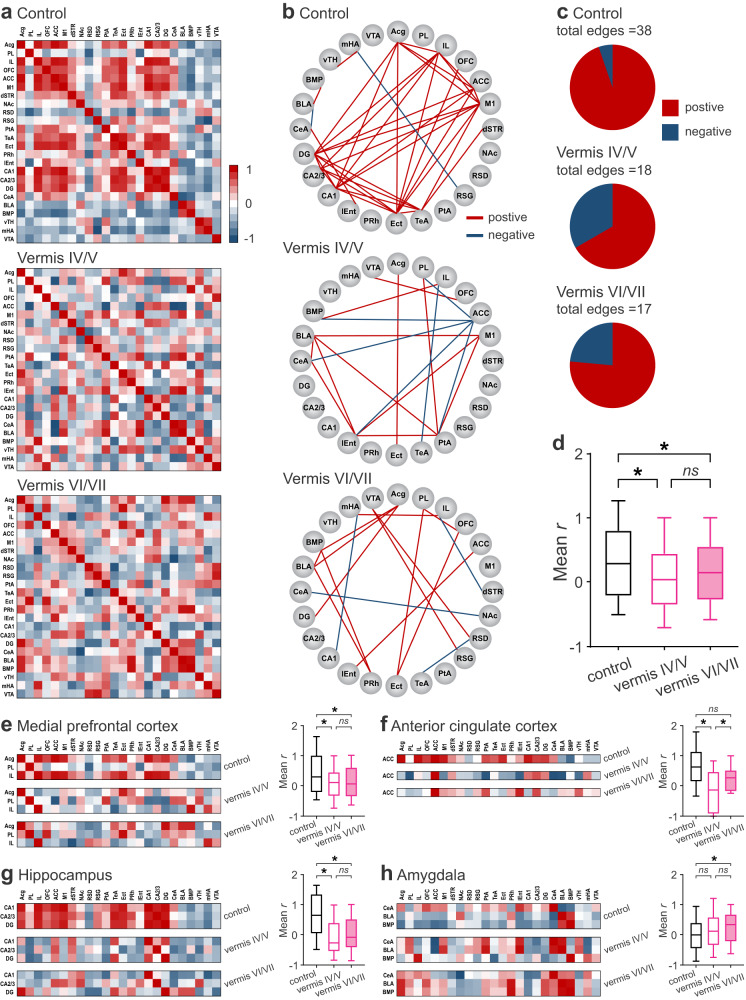
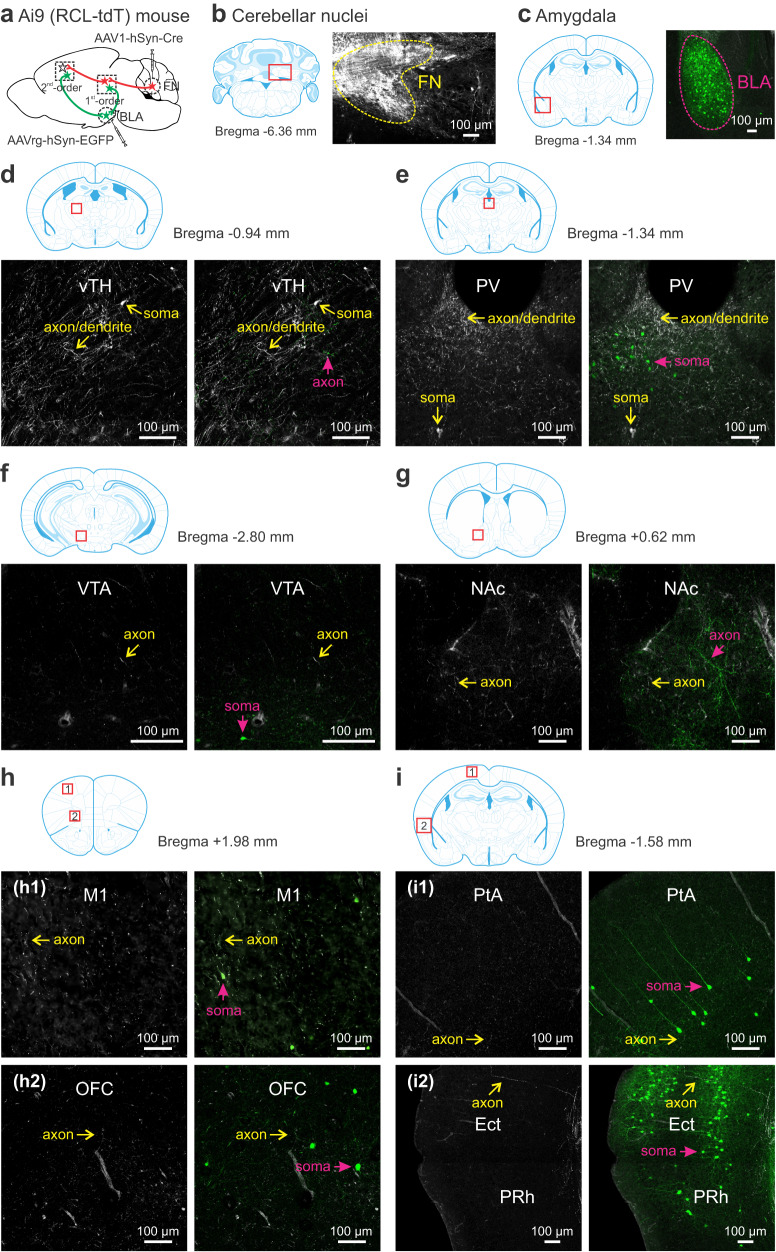
Social recognition memory (SRM) is a key determinant of social interactions. While the cerebellum emerges as an important region for social behavior, how cerebellar activity affects social functions remains unclear. We selectively increased the excitability of molecular layer interneurons (MLIs) to suppress Purkinje cell firing in the mouse cerebellar vermis. Chemogenetic perturbation of MLIs impaired SRM without affecting sociability, anxiety levels, motor coordination or object recognition. Optogenetic interference of MLIs during distinct phases of a social recognition test revealed the cerebellar engagement in the retrieval, but not encoding, of social information. c-Fos mapping after the social recognition test showed that cerebellar manipulation decreased brain-wide interregional correlations and altered network structure from medial prefrontal cortex and hippocampus-centered to amygdala-centered modules. Anatomical tracing demonstrated hierarchical projections from the central cerebellum to the social brain network integrating amygdalar connections. Our findings suggest that the cerebellum organizes the neural matrix necessary for SRM.


Conflict of interest statement

The authors declare no competing interests.

Figures

Fig. 1
Fig. 1. Chemogenetic excitation of MLIs in cerebellar lobules IV-VII disrupted social, but not object, recognition memory.
a Design to target MLIs by infusing AAV8-hSyn-DIO-hM3Dq-mCherry (hM3Dq) into the anterior (lobule IV/V) or posterior (lobule VI/VII) vermis of a c-kitIRES-Cre mouse. b Examples of AAV-mediated expression of hM3Dq in MLIs (right) in lobule IV/V (left) or VI/VII (middle). ML, molecular layer; PL, Purkinje layer; GL, granular layer. Cell-attached patch-clamp recordings of APs from MLIs (c) expressing hM3Dq (top) or not (bottom) and their downstream PCs (e) before and after CNO application (10 µM). Effects of CNO on firing frequency of hM3Dq-containing (n = 5) or -lacking (n = 6) MLIs (d) and on firing frequency and coefficient of variation (CV) of inter-AP intervals of PCs (n = 7, both groups; f). g A three-chamber social test included a sociability and a social novelty trial without time delay in between (left). All groups showed intact sociability (explored the stranger more than the cup) and intact social novelty (explored the novel stranger more than the old one), except for vermis VI/VII group (right). h A social recognition test included a learning and a testing trial with a 45 min inter-trial interval (left). All groups displayed intact sociability, but perturbation of lobule IV/V or VI/VII impaired animals’ social recognition (explored the novel and the old strangers indiscriminately) (right). i An object recognition test included a learning and a testing trial with a 45 min inter-trial interval (left). All groups had intact object recognition (explored the novel object more than the old one) (right). CNO (1 mg/kg) was given 30–40 min before each test. In the sociability trial of three-chamber tests and in the learning trial of social recognition tests: index = [time for exploring the stranger − time for exploring the cup] / total exploration time. In the social novelty trial of three-chamber tests and in the testing trials of social and object recognition tests: index = [time for exploring the novel one − time for exploring the old one] / total exploration time. *p < 0.05, two-tailed paired or unpaired t-test. #p < 0.05, two-tailed one-sample t-test compared to 0. ns, not significant. n = 7–9 mice/group for behavior tests. Data are presented as the mean ± SEM and the center of error bars is the mean. Source data are provided as a Source Data file.
Fig. 2
Fig. 2. Optogenetic stimulation of MLIs in cerebellar lobules IV-VII in the retrieval, but not encoding, phase impaired social recognition memory.
a Cerebellar slice from a nNOS-ChR2 mouse (left). Co-labeling of PCs with an anti-Calbindin antibody showed selective expression of ChR2 in the soma and processes of MLIs (right). ML molecular layer, PL Purkinje layer, GL granular layer, ChR2 channelrhodopsin-2, YFP yellow fluorescent protein. b APs recorded from MLIs (middle) and PCs (bottom) of a nNOS-ChR2 mouse in response to photostimulation (25 ms, 8 Hz, top). Photostimulation increased the AP frequency from MLIs (n = 7; c) but decreased it from PCs (n = 9; d) and increased the coefficient of variation (CV) of inter-AP intervals for PCs (n = 9; e). Histograms of the number of events versus inter-AP interval (bin width 1 ms) showed a shift from unimodal to bimodal distribution by photostimulation (f). Dotted lines were fits with a Gaussian function: f(x) = a·e-(x-µ)2/2σ2/(σ·√2π) + c. a, height of the peak; µ, center position of the peak; σ, standard deviation. g In a social recognition test, light delivery (25 ms, 8 Hz, 10 s pause every 50 s) in the learning trial did not affect animals’ social approach (explored the stranger more than the cup) or social recognition (explored the novel stranger more than the old one). h Same light delivery in the testing trial impaired animals’ social recognition (explored the novel and the old strangers equally) without affecting their social preference (explored the stranger more than the cup). i Same light delivery in the testing trial of an object recognition test had no effect on animals’ object recognition (explored the novel object more than the old one). In the learning trial of social recognition tests: index = [time for exploring the stranger − time for exploring the cup] / total exploration time. In the testing trial of social and object recognition tests: index = [time for exploring the novel one − time for exploring the old one] / total exploration time. Positive values of indices suggest intact performance. *p < 0.05, two-tailed paired t-test. #p < 0.05, two-tailed one-sample t-test compared to 0. ns, not significant. n = 7–9 mice/group for behavior tests. Data are presented as the mean ± SEM and the center of error bars is the mean. Source data are provided as a Source Data file.
Fig. 3
Fig. 3. Altered c-Fos expression by chemogenetic excitation of MLIs in cerebellar lobules IV-VII following the social recognition test.
a Design of c-Fos imaging after the social recognition test. Examples of c-Fos staining (black dots) in the PL (b) and BLA (c) subregions. Fold change, defined as the number of c-Fos-positive cells in each group divided by the average value of the control group, was summarized for all subregions in the medial prefrontal cortex and amygdala. *p < 0.05, two-tailed Fisher’s LSD test. ns, not significant. n = 6 mice/group. Data are presented as the mean ± SEM and the center of error bars is the mean. Source data are provided as a Source Data file. Acg anterior cingulate cortex (rostral), PL prelimbic cortex, IL infralimbic cortex, CeA central nucleus of amygdala, BLA basolateral amygdala, BMP basomedial amygdala.
Fig. 4
Fig. 4. Chemogenetic excitation of MLIs in cerebellar lobules IV-VII reduced interregional connectivity activated by social recognition.
a Matrices of interregional correlations derived from c-Fos-positive cells. Colors indicate the scale of Pearson coefficients (r) from 1 (red) to −1 (indigo). b Network graphs of significantly positive (r > 0.6, red lines) or negative (r < −0.6, indigo lines) correlations. c Pie charts of relative proportions of positive (red) and negative (indigo) correlations. d A box-and-whisker plot of average r in calculation of all interregional correlation coefficients. Matrices of interregional correlations for subregions in the medial prefrontal cortex (e), anterior cingulate cortex (f), hippocampus (g), and amygdala (h), together with box-and-whisker plots of average r for each region. The horizontal line inside each box indicated the median, the bounds of the box indicated the 25th and 75th percentiles, and the lower and upper whiskers indicated the 10th and 90th percentiles, respectively. *p < 0.05, two-tailed Fisher’s LSD test. ns, not significant. n = 6 mice/group. Source data are provided as a Source Data file. ACC anterior cingulate cortex, Acg anterior cingulate cortex (rostral), BLA basolateral amygdala, BMP basomedial amygdala, CA1 hippocampus CA1, CA2/3 hippocampus CA2/3, CeA central nucleus of amygdala, DG dentate gyrus, dSTR dorsal striatum, Ect ectorhinal cortex, IL infralimbic cortex, lEnt lateral entorhinal cortex, M1 primary motor cortex, mHA medial hypothalamus, NA nucleus accumbens, OFC orbitofrontal cortex, PL prelimbic cortex, PRh perirhinal cortex, PtA parietal association cortex, RSD retrosplenial dysgranular cortex, RSG retrosplenial granular cortex, TeA temporal association cortex, VTA ventral tegmental area, vTH ventral thalamus.
Fig. 5
Fig. 5. Chemogenetic excitation of MLIs in cerebellar lobules IV-VII disrupted modular structure of social recognition network.
Rankings of normalized degree (left), betweenness (middle), within-community Z-scores and participation coefficients (right) of brain regions for control (a), vermis IV/V (b), and vermis VI/VII (c) groups. df Hubs revealed by graph theoretical analysis of neural networks activated during social recognition in all groups. Hubs were defined with modularity maximization, based on within-community Z-score and participation coefficient of each region. Distinct communities were color coded. Size of nodes (brain regions) was proportional to their degree. Note that participation coefficients for vermis IV/V and VI/VII groups were zero and thus they did not form >1 module. Source data are provided as a Source Data file. ACC anterior cingulate cortex, Acg anterior cingulate cortex (rostral), BLA basolateral amygdala, BMP basomedial amygdala, CA1 hippocampus CA1 CA2/3, hippocampus CA2/3, CeA central nucleus of amygdala, DG dentate gyrus, dSTR dorsal striatum, Ect ectorhinal cortex, IL infralimbic cortex, lEnt lateral entorhinal cortex, M1 primary motor cortex, mHA medial hypothalamus, NAc nucleus accumbens, OFC orbitofrontal cortex, PL prelimbic cortex, PRh perirhinal cortex, PtA parietal association cortex, RSD retrosplenial dysgranular cortex, RSG retrosplenial granular cortex, TeA temporal association cortex, VTA ventral tegmental area, vTH ventral thalamus.
Fig. 6
Fig. 6. Transsynaptic tracing of cerebello-cortical circuits.
a Schematic of anterograde tracing by injecting AAV1-hSyn-Cre into the FN of an Ai9 mouse that has a LoxP site. Via Cre-LoxP recombination, transduced FN neurons express tdTomato and project to a first-order nucleus. As the virus has a transsynaptic property, it further transduces neurons in the first-order station, which send axons to a second-order nucleus. b Among cerebellar nuclei, the FN was primarily targeted as shown in three consecutive sections. Occasionally, the virus retrogradely transfected PCs in the cerebellar cortex. FN fastigial nucleus, IN interposed nucleus, DN dentate nucleus. c Examples of tdTomato labeling (in white) of somas, dendrites, and axons in the first-order nuclei (rostral to caudal): ventral thalamus (vTH), medial hypothalamus (mHA), ventral tegmental area (VTA; few somas), substantia nigra pars compacta (SNc), substantia nigra pars reticulata (SNr), and red nucleus (RN). Thalamic subregions were highlighted in the middle panels, including anteromedial thalamus (AM), centrolateral thalamus (CL), centromedian thalamus (CM), mediodorsal thalamus (MD), and paraventricular thalamus (PV). The images represented average fluorescent intensity of 2-4 serial sections for each region in 3 mice. Cell nuclei were stained with DAPI (blue). All regions were outlined with the mouse brain atlas. The atlas was adapted from Franklin, K. B. J. & Paxinos, G. The mouse brain in stereotaxic coordinates, compact third edition (Academic Press; 3rd edition, 2008).
Fig. 7
Fig. 7. Transsynaptic tracing of cerebello-cortical circuits (continued).
ae Examples of labeled axons and axon terminals (white) in the second-order nuclei that were connected to the fastigial nucleus via neurons in the first-order stations. Images were taken from cortical and subcortical areas in the same Ai9 mice (n = 3) infused with AAV1-hSyn-Cre into the fastigial nucleus as in Fig. 6. The cortical areas included Acg (a1), PL (a2), IL (a3), M1 (a4), OFC (a5), ACC (b1), RSD (c1), RSG (c2), PtA (c3), Ect (c4, e1), PRh (c4, e1), TeA (e1), and lEnt (e1). The subcortical areas included dSTR (b2), NAc (b3), CA1 (d1), CA2/3 (d2), DG (d3), CeA (d4), BLA (d4), and BMP (d4). The images represented average fluorescent intensity of 2–4 serial sections for each region in 3 mice. Cell nuclei were stained with DAPI (blue). All regions were outlined with the mouse brain atlas. The atlas was adapted from Franklin, K. B. J. & Paxinos, G. The mouse brain in stereotaxic coordinates, compact third edition (Academic Press; 3rd edition, 2008). ACC anterior cingulate cortex, Acg anterior cingulate cortex (rostral), BLA basolateral amygdala, BMP basomedial amygdala, CA1 hippocampus CA1, CA2/3 hippocampus CA2/3, CeA central nucleus of amygdala, DG dentate gyrus, dSTR dorsal striatum, Ect ectorhinal cortex, IL infralimbic cortex, lEnt lateral entorhinal cortex, M1 primary motor cortex, NAc nucleus accumbens, OFC orbitofrontal cortex, PL prelimbic cortex, PRh perirhinal cortex, PtA parietal association cortex, RSD retrosplenial dysgranular cortex, RSG retrosplenial granular cortex, TeA temporal association cortex.
Fig. 8
Fig. 8. Simultaneous tracing of the FN outputs and BLA inputs.
a Strategy for anterograde tracing of the fastigial nucleus (FN) outputs with AAV1-hSyn-Cre and retrograde tracing of the basolateral amygdala (BLA) inputs with AAVrg-hSyn-EGFP in Ai9 mice (n = 3). FN and its downstream neurons were tagged with tdTomato as shown in Fig. 6 & 7. BLA and its upstream neurons were labeled with EGFP. Examples of viral expression in the FN (white; b) and BLA (green; c), contoured with dotted lines to show the transduced areas. di Images taken from subcortical (dg) and cortical (hi: h1, M1; h2, OFC; i1, PtA; i2, Ect and PRh) regions showing the FN downstream neurons and their processes (white; indicated with yellow arrows), and BLA upstream neurons (green; indicated with magenta arrows). Note that the white and green signals rarely overlapped. In the vTH (d) and NAc (g), green axons (not somas) were present, implying these areas are the BLA output targets rather than provide input to the BLA. The images represented average fluorescent intensity of 2–4 serial sections for each region in 3 mice. All regions were outlined with the mouse brain atlas. The atlas was adapted from Franklin, K. B. J. & Paxinos, G. The mouse brain in stereotaxic coordinates, compact third edition (Academic Press; 3rd edition, 2008). Ect ectorhinal cortex, M1 primary motor cortex, NAc nucleus accumbens, OFC orbitofrontal cortex, PRh perirhinal cortex, PtA parietal association cortex, PV paraventricular thalamus, VTA ventral tegmental area, vTH ventral thalamus.

References

    1. Adolphs R. The neurobiology of social cognition. Curr. Opin. Neurobiol. 2001;11:231–239. doi: 10.1016/S0959-4388(00)00202-6. - DOI - PubMed
    1. Insel TR, Fernald RD. How the brain processes social information: searching for the social brain. Annu Rev. Neurosci. 2004;27:697–722. doi: 10.1146/annurev.neuro.27.070203.144148. - DOI - PubMed
    1. Frith CD, Frith U. Mechanisms of social cognition. Annu Rev. Psychol. 2012;63:287–313. doi: 10.1146/annurev-psych-120710-100449. - DOI - PubMed
    1. Pelphrey K, Adolphs R, Morris JP. Neuroanatomical substrates of social cognition dysfunction in autism. Ment. Retard Dev. Disabil. Res Rev. 2004;10:259–271. doi: 10.1002/mrdd.20040. - DOI - PubMed
    1. Couture SM, Penn DL, Roberts DL. The functional significance of social cognition in schizophrenia: a review. Schizophr. Bull. 2006;32:S44–S63. doi: 10.1093/schbul/sbl029. - DOI - PMC - PubMed

Publication types