. 2023 Sep 26;13(1):16149.
doi: 10.1038/s41598-023-43383-5.

Shear wave elastography can stratify rectal cancer response to short-course radiation therapy

Affiliations

Shear wave elastography can stratify rectal cancer response to short-course radiation therapy

Reem Mislati et al. Sci Rep. .

Abstract

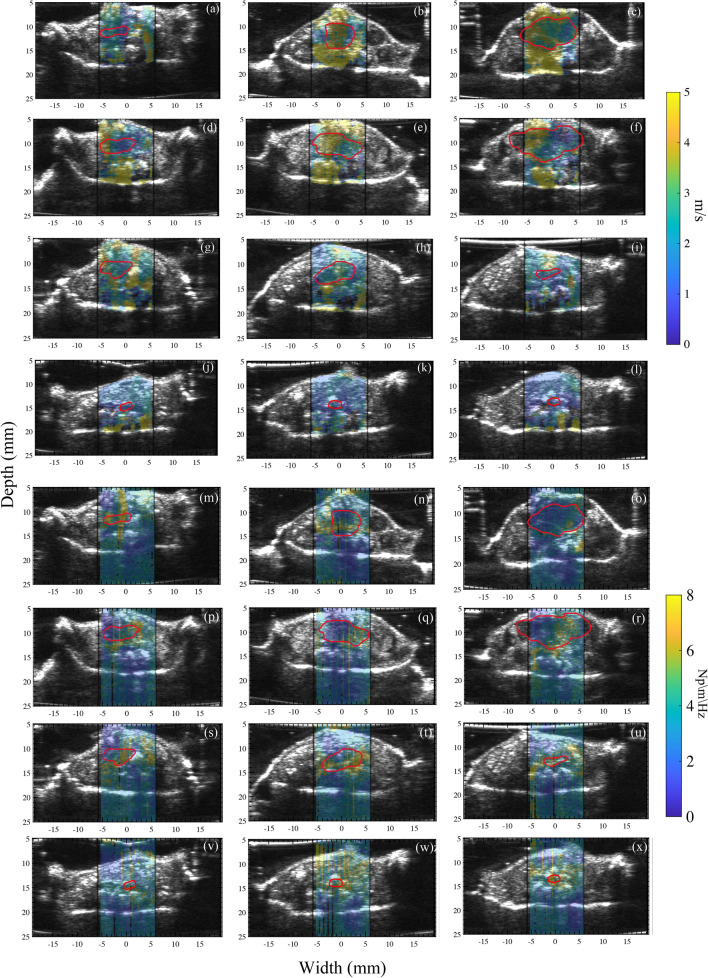
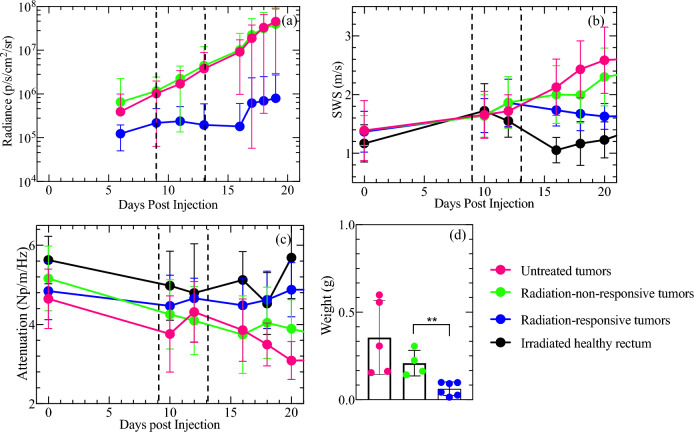
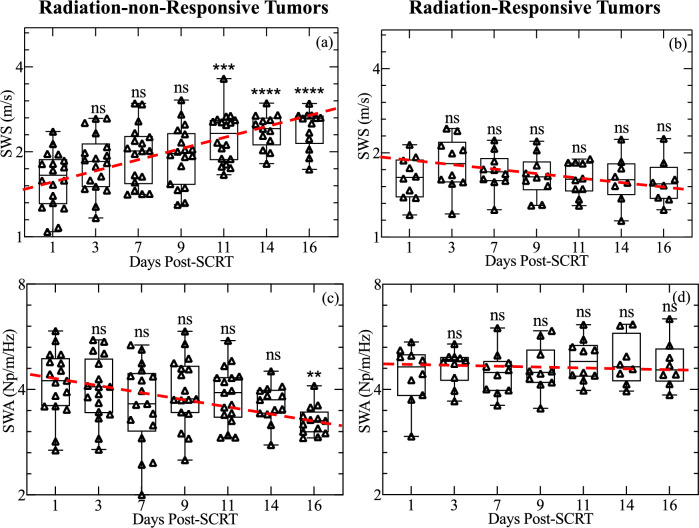
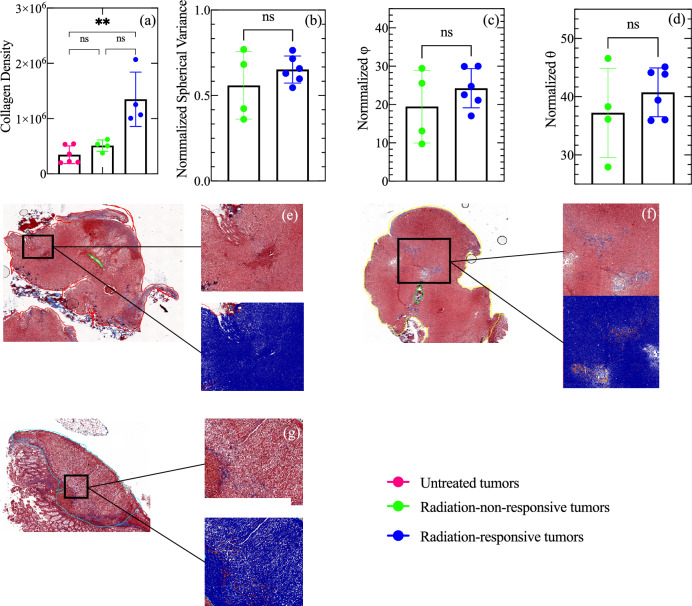
Rectal cancer is a deadly disease typically treated using neoadjuvant chemoradiotherapy followed by total mesorectal excision surgery. To reduce the occurrence of mesorectal excision surgery for patients whose tumors regress from the neoadjuvant therapy alone, conventional imaging, such as computed tomography (CT) or magnetic resonance imaging (MRI), is used to assess tumor response to neoadjuvant therapy before surgery. In this work, we hypothesize that shear wave elastography offers valuable insights into tumor response to short-course radiation therapy (SCRT)-information that could help distinguish radiation-responsive from radiation-non-responsive tumors and shed light on changes in the tumor microenvironment that may affect radiation response. To test this hypothesis, we performed elastographic imaging on murine rectal tumors (n = 32) on days 6, 10, 12, 16, 18, 20, 23, and 25 post-tumor cell injection. The study revealed that radiation-responsive and non-radiation-responsive tumors had different mechanical properties. Specifically, radiation-non-responsive tumors showed significantly higher shear wave speed SWS (p < 0.01) than radiation-responsive tumors 11 days after SCRT. Furthermore, there was a significant difference in shear wave attenuation (SWA) (p < 0.01) in radiation-non-responsive tumors 16 days after SCRT compared to SWA measured just one day after SCRT. These results demonstrate the potential of shear wave elastography to provide valuable insights into tumor response to SCRT and aid in exploring the underlying biology that drives tumors' responses to radiation.


Conflict of interest statement

The authors declare no competing interests.

Figures

Figure 1
Figure 1
Sonograms displaying the shear wave speed (SWS, al) and shear wave attenuation (SWA, mx) of representative samples where tumors are outlined in red. The samples include untreated tumors (ac), tumors that were radiation-non-responsive to short-course radiotherapy (SCRT) (df), tumors that were responsive to SCRT (gi), and healthy rectum tissue (jl). The columns in the figure represent the SWS or SWA measurements taken on days 12, 16, and 20 post-injection (3, 7, and 11 post-SCRT). The sonograms with SWA are also shown for untreated (mo), radiation-non-responsive tumors (pr), radiation-responsive tumors (su), and healthy rectum (vx). This figure provides a clear understanding of how SWS and SWA changes in different tissue types over time compared to healthy rectum tissue.
Figure 2
Figure 2
Measured tissue properties (radiance, SWS, SWA) of untreated tumors (pink), radiation-non-responsive tumors (green), radiation-responsive tumors (blue), and health rectum (black). Subplot (a) shows the radiance measured from day six post-tumor cell injection. Subplots (b) and (c) show the SWS and SWA measured over 20 days post-tumor cell injection, respectively. The vertical dotted lines indicate two time periods when measurements were made: during treatment (between the lines) and after therapy. Subplot (d) shows the weight of excised tumors 20 days post-tumor cell injections. The data reveals that SWS and radiance of untreated and radiation-non-responsive tumors increased with time; SWS and radiance of radiation-responsive tumors were lower than untreated and radiation-non-responsive tumors. The SWS of the normal rectum increased rapidly, decreased from days 10 to 16, and then increased steadily after day 16. SWA of untreated and radiation-non-responsive tumors was noticeably lower than those of healthy rectum and radiation-responsive tumors. Additionally, radiation-responsive tumors weighed significantly less than radiation-non-responsive tumors, as indicated by the p-value in the figure (**p < 0.01).
Figure 3
Figure 3
Changes in SWS and SWA for radiation-non-responsive and radiation-responsive tumors measured on days 1 to 16 post-SCRT. The boxplots in (a) and (b) show the changes in SWS measured up to 16 days post-SCRT for the subset of radiation-non-responsive and radiation-responsive tumors, respectively. Similarly, the boxplots in (c) and (d) show the change in SWA for the same subset of tumors for radiation-non-responsive and radiation-responsive tumors, respectively. The dashed red line is a visual guide of the trend observed over time. The significance was computed using a Kruskal–Wallis test followed by a Dunn’s multiple comparison test where the day 1 post-SCRT was set as control. The data reveals that SWS and SWA of radiation-non-responsive tumors changed significantly after SCRT, but there was no significant change in the properties of radiation-responsive tumors after SCRT. The significance of the differences is indicated by p-values and calculated relative to day 1 post-SCRT, with ** indicating p < 0.01, *** indicating p < 0.001, **** indicating p < 0.0001, and ns indicating p > 0.05.
Figure 4
Figure 4
Tumor area of untreated, radiation-non-responsive, and radiation-responsive tumors as a function of days post-SCRT. Subplot (a) shows the average cross-sectional area computed for the untreated (pink), radiation-non-responsive (green), and radiation-responsive tumors (blue). The untreated and radiation-non-responsive tumors exhibit an increase in area over time. Subplot (b) shows the cross-sectional area of the radiation-non-responsive tumors as a function of days post-SCRT. The significance is computed using a Kruskal–Wallis test with multiple comparisons. Subplot (c) shows the cross-sectional area of radiation-responsive tumors. There is no significant change in the cross-sectional area for the radiation-responsive tumors. However, there is a significant change for radiation-non-responsive tumors starting day 7 post-SCRT. The significance of the difference is indicated by p-values, with **** indicating p < 0.0001, ** indicating p < 0.005 and ns indicating p > 0.05. Subplots (d) and (e) show the correlation between SWS and the cross-sectional area on day 11 post-SCRT for radiation-non-responsive and radiation-responsive, respectively. Subplots (f) and (g) show the correlation SWA and the cross-sectional area of radiation-non-responsive and radiation-responsive tumors, respectively. This figure highlights that the tumors cross-sectional area changes at an earlier time point than SWS and SWA. There is a weak correlation between size and SWS for both groups.
Figure 5
Figure 5
Histological assessment of untreated (solid pink circles), radiation-non-responsive (solid green circles), and radiation-responsive tumors (solid blue circles). (a) Collagen density of the three tumor groups. (bd) Box plots of the parameters denoting collage orientation (normalized variance, φ, θ, respectively). (eg) Digitized Masson’s Trichrome of untreated, radiation-non-responsive, and radiation-responsive tumors, respectively, with zoom regions of areas of high collagen density (collagen illustrated by blue staining). The results show no statistically significant difference in either collagen density or collagen orientation of radiation-non-responsive and radiation-responsive tumors. The significance of the differences is indicated by p-values, with ** indicating p < 0.01 and ns indicating p > 0.05. The collagen density of untreated tumors was too low to guarantee meaningful results with SHG, so Fig. 6b–g only reports the results of treated tumors.
Figure 6
Figure 6
Results of genetic analysis of tissue samples from radiation-non-responsive, and radiation-responsive tumors. The enrichment plots for gene ontology pathways related to the ECM in the radiation-non-responsive group are presented in subplots (ad). The data suggest that radiation-responsive tumors do not show significant gene ontologies, while radiation-non-responsive tumors exhibit essential gene ontology items related to ECM. The ECM of the radiation-non-responsive tumors is more resistant to compressive force than those of radiation-responsive tumors.

References

    1. Sung H, et al. Global Cancer Statistics 2020: GLOBOCAN Estimates of Incidence and Mortality Worldwide for 36 Cancers in 185 countries. CA Cancer J. Clin. 2021;71(3):209–249. doi: 10.3322/caac.21660. - DOI - PubMed
    1. Xie Y-H, Chen Y-X, Fang J-Y. Comprehensive review of targeted therapy for colorectal cancer. Signal Transduct. Target. Ther. 2020;5(1):22. doi: 10.1038/s41392-020-0116-z. - DOI - PMC - PubMed
    1. Habr-Gama A, et al. Low rectal cancer. Dis. Colon Rectum. 1998;41(9):1087–1096. doi: 10.1007/BF02239429. - DOI - PubMed
    1. Habr-Gama A, et al. Long-term results of preoperative chemoradiation for distal rectal cancer correlation between final stage and survival. J. Gastrointest. Surg. 2005;9(1):90–101. doi: 10.1016/j.gassur.2004.10.010. - DOI - PubMed
    1. Habr-Gama A, et al. Operative versus nonoperative treatment for stage 0 distal rectal cancer following chemoradiation therapy: Long-term results. Ann. Surg. 2004;240(4):711–717. doi: 10.1097/01.sla.0000141194.27992.32. - DOI - PMC - PubMed

Publication types