. 2023 Sep 26;13(1):16147.
doi: 10.1038/s41598-023-43048-3.

Benchmarking data-driven filtering for denoising of TCRpMHC single-cell data

Affiliations

Benchmarking data-driven filtering for denoising of TCRpMHC single-cell data

Alessandro Montemurro et al. Sci Rep. .

Abstract

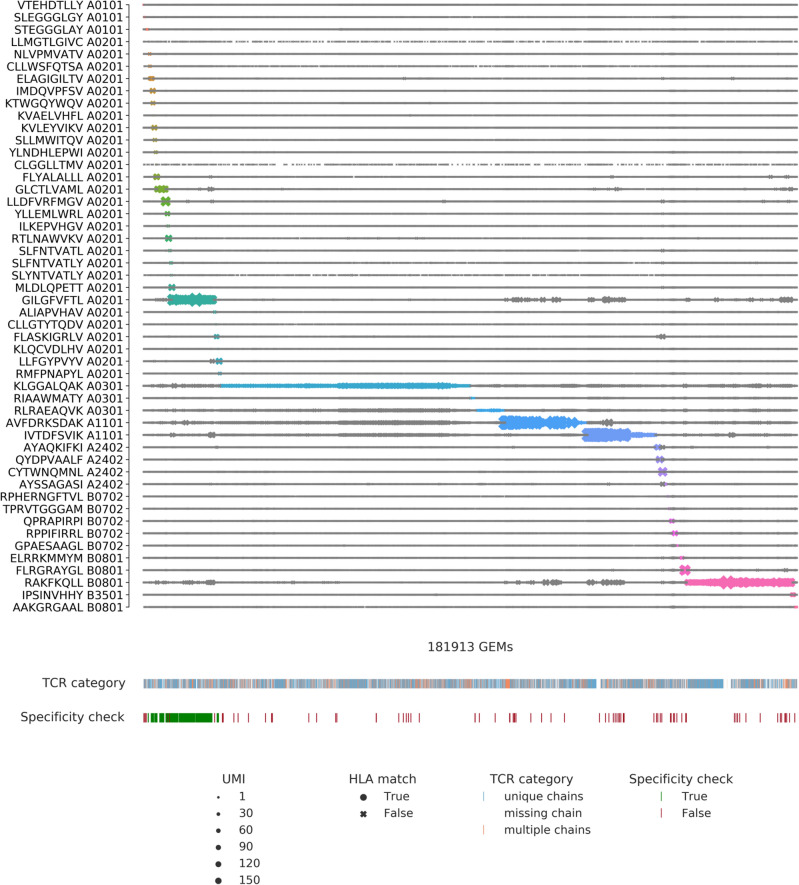
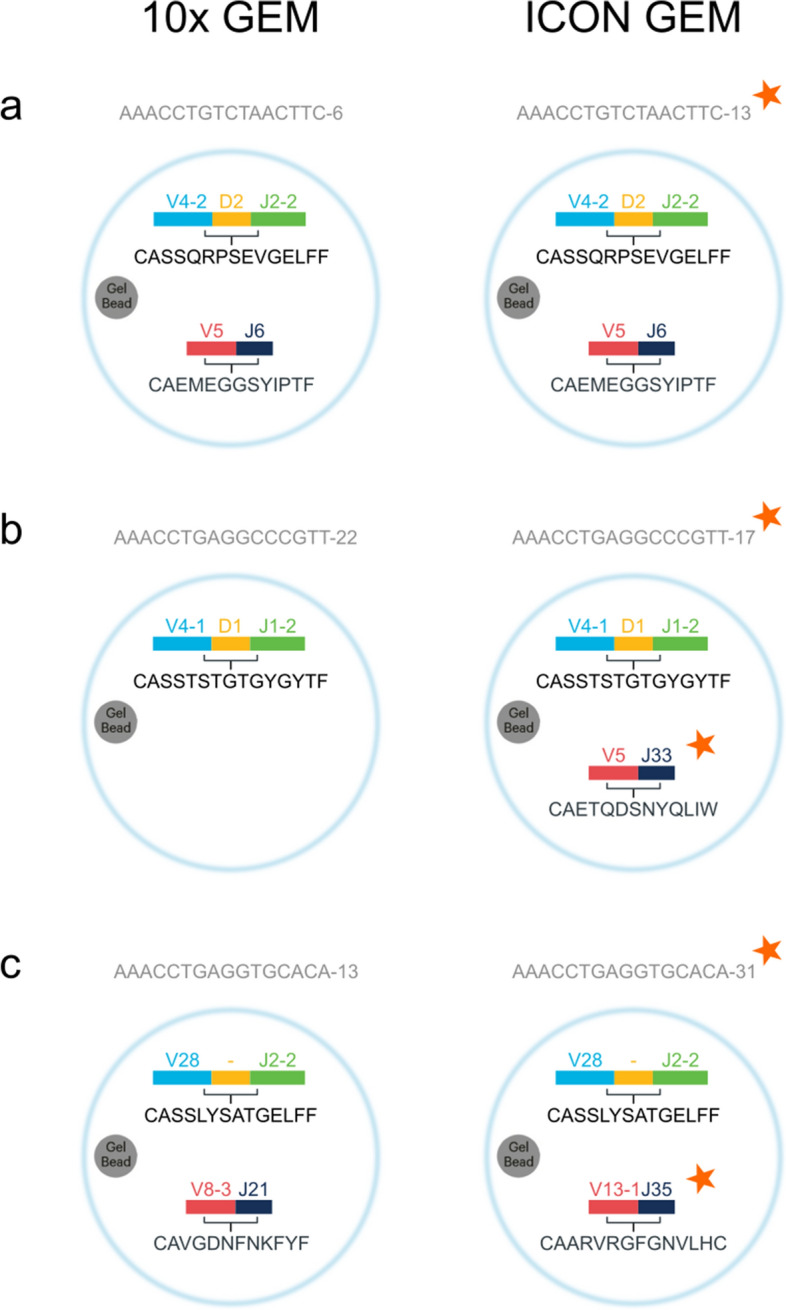
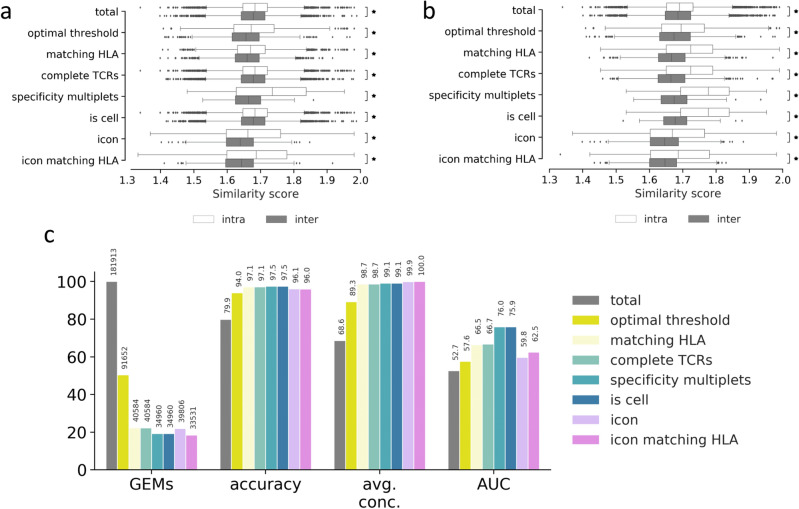
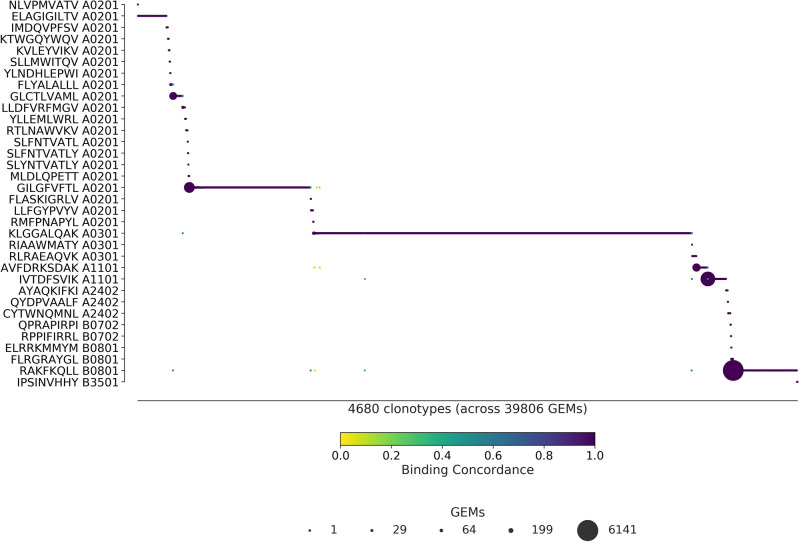
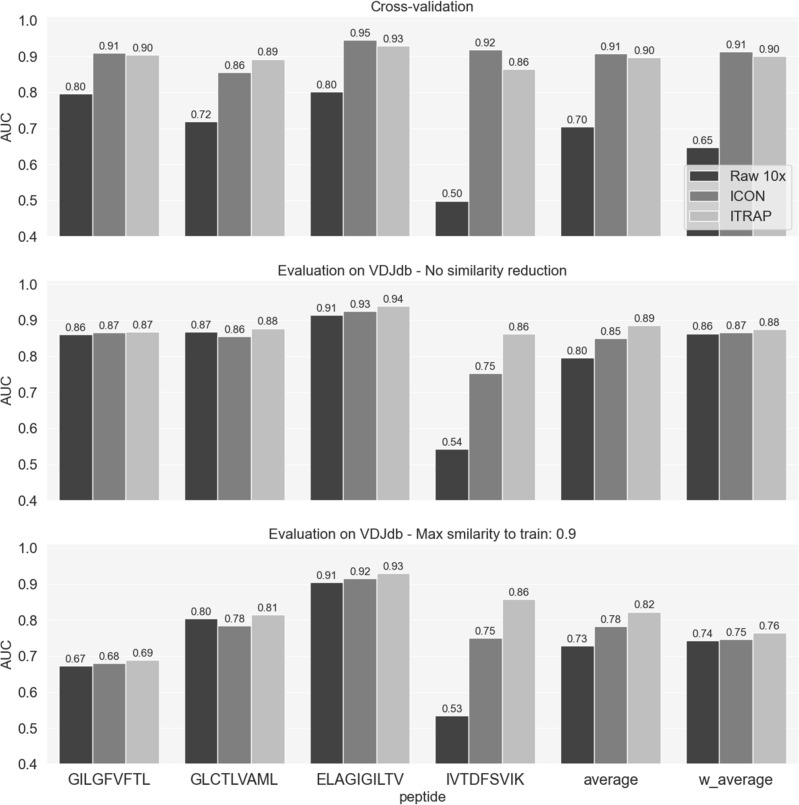
Pairing of the T cell receptor (TCR) with its cognate peptide-MHC (pMHC) is a cornerstone in T cell-mediated immunity. Recently, single-cell sequencing coupled with DNA-barcoded MHC multimer staining has enabled high-throughput studies of T cell specificities. However, the immense variability of TCR-pMHC interactions combined with the relatively low signal-to-noise ratio in the data generated using current technologies are complicating these studies. Several approaches have been proposed for denoising single-cell TCR-pMHC specificity data. Here, we present a benchmark evaluating two such denoising methods, ICON and ITRAP. We applied and evaluated the methods on publicly available immune profiling data provided by 10x Genomics. We find that both methods identified approximately 75% of the raw data as noise. We analyzed both internal metrics developed for the purpose and performance on independent data using machine learning methods trained on the raw and denoised 10x data. We find an increased signal-to-noise ratio comparing the denoised to the raw data for both methods, and demonstrate an overall superior performance of the ITRAP method in terms of both data consistency and performance. In conclusion, this study demonstrates that Improving the data quality from high throughput studies of TCRpMHC-specificity by denoising is paramount in increasing our understanding of T cell-mediated immunity.


Conflict of interest statement

The authors declare no competing interests.

Figures

Figure 1
Figure 1
Visualization of all detected pMHC barcodes (y-axis) within each of the 181,913 GEMs (x-axis). In each GEM the most abundant pMHC is marked by a color, while the remaining pMHCs in the GEM are gray. The marker size reports the UMI count of the given pMHC and the shape recounts whether the HLA allele of the pMHC matches the HLA haplotype of the donor, which is provided in the experimental report. The first color bar indicates the type of TCR chain annotation; whether the TCR has a unique αβ-pair, is missing a chain, or consists of multiple chains. The second color bar is a specificity check against the specificity databases IEDB and VDJdb. Colors highlight the GEMs where the CDR3αβ sequences are contained in the databases. The green color represents a match between the database pMHC and the detected pMHC, while red indicates a mismatch.
Figure 2
Figure 2
Illustrations of annotation inconsistencies. The figure shows examples of GEMs and their TCR annotations from 10x and ICON, respectively. The observed inconsistencies are grouped into three major groups. The inconsistencies are highlighted with a red star in each group. (a) 33,342 GEMs were mapped from the ICON set with inconsistent GEM barcode suffixes. Mapping was based on the GEM barcode nucleotide sequence and TCR annotations. (b) 1854 GEMs were missing either an α- or a β-chain in the 10x data, but not in the ICON set. (c) 1537 GEMs were fully annotated, but the TCR annotations were inconsistent between ICON and the 10x data.
Figure 3
Figure 3
Performance metrics for evaluating the filtering steps of ITRAP with ICON. The ITRAP filtering steps consist of total (raw, unfiltered data), optimal threshold obtained from grid search, matching HLA, complete TCRs with a unique set of α- and β-chain, specificity multiplets i.e., TCR-pMHC pairs observed in two or more GEMs, and "is cell" defined by 10x Genomics Cellranger. ICON yields a single output, however, an addendum has been made to also filter ICON output on HLA match between pMHC and HLA haplotype of the donor. (a) The boxplots show kernel similarity scores between CDR3β sequences of intra- (white) and inter- (dark) specificity for each of the filtering steps. A significant difference (Wilcoxon, α = 0.05) of mean between inter- and intra-specificity is marked with an asterisk to the right (b) (for details on this metric refer to text). Here, the boxplots show the cumulative effect of ITRAP filters on similarity scores. (c) Performance is measured and summarized by a number of metrics: ratio of retained GEMs (GEMs), accuracy defined by the proportion of GEMs where most abundant pMHC matches the expected binder (accuracy), average binding concordance (avg. conc.) and AUC of similarity scores (AUC). The ITRAP filters are also here cumulatively added to show increasing improvement in performance.
Figure 4
Figure 4
ITRAP-derived specificity per clonotype. ITRAP-filters consist of UMI threshold, HLA matching, and complete TCRs i.e., a unique pairing of α- and β-chain. The library peptides are listed on the y-axis and each clonotype is represented on the x-axis. Below the x-axis is annotated the total number of clonotypes and GEMs in the presented data. The marker size shows the number of GEMs supporting a given specificity. The color indicates the binding concordance which is calculated as the fraction of GEMs within a clonotype that supports a given pMHC. The higher the concordance, the larger the fraction of supporting GEMs.
Figure 5
Figure 5
ICON-derived specificity per clonotype. The library peptides are listed on the y-axis and each clonotype is represented on the x-axis. Below the x-axis is annotated the total number of clonotypes and GEMs in the presented data. The marker size shows the number of GEMs supporting a given specificity. The color indicates the binding concordance which is calculated as the fraction of GEMs within a clonotype that supports a given pMHC. The higher the concordance, the larger the fraction of supporting GEMs.
Figure 6
Figure 6
Performance of NetTCR-2.1 in terms of AUC on the raw 10x data and on the filtered datasets. The AUC is given on the concatenated test sets from cross-validation and on the external evaluation set from VDJdb (before and after removing evaluation TCRs similar to sequences in the training set, see text). 'average' refers to the mean of the AUC values across peptides; 'w_average' is a weighted average of AUCs across peptides, weighted by the number of positive TCRs for the peptides in the dataset in consideration.

References

    1. Krangel MS. Mechanics of T cell receptor gene rearrangement. Curr. Opin. Immunol. 2009;21(2):133–139. doi: 10.1016/j.coi.2009.03.009. - DOI - PMC - PubMed
    1. Mahe E, Pugh T, Kamel-Reid S. T cell clonality assessment: past, present and future. J. Clin. Pathol. 2018;71(3):195–200. doi: 10.1136/jclinpath-2017-204761. - DOI - PMC - PubMed
    1. Gascoigne NRJ, Rybakin V, Acuto O, Brzostek J. TCR signal strength and T cell development. Annu. Rev. Cell Dev. Biol. 2016;6(32):327–348. doi: 10.1146/annurev-cellbio-111315-125324. - DOI - PubMed
    1. Jung D, Alt FW. Unraveling V(D)J recombination; insights into gene regulation. Cell. 2004;116(2):299–311. doi: 10.1016/S0092-8674(04)00039-X. - DOI - PubMed
    1. Jackson KJL, Kidd MJ, Wang Y, Collins AM. The shape of the lymphocyte receptor repertoire: Lessons from the B cell receptor. Front. Immunol. 2013;2(4):263. - PMC - PubMed

Publication types