Mechanisms for leaf color changes in Osmanthus fragrans 'Ziyan Gongzhu' using physiology, transcriptomics and metabolomics
- PMID: 37752431
- PMCID: PMC10523669
- DOI: 10.1186/s12870-023-04457-8
Mechanisms for leaf color changes in Osmanthus fragrans 'Ziyan Gongzhu' using physiology, transcriptomics and metabolomics
Abstract
Background: Color-leaved O. fragrans is a variety of Osmanthus fragrans, which has both the fragrance of Osmanthus and the color of color-leaved plants. However, the molecular mechanism of color change of color-leaved O. fragrans is not clear. In this study, we analyzed the regulatory mechanism of four different color leaves of 'Ziyan Gongzhu' through physiological, transcriptome and metabolome levels.
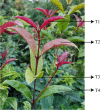
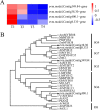
Results: Firstly, we measured the leaf pigments content and leaf chromatic parameters for correlation analysis, indicating a significant correlation between them. Overall, the content of chlorophyll a + b is low and the content of anthocyanin is high in T1 and T2 leaves, along with low expression of chlorophyll synthesis genes (HEMA, CHLG, and CAO, etc.) and high expression of anthocyanin synthesis genes (F3H, F3'H, DFR and ANS, etc.), resulting purple red and light purple in T1 and T2 leaves, respectively. It was also found that the pigment closely related to the color leaves of 'Ziyan Gongzhu' was cyanidin. The content anthocyanins, may be regulated by two putative MYB activators (OfMYB3 and OfMYB4) and two putative MYB repressors (OfMYB1 and OfMYB2). In contrast, the content of chlorophyll a + b is high and the content of anthocyanin is low in T3 and T4 leaves, along with high expression of chlorophyll synthesis genes and low expression of anthocyanin synthesis genes, resulting yellow green and dark green in T3 and T4 leaves, respectively. And abnormal chloroplast development affects chlorophyll content in T1, T2, and T3 leaves. Although the content of carotenoids first dropped in T2 leaves, it then rapidly accumulated in T4 leaves, in sync with the increase in the expression of genes related to carotenoid biosynthesis (ZDS, LHYB, and ZEP, for example). Analysis of photosynthetic, carbohydrate and hormone-related differentially abundant metabolites (DAMs) and DEGs found that they may participate in the regulation of leaf color change of 'Ziyan Gongzhu' by affecting pigment synthesis.
Conclusion: Our results pave the way for a comprehensive knowledge of the regulatory processes governing leaf color in 'Ziyan Gongzhu' and identify possible genes for application regarding molecular colored-leaf cultivar breeding.
Keywords: Anthocyanin; Carotenoid; Chlorophyll; Metabolomics; OfMYB genes; Osmanthus fragrans ‘Ziyan Gongzhu’; RNA-seq.
© 2023. BioMed Central Ltd., part of Springer Nature.
Conflict of interest statement
The authors declare no competing interests.
Figures


Similar articles
-
The Effects of Ultraviolet A/B Treatments on Anthocyanin Accumulation and Gene Expression in Dark-Purple Tea Cultivar 'Ziyan' (Camellia sinensis).Molecules. 2020 Jan 15;25(2):354. doi: 10.3390/molecules25020354. Molecules. 2020. PMID: 31952238 Free PMC article.
-
Biochemical and transcriptomic analyses reveal that critical genes involved in pigment biosynthesis influence leaf color changes in a new sweet osmanthus cultivar 'Qiannan Guifei'.PeerJ. 2021 Oct 8;9:e12265. doi: 10.7717/peerj.12265. eCollection 2021. PeerJ. 2021. PMID: 34707941 Free PMC article.
-
SWATH-MS based proteomics reveals the role of photosynthesis related proteins and secondary metabolic pathways in the colored leaves of sweet olive (Osmanthus fragrans).BMC Genomics. 2024 Nov 1;25(1):1026. doi: 10.1186/s12864-024-10867-1. BMC Genomics. 2024. PMID: 39487388 Free PMC article.
-
Secondary Metabolites of Osmanthus fragrans: Metabolism and Medicinal Value.Front Pharmacol. 2022 Jul 18;13:922204. doi: 10.3389/fphar.2022.922204. eCollection 2022. Front Pharmacol. 2022. PMID: 35924042 Free PMC article. Review.
-
Multi-Omics Research Accelerates the Clarification of the Formation Mechanism and the Influence of Leaf Color Variation in Tea (Camellia sinensis) Plants.Plants (Basel). 2024 Jan 31;13(3):426. doi: 10.3390/plants13030426. Plants (Basel). 2024. PMID: 38337959 Free PMC article. Review.
Cited by
-
Integrative Transcriptomics and Proteomics Analysis of a Cotton Mutant yl1 with a Chlorophyll-Reduced Leaf.Plants (Basel). 2024 Jun 28;13(13):1789. doi: 10.3390/plants13131789. Plants (Basel). 2024. PMID: 38999629 Free PMC article.
-
Integrative Targeted Metabolomics and Transcriptomics Reveal the Mechanism of Leaf Coloration in Impatiens hawkeri 'Sakimp005'.Int J Mol Sci. 2024 Dec 28;26(1):174. doi: 10.3390/ijms26010174. Int J Mol Sci. 2024. PMID: 39796032 Free PMC article.
-
MsMYB62-like as a negative regulator of anthocyanin biosynthesis in Malus spectabilis.Plant Signal Behav. 2024 Dec 31;19(1):2318509. doi: 10.1080/15592324.2024.2318509. Epub 2024 Feb 20. Plant Signal Behav. 2024. PMID: 38375800 Free PMC article.
-
Transcriptomic and metabolic analysis unveils the mechanism behind leaf color development in Disanthus cercidifolius var. longipes.Front Mol Biosci. 2024 Feb 6;11:1343123. doi: 10.3389/fmolb.2024.1343123. eCollection 2024. Front Mol Biosci. 2024. PMID: 38380429 Free PMC article.
-
Variability in Leaf Color Induced by Chlorophyll Deficiency: Transcriptional Changes in Bamboo Leaves.Curr Issues Mol Biol. 2024 Feb 14;46(2):1503-1515. doi: 10.3390/cimb46020097. Curr Issues Mol Biol. 2024. PMID: 38392215 Free PMC article.
References
-
- Shang F, Yin Y, Xiang Q. The culture of sweet osmanthus in China. J Henan Univ Nat Sci. 2003;43:136–139.
-
- Xiang Q, Liu Y. An illustrated monograph of the sweet osmanthus variety in China. Hangzhou: Zhejiang Science & Technology Press; 2008.
-
- Kerio LC, Wachira FN, Wanyoko JK, Rotich MK. Characterization of anthocyanins in Kenyan teas: Extraction and identification. Food Chem. 2012;131:31–38.
MeSH terms
Substances
LinkOut - more resources
Full Text Sources
Miscellaneous

